One of the greatest strengths of Redux is debuggability — by logging actions and state during an app’s execution, developers can easily understand code errors, race conditions, network errors and other sources of bugs.
In local development it is standard practice to use tools like redux-logger or redux-devtools for time-travel debugging and viewing Redux actions. But the benefits of using Redux logs to easily fix bugs are most significant in production.
To do this, some developers build home-grown solutions or leverage existing backend logging tools, but making this work is not trivial. Redux data must be collected and uploaded efficiently, without compromising application performance, and on the backend, this data (which is quite sizable) must be stored and made easily searchable for debugging issues.
Enter LogRocket…
LogRocket is the first production Redux logging tool for webapps. It has a highly-optimized JavaScript SDK + Redux middleware, and can easily scale to support apps with millions of users.
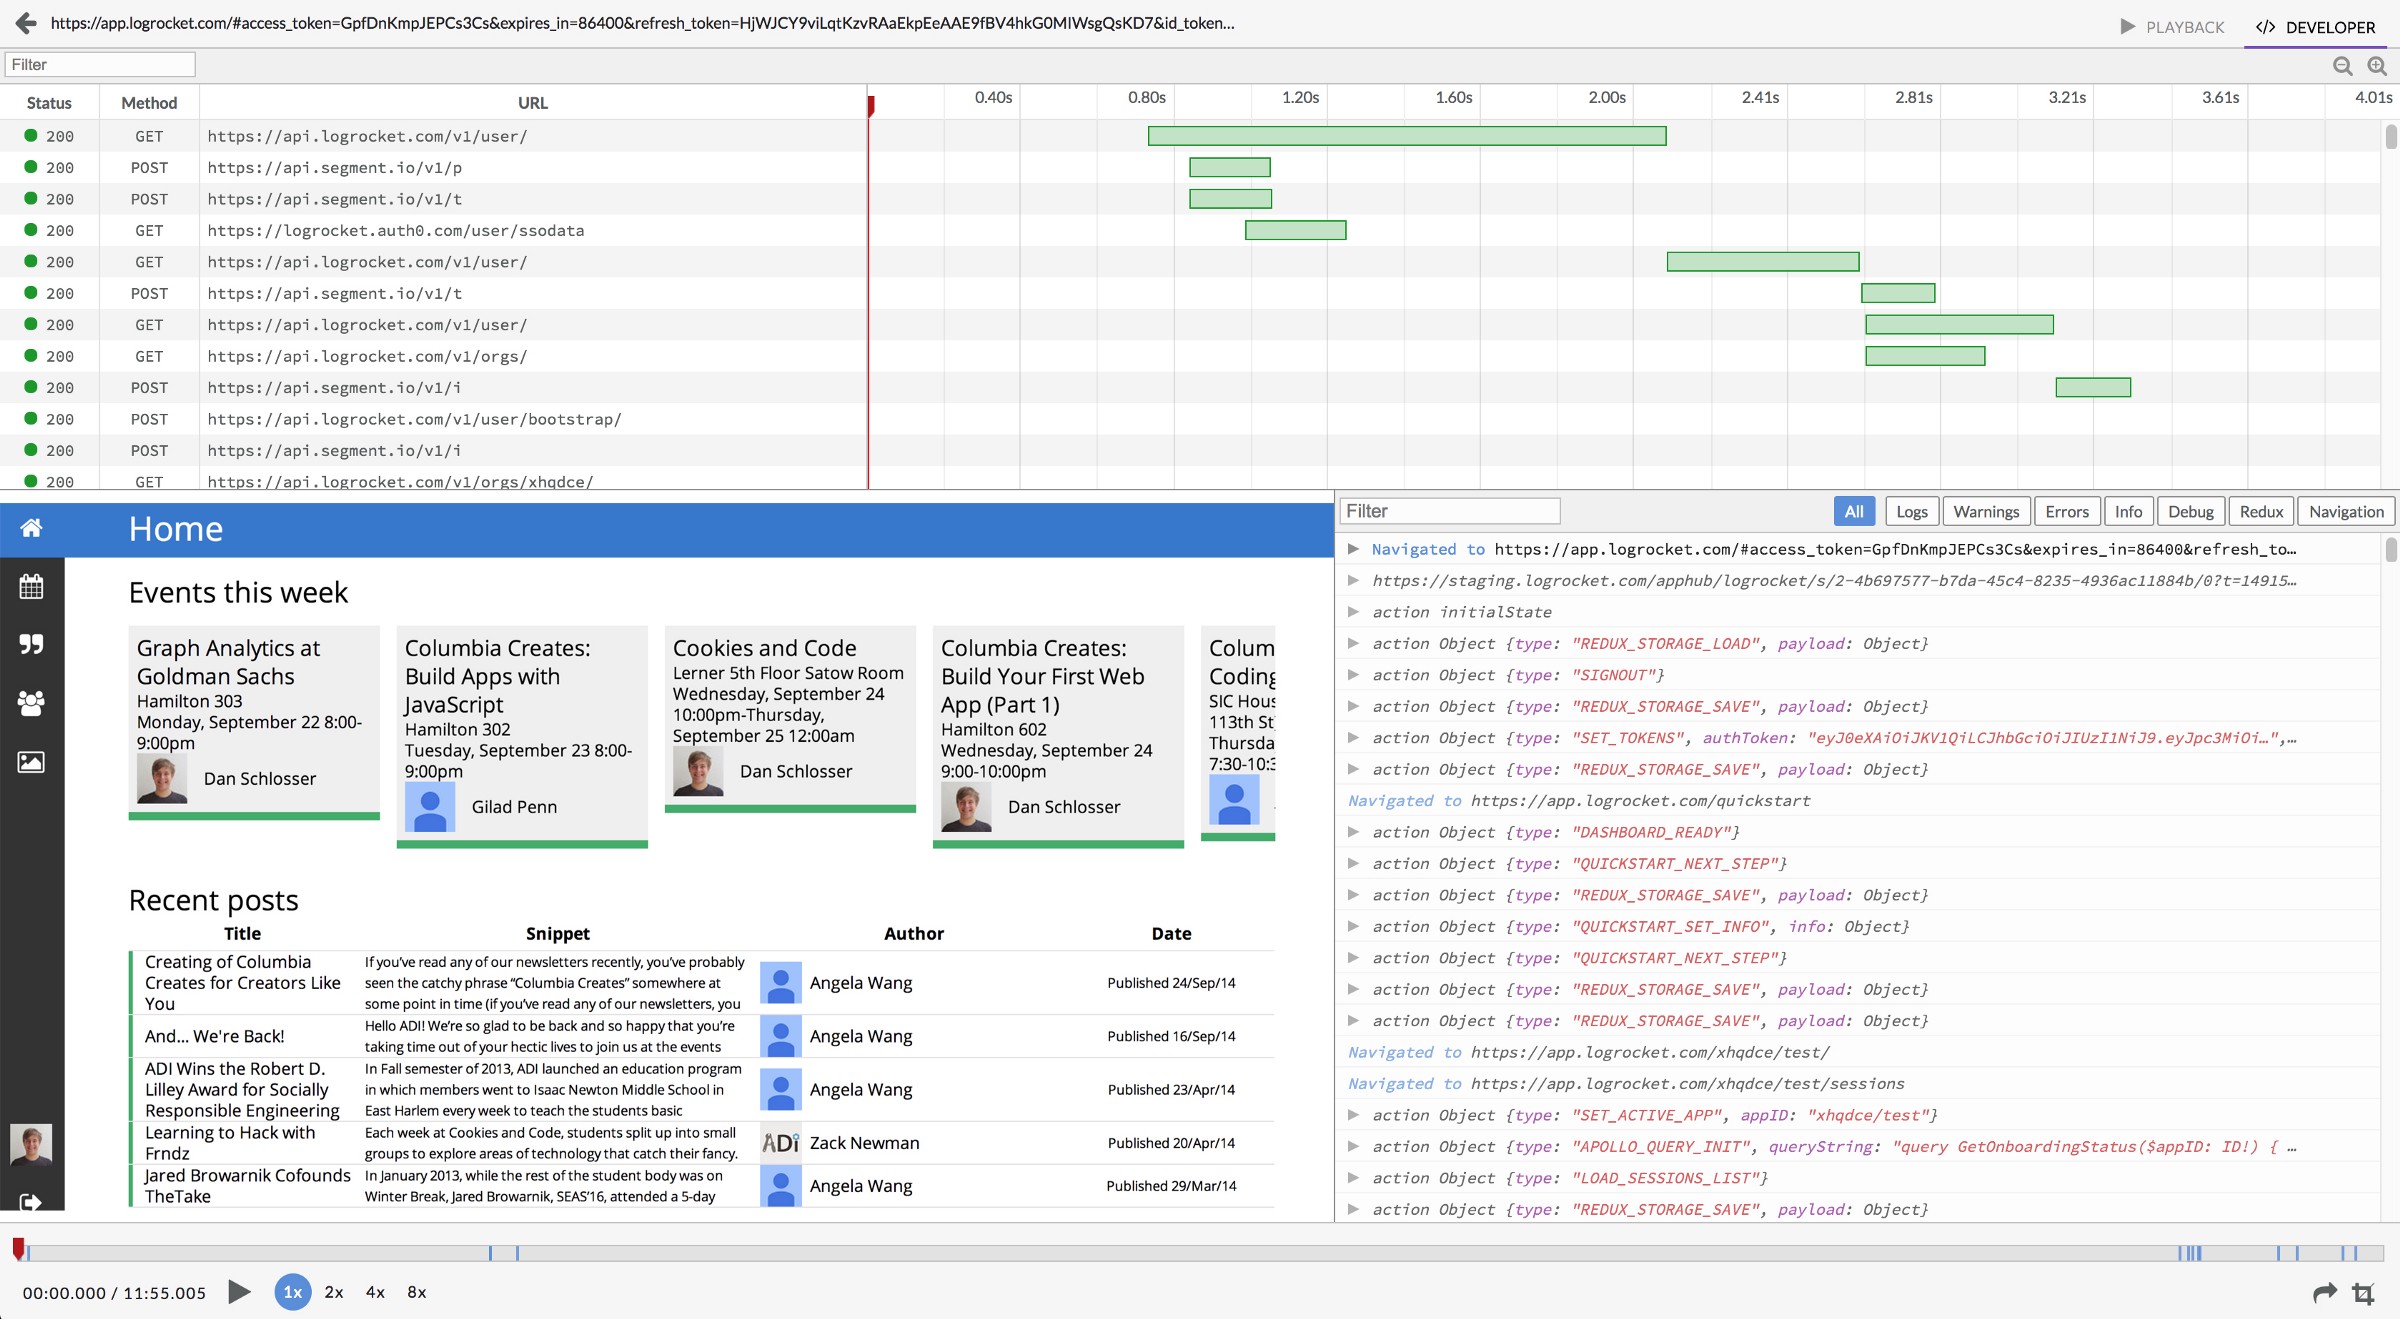
In addition to recording Redux data, LogRocket also records network requests, console logs, JavaScript errors, and full DOM video. Having this context in addition to Redux logs is crucial when fixing bugs since it essentially has all of the information you’d find in the Chrome dev-tools when developing locally.
In this post, I’ll take a quick look at setting up LogRocket in a production app. Then, I’ll discuss how to leverage Redux to maximize app debuggability.
Setting up LogRocket
Setting up LogRocket is easy, and only requires adding a few lines of code to your app:
- Install with NPM:
npm i --save logrocket. - Create a free account at https://app.logrocket.com, and take note of your application id.
- Initialize LogRocket in your app:
import LogRocket from 'logrocket';// Initialize LogRocket with your app IDLogRocket.init(<your_application_id>);
4. Add the Redux middleware.
import { applyMiddleware, createStore } from 'redux';

const store = createStore(
  reducer, // your app reducer
  applyMiddleware(middlewares, LogRocket.reduxMiddleware()),
);
That’s it for the basic setup- this is all you need to get started with LogRocket! Later, I’ll discuss customizing LogRocket by doing things like action blacklisting, data scrubbing, and video configuration.
Viewing Logs from user sessions

LogRocket groups logs from each user session into a “session”, accessible with a unique URL. You can get a session link in your app by calling LogRocket.getSessionURL() with a callback like this:
LogRocket.getSessionURL(url => {
  console.log(url)
});
This will print a link into the JavaScript console for the current session when you run your app. Later, I’ll show how to integrate LogRocket into error tracking and support workflows, but for now, just clicking this link in the console will let you see the logs for your current session when you run your app.

The Redux log viewer shows all of the Redux actions that occurred in the app during this session. Clicking on a redux action lets you explore application state before and after the action to see the effect it had on your store.

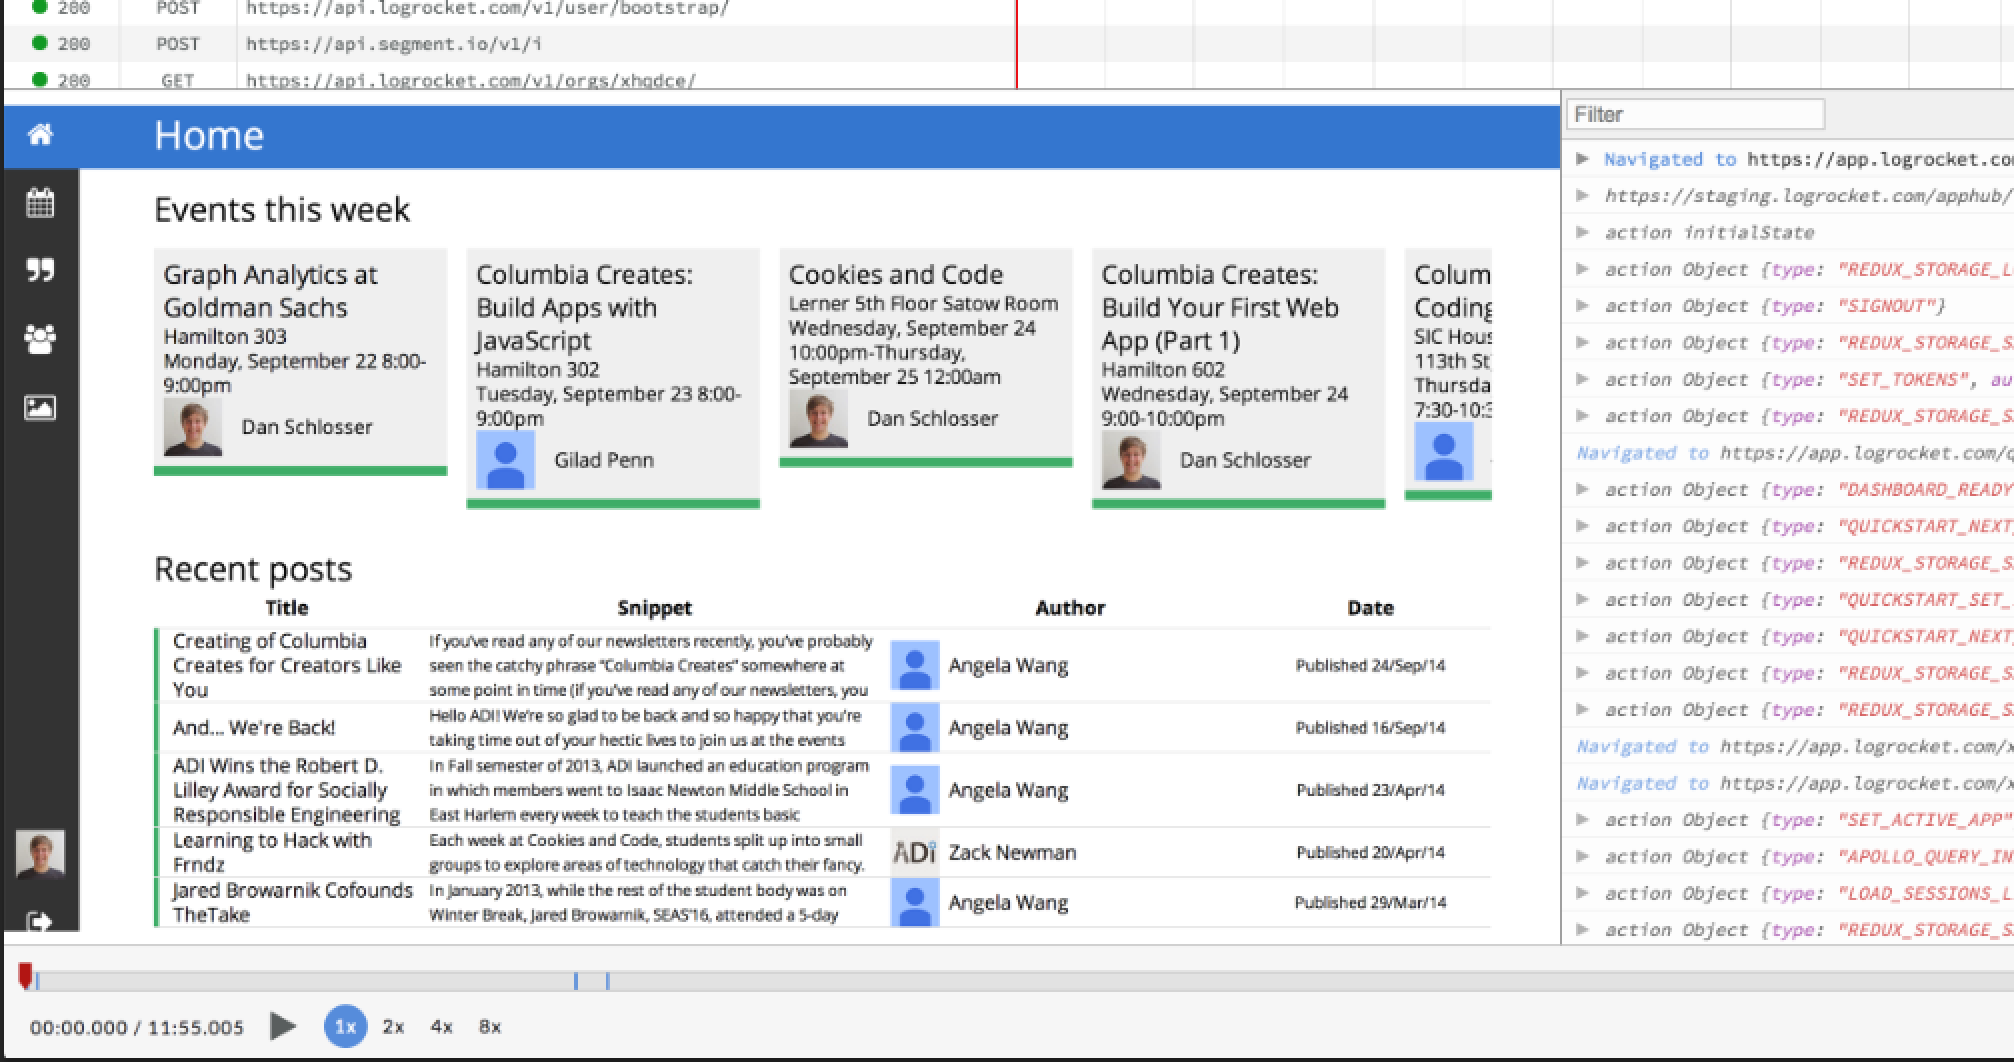
Sometimes Redux logs alone aren’t enough to understand a bug, especially when dealing with user-reported issues. LogRocket’s DOM replay helps here by letting you see exactly what a user saw in your app.
Since this video is actually a reconstruction of the DOM (and not a real video) you can inspect HTML/CSS to understand visual bugs, or play at 2x speed to gain a quick understanding of what a user did in the app when handling support issues.

LogRocket captures both network requests and responses and lets you dig in to specific requests and see the headers and body. The waterfall chart shows timings, making it easy to see which requests were slow, or if a potential race condition occurred.
Advanced configuration
DOM scrubbing
If your app has sensitive data like a password or credit card input, you can add the class _lr-hide to any DOM nodes to prevent that data from ever leaving the browser.
Action scrubbing
Sometimes an app may have actions that are repeated very frequently, and not of use when debugging. You can scrub these by providing an actionSanitizer function in the Redux middleware. Any action for which this function returns null won’t be logged.
LogRocket.reduxMiddleware({
  actionSanitizer: function (action) {
    if (action.type === 'ignoreThis') {
      return null;
    }
    return action;
  },
});
State sanitization
Similar to action scrubbing, you can prevent certain subtrees of your Redux store from being logged like this:
LogRocket.reduxMiddleware({
  stateSanitizer: function (state) {
    return {
      ...state,
      removeThisKey: undefined,
    };
  },
});
Integrating Redux logging into your workflow
Redux logs often hold the key to solving crashes and user-reported issues, so it can be helpful to integrate redux logging with error reporting and support tools.
Error reporting:
Most error reporting tools have an API for attaching arbitrary context to bug reports. We can make use of this by attaching a LogRocket recording URL to each bug report, so when we are notified of a bug, we can play back the Redux actions to figure out what happened.
As an example, in Sentry (a popular crash-reporting tool) the integration looks like this, and most other crash reporting tools have similar APIs.
Raven.setDataCallback(function (data) {
  data.extra.sessionURL = LogRocket.sessionURL;
  return data;
});
Support:
All too often, users will report issues but not give enough context to figure out exactly what happened.
If you are using a chat support tool like Intercom, you can integrate LogRocket directly so that it adds a note with a recording URL whenever a user starts chatting.

Or, if you are integrating with a more general analytics tool, you can add recording URL’s with a tracking API like this:
LogRocket.getSessionURL(function (sessionURL) {
  analytics.track('LogRocket recording', sessionURL);
});
Making the most of production Redux logging
Production logging is immediately useful in most Redux apps, but by architecting your app with logging in mind, you can ensure that logs are maximally useful when debugging issues.
Try to keep most state in Redux
I don’t want to get into the debate on local vs Redux state here, but when deciding whether a given piece of state should be in Redux, ask yourself if seeing that state could be helpful when debugging issues. If the answer is yes, consider putting that state in Redux so that it will be logged with crash reports and user issues.
Use data fetching libraries that leverage Redux
Libraries like apollo-client for GraphQL, and redux-query for REST both facilitate fetching data from the network via Redux. They use Redux as a persistence layer, meaning that when debugging issues, you can inspect your Redux logs to see what data these clients have fetched.
If you’d prefer a simpler approach, you can roll your own data fetching “framework” by simply dispatching explicit actions when querying and receiving data from the network.
Use Redux to handle sources of non-determinism
When accessing data from APIs like websockets, local storage, IndexedDB, or even Date(), consider dispatching Redux actions with the result, so that you can easily debug these in the future. For example, when listening on a websocket, dispatch a Redux action on every message- that way you can see the data in your Redux logs.
Leverage other console APIs
Console methods like console.time(), console.count() and console.group() let you add rich data to your logs like React component render counts, transaction timings and component lifecycle logs. If you’re interested in learning more, I wrote a post about this here.
Build and upload source maps to LogRocket
LogRocket supports source maps which you can upload via a cli. By doing this you can see symbolicated stack traces for JavaScript errors, Redux actions, console logs and network requests, which lets you see where particular actions were triggered in your code.
Conclusion
React and Redux are often lauded as tools for building maintainable applications — a significant component of which is debuggability. Logging Redux data in production gives such insight since bugs and other user-reported issues can be easily debugged by inspecting Redux state, network requests and the DOM.
When architecting a Redux app, consider practices (such as the few I outlined above) that leave a clearer audit-trail to increase debuggability.
Finally, I’d like to note that fixing is bugs is just one application of Redux logging. In part 2 of this series, I will write about how to build an analytics pipeline with your Redux data.
Get set up with LogRocket's modern error tracking in minutes:
- Visit https://logrocket.com/signup/ to get an app ID
-
Install LogRocket via npm or script tag.
LogRocket.init()must be called client-side, not server-side$ npm i --save logrocket // Code: import LogRocket from 'logrocket'; LogRocket.init('app/id');// Add to your HTML: <script src="https://cdn.lr-ingest.com/LogRocket.min.js"></script> <script>window.LogRocket && window.LogRocket.init('app/id');</script> - (Optional) Install plugins for deeper integrations with your stack:
- Redux middleware
- NgRx middleware
- Vuex plugin
Resources
- redux-logger -: Log Redux actions/state to the console (locally)
- redux-devtools -: Logging and time-travel debugging (locally)
- LogRocket -: Production Redux Logging
- Tips for building easily debuggable Redux apps: https://blog.logrocket.com/maximizing-debuggability-with-redux-79b2ad07b64c


