You don’t build products in a vacuum. When you bring a product to market, you introduce it to customers who have preexisting notions of what they need and want, much of which has been shaped by competitors. That’s why being able to understand and analyze the competitive landscape is a crucial part of product strategy.

You’ll need to figure out where you fit in the market, how you’ll squeeze your way in, and how you’ll differentiate from the noise. In this post, you’ll learn how you can go about conducting a competitive landscape analysis so that you can define a product strategy that accounts for the ever changing competitive landscape.
A competitive landscape consists of the competitors who make up the market that you’re trying to tackle. These competitors aren’t necessarily direct competitors, but rather alternatives that your customers would consider when purchasing your products. They compete for the same mindshare and budget as you do.
Typically, when seeking to understand your competitive landscape, you’ll want to deeply research your competitors and compare various aspects of their business and products with your own company’s business and products.
Understanding the competitive landscape that you function in is critical for strategic planning, as it helps you prioritize which areas to focus on. This could be figuring out which features to build first, which channels to prioritize, which marketing or sales strategies to deploy, and much more.
By understanding what your competitive landscape is doing, you can figure out what unique wedge you can leverage to capture your market, as well as identify potential forward-looking risks that might impact your business as your competitive landscape evolves. Any strategic plan should incorporate learnings from the competitive landscape.
Before getting into analyzing or drawing conclusions about your competitive landscape, you’ll want to first do extensive research to deeply understand your competitors. A great way to go about this is to create a competitive landscape research document and create one-pagers for your biggest competitors. Make sure to include not just your most direct competitors, but also your indirect competitors.
A great way to build this competitive list is to talk to customers and ask them what they would use if they didn’t buy your product. Often, they might say that they would build internally or force fit another product they already have to solve your use case. The products that they choose to force fit into your use case should be considered “competitors” in your competitive landscape.
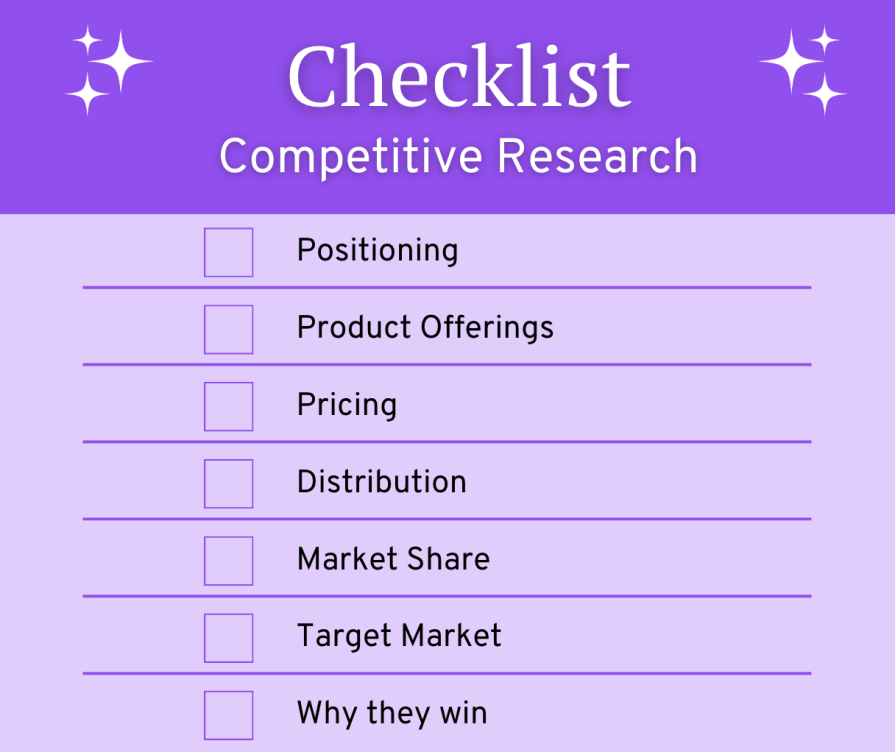
So what components should you include in these competitive one-pagers? Here’s my checklist that I typically use when conducting research on competitors:

Now that you’ve created a document with extensive research about your competitors, it’s time to pull insights out of all this raw research. These insights should help you group your competitors into different categories and themes, and perhaps most critically, understand how you’re positioned against those competitors. This is where existing frameworks (and the templates that come with them) can be incredibly useful.
There are many templates that you can leverage to help you get started on a competitive analysis. You should treat templates more like guidelines on how to think through competitive analysis instead of using them as a source of truth on how competitive analyses should be conducted.
Every company is different, every product is different, and every market is different. However, leveraging templates can help ensure that you aren’t missing any critical angles. They are also effective tools to help frame your thinking.
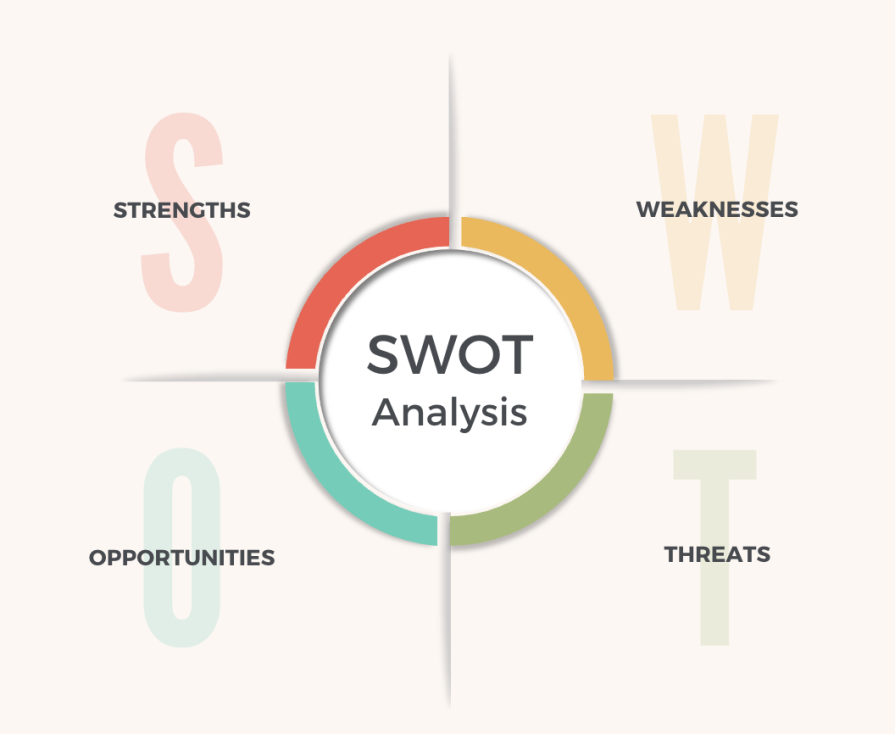
The SWOT analysis is a very popular framework used to analyze your business and how it compares to the competitive landscape you’re in. A SWOT Analysis includes the following:
It’s common to do a SWOT analysis in a two-by-two matrix, similar to the one shown below. But ultimately, I find that it’s hard to actually include all the information and nuance you need in a box! So it’s also perfectly fine to map out your SWOT analysis as a document:

Once you’ve completed your SWOT analysis, what should you do with the results? Well, you can map each item in your SWOT analysis to a tangible project that you can do to address each item.
For example, let’s say one of the threats is that your competitor has a really active community that they use to farm leads. Perhaps something you can do about that is to build your own community, but focus on a very narrow niche and in-person events.
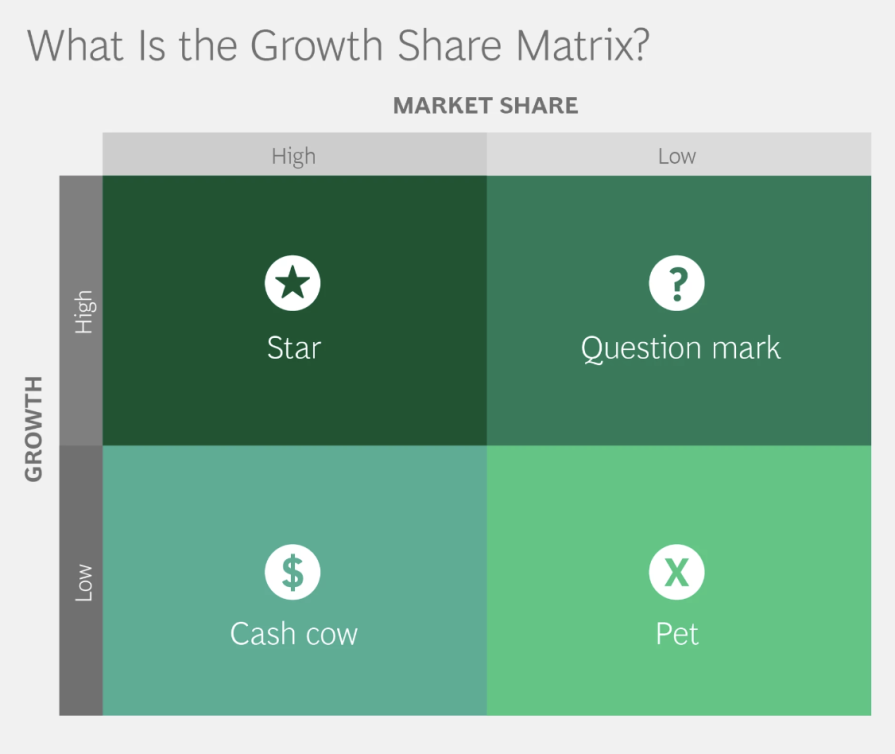
I would be remiss not to mention a template produced by one of the biggest consulting companies out there. The Growth Share Matrix essentially helps you think through what product opportunities to prioritize based on two major axes: market attractiveness and company competitiveness.
The question to ask yourself regarding market attractiveness is how much market growth do you expect? For company competitiveness, the question to ask yourself is, how much market share can you realistically capture? And from here, you can place the various projects that you were thinking of accomplishing onto this new matrix, which prioritizes and analyzes which investments to spend more time on:

Now obviously, high market share and high growth opportunities are excellent and low market share and low growth opportunities are not. But interestingly, high market share, low growth opportunities are also worth investigating as they could help generate stable, measurable revenue even without substantial growth.
Like SWOT analysis, Porter’s Five Forces is a very well known framework for thinking through how attractive an investment opportunity is. The five forces describe the competitive landscape that a company operates in, and helps you evaluate how attractive a given market is:
The competitive research one-pagers that you completed earlier on can help you really flesh out Porter’s Five Forces. Once you’ve fleshed out each section, what do you do with the insights? I would suggest a combination of the strategies discussed earlier to leverage the SWOT analysis and BCG Growth Matrix.
First, focus on the three categories: threat of new entrants, threat of substitutes, competitive rivalry. Identify the key trends there, and then come up with some ideas on how you want to beat your competitors or mitigate threats. Next, take those ideas, and think through the attractiveness of those ideas in terms of bargaining power.
If you decide to take on a project to reduce a threat, will you be able to earn significant revenue from customers without it becoming a race to the bottom? Will you be able to do so in a cost effective way? You can analyze different ideas on what to do next by combining the five forces and evaluating your ideas from multiple angles.
Gartner is a large market research firm that publishes Magic Quadrants for many industries. The x-axis of the Magic Quadrant is typically “completeness of vision” with the “ability to execute” as the y-axis. Companies looking to procure net new products will look at Gartner’s Magic Quadrant and select a vendor in the top right quadrant.
Although Magic Quadrants are typically a bit too high level to use internally when planning out product strategy, they do offer a great way to visualize competitors upon different axes. A version of the Magic Quadrant that is useful internally is to map competitors on two axes: strength of product and go-to-market dominance. In this way, you can quickly see which competitors have great products, and which ones are great at selling and distributing them.
Understanding your competitive landscape is a critical piece to building any product strategy. Most importantly, it will help you prioritize which projects to work on to keep you ahead of the competition.
As you think through how to tackle a competitive landscape analysis, start first with understanding and researching your competitors. Then, leverage any one of the many templates out there to help you analyze your research and pull interesting insights. By following the steps outlined in this post, you’ll be well on your way to building a thoughtful product strategy.
Featured image source: IconScout
LogRocket identifies friction points in the user experience so you can make informed decisions about product and design changes that must happen to hit your goals.
With LogRocket, you can understand the scope of the issues affecting your product and prioritize the changes that need to be made. LogRocket simplifies workflows by allowing Engineering, Product, UX, and Design teams to work from the same data as you, eliminating any confusion about what needs to be done.
Get your teams on the same page — try LogRocket today.

Great product managers spot change early. Discover how to pivot your product strategy before it’s too late.

Thach Nguyen, Senior Director of Product Management — STEPS at Stewart Title, emphasizes candid moments and human error in the age of AI.

Guard your focus, not just your time. Learn tactics to protect attention, cut noise, and do deep work that actually moves the roadmap.

Rumana Hafesjee talks about the evolving role of the product executive in today’s “great hesitation,” explores reinventing yourself as a leader, the benefits of fractional leadership, and more.