As a product manager you already know the importance of understanding what your consumers want and how to keep them happy. Successfully managing your customers reduces churn and leads to higher retention, as well as improved adoption of future users.

To make this easier, you can use behavioral segmentation, a marketing strategy that breaks down and categorizes your consumers.
Behavioral segmentation is a data analysis tool that divides up your customers into segments on the basis of their behaviors, preferences, and decision-making patterns. By doing so, you receive a clear picture of the pool of consumers you’re working with and what motivates their interactions with your product.
Not only does it let you uncover additional insights about users, but it’s a first step for more advanced quantitative analysis methods.
In this article, you will learn what behavioral segmentation is, the different types of segmentation, and how to best use it to improve the success of your product.
Whereas basic segmentation differentiates users by some high-level characteristics, such as country, demographics, source, and device
behavioral segmentation differentiates users based on how they behave with the product.
Behavioral segmentation tends to be more insightful because you can better understand who your users are based on what they do with your product, rather than simply who they are.
Once you understand what differentiates the most successful and least successful segments, you can prompt users to join the most successful ones by encouraging specific actions and behaviors.
While managing a product, it’s important to remember that different groups of people receive value from your product in different ways. Some of your users will focus more on feature X, while others focus on feature Y. They can also use your product to solve slightly different problems in somewhat different contexts.
Understanding these differences will help you adjust your product roadmap to cater to the various needs of the segments. However, aggregate numbers don’t tell you a detailed enough story to guide your decision making.
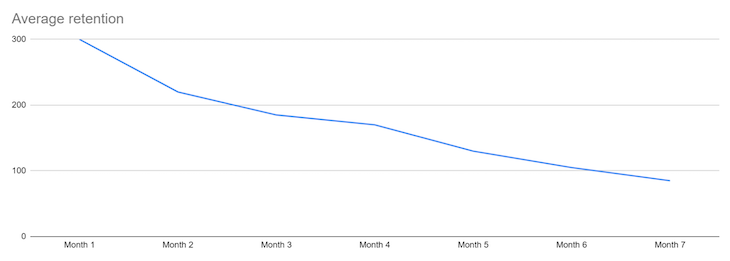
For example, if you see an average retention for all your users, you might get a sense of how well the product performs, but it’s hardly actionable:
On the other hand, if you analyze retention based on distinctive segments, you might spot a few interesting insights:
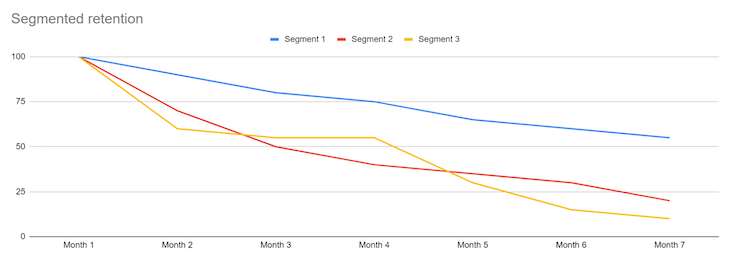
This sparks questions, such as:
Proper segmentation provides a starting point for you to explore what differentiates the most successful segment from the least successful and how you can act on it.
Within behavioral segmentation you can distinguish between two major types:
Feature usage segmentation differentiates groups of users based on the features that they use. It’s especially useful for more complex products that offer different features for different use cases.
By monitoring users based on their feature adoption, you can:
Keep in mind that features rarely live in isolation. In the case of more complex products, it might make sense to segment users based on the groups of features they use.
For example, you can analyze different segments of users on your enterprise management application based on whether they use your set of HR management tools or not.
X in Y time segmentation differentiates user groups based on how often they performed specific actions within a certain timeframe.
For example, you can differentiate Twitter users based on how many people they started following within their first seven days on the platform. You could then create segments such as:
Segmenting users in this way enables you to investigate how the number of new followings within the first seven days impacts their further behavior and retention.
Now let’s take a look at examples of how feature-based and X in Y time segmentation can help you uncover valuable insights:
Pretend you are tasked with increasing long-term user retention for a VOD platform. The current retention curve looks like the following:
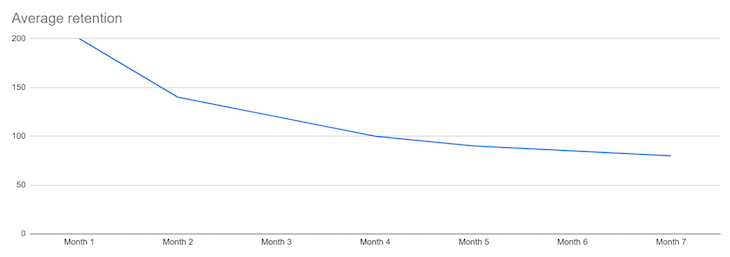
However, an aggregate number doesn’t tell us the whole story and is hardly actionable.
VOD platform offer two main use cases:
So, we decide to look at retention through the lenses of movie versus TV series watchers. As a result, we get the following chart:
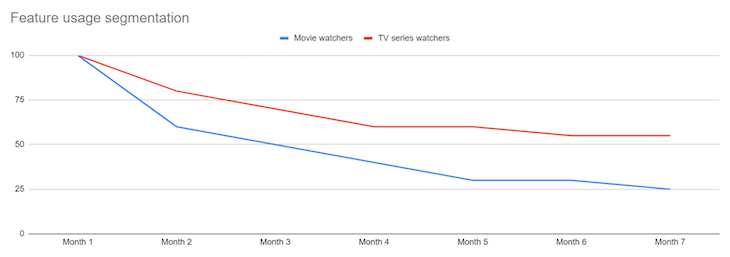
The chart shows that TV series watchers tend to retain better than movie watchers. Based on that, you can already plan some immediate actions to improve overall retention, such as:
But this also invites additional questions. What’s so different about these two segments? After investigating your product deeper, you realize that:
Now you can formulate some interesting hypotheses to drive retention. Maybe we should:
As you can see, a simple feature-based segmentation can narrow your focus and generate many interesting hypotheses to further test with data and experiments.
Let’s look at another example. Say you’re a product manager for a Patreon-like platform, allowing creators to create and monetize their content on your platform.
You need to build the supply side, so we investigate what makes successful, long-term creators different from short-lived ones:
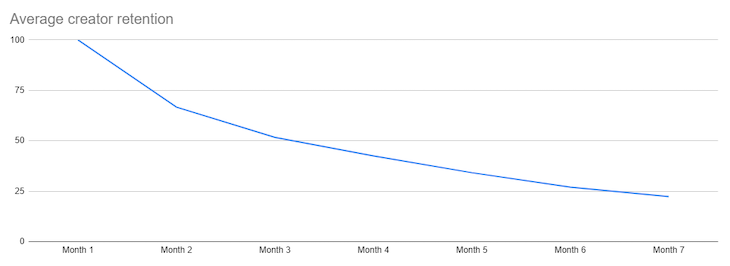
As you already know, you can’t do much with the average retention curve, so you must consider the best way to segment these users.
Since the biggest value proposition you offer is the ability to monetize content, it makes sense to segment users based on their earnings. Look at the first 14-day period.
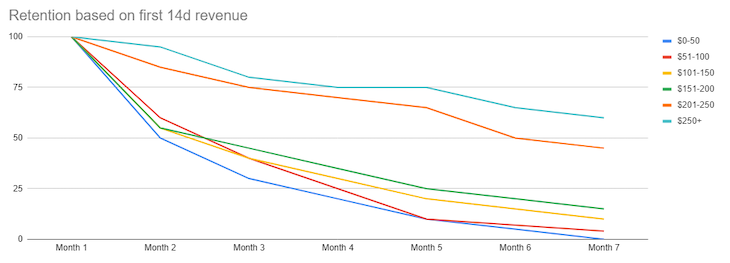
Now that’s a powerful insight. There’s a big gap between segments that earned less than $200 in revenue in the first two weeks and people who crossed that mark.
That’s a strong signal that $200 revenue in 14 days is a potential retention moment.
Now you think about the following action steps:
But what if most of your creators are small creators that aren’t here for money? Maybe you should talk with them to understand what’s lacking in the platform and to improve the retention of sub-$200 segments rather than pushing them above the $200 threshold.
Again, the analysis itself won’t tell you your next steps, but it already generates various ideas, research questions, and next steps that’ll help you work on our retention problem.
Aggregate numbers are too obscure. While they can help you understand what’s happening, they don’t help you understand why something is happening. Behavioral segments, on the other hand, show how specific in-product behaviors impact other key metrics.
Every quantitative analysis should start with proper segmentation to give a clear picture of potential action points and hypotheses.
Featured image source: IconScout

LogRocket identifies friction points in the user experience so you can make informed decisions about product and design changes that must happen to hit your goals.
With LogRocket, you can understand the scope of the issues affecting your product and prioritize the changes that need to be made. LogRocket simplifies workflows by allowing Engineering, Product, UX, and Design teams to work from the same data as you, eliminating any confusion about what needs to be done.
Get your teams on the same page — try LogRocket today.

Maryam Ashoori, VP of Product and Engineering at IBM’s Watsonx platform, talks about the messy reality of enterprise AI deployment.

A product manager’s guide to deciding when automation is enough, when AI adds value, and how to make the tradeoffs intentionally.

How AI reshaped product management in 2025 and what PMs must rethink in 2026 to stay effective in a rapidly changing product landscape.

Deepika Manglani, VP of Product at the LA Times, talks about how she’s bringing the 140-year-old institution into the future.