This article provides a working knowledge of the principles of chaos engineering, discusses its use in software development, and explores how its use may be extended to blockchain development.

The tutorial portion of this article demonstrates how to use the ChaosETH framework to leverage chaos engineering for the testing of Ethereum clients. This strategy can be helpful for identifying flaws (sometimes referred to as “dark debts”) in smart contracts before the contract is widely adopted by members of the network.
The Replay is a weekly newsletter for dev and engineering leaders.
Delivered once a week, it's your curated guide to the most important conversations around frontend dev, emerging AI tools, and the state of modern software.
Chaos engineering is the practice of performing experiments on a distributed system in order to make it resilient and more fault tolerant to turbulent conditions that may occur in a production environment. The concept is easily traced back to Netflix, where a team led by Casey Rosenthal was placed in charge of testing software availability and system resilience.
Chaos engineering has five advanced principles to guide chaos engineers. Follow these principles to ensure you are practicing chaos engineering properly:
As you can see, these principles are very different from traditional testing techniques.
Blockchain technology is a subset of distributed ledger technology and is used to build distributed decentralized applications. This distributed status is achieved by creating a peer-to-peer network of nodes, which are actually computers. As a system becomes more widely adopted and connected to more computers, its complexity increases.
Cardano Quick News on Twitter: “If your email service has a bug, people will just complain, nothing serious.But if a blockchain has a bug, people may lose money.Now that’s serious.Safety and stability are THE most important things to a blockchain.And they are at the heart of Cardano.#Cardano $ada #ada / Twitter”
If your email service has a bug, people will just complain, nothing serious.But if a blockchain has a bug, people may lose money.Now that’s serious.Safety and stability are THE most important things to a blockchain.And they are at the heart of Cardano.#Cardano $ada #ada
Faults and weaknesses can occur on a blockchain via the clients as a result of overloaded operating systems, errors from memory management, or network partitions. Deploying an Ethereum client is only possible on an operating system that provides it with important resources.
Given that chaos engineering is well suited to distributed systems, it can be useful in ensuring the resilience of each participating client on a blockchain, such as the Ethereum network.
Here are some points to keep in mind when designing experiments to inject chaos engineering principles on a blockchain:
This article specifically covers incorporating chaos engineering into Ethereum client applications. However, it’s important to note that the concept of injecting chaos in Web3 applies to all decentralized applications of all blockchains.
Ethereum has become the operational backbone of major decentralized platforms and has:
Proper planning for chaos testing on a live Ethereum client should include the following:
In this tutorial, we’ll demonstrate how to use ChaosETH, a new framework that measures how resilient an Ethereum client is in production, to execute chaos engineering experiments on a Go-Ethereum (Geth) client.
ChaosETH was created by Long Zhang and colleagues at KTH Royal Institute of Technology in Sweden. ChaosETH was designed to assess the resilience of Ethereum clients and thereby make the Ethereum blockchain more reliable. By way of operation, ChaosETH:
Let’s get started!
Select a cloud service provider where you will host a virtual machine, or install and configure Docker. Create a virtual machine instance running Ubuntu as OS and open port number 30303. This is the default port that the Ethereum client listens to.
Next, grab the latest stable version of the Ethereum client. Let’s go with the Geth client.
Build the client by following the documentation’s provided installation steps. Chaos engineering requires some observability features, hence you’ll need to add options to activate monitoring features in Geth’s documentation support for metrics.
There are many ways to install the Geth client, depending on your operating system or tooling. In this article, we’ll use Docker, and we’ll run the command on a shell:
docker pull ethereum/client-go
# and running it with:\\
docker run -it -p 30303:30303 ethereum/client-go
We’ll use InfluxDB alongside the Geth client to enable monitoring functionalities. Use the following command:
docker run -p 8086:8086 -d --name influxdb -v influxdb:/var/lib/influxdb influxdb:1:8
Now, configure the InfluxDB container by executing the following commands:
docker exec -it influxdb bash
Run this command inside the container:
influx
Next, execute these commands in the InfluxDB shell:
CREATE DATABASE chaoseth
CREATE RETENTION POLICY "rp_chaoseth" ON "chaoseth" DURATION 999d REPLICATION 1 DEFAULT
CREATE USER geth WITH PASSWORD xxx WITH ALL PRIVILEGES
Now the container is ready. You can proceed to run the Geth client along with the observability metrics and other options. Geth provides more than 500 different metrics from which we can choose.
The client must be run by a root user, even when it is being restarted after previous experiments. Therefore, sudo is necessary for the syscall monitoring and error injector.
The data directory must be specified as an option in the command, given the extra disc space of the instance. If this is not done, it will get persisted into the OS drive of the instance instead.
Consistent configurations are required from a client’s peers, so we’ll specify a target number of peers; we’ll use 50 since that is the default maximum number of peers for the Geth client.
The observability metrics are included for the application level monitoring.
Finally, you can make the Geth client run in the background to free up the terminal, and you can redirect the output to anywhere you like.
The resulting command will look like this:
sudo nohup ./geth --datadir=/data/eth-data \\
  --maxpeers 50 \\
  --metrics --metrics.expensive \\
  --metrics.influxdb --metrics.influxdb.database DB_NAME --metrics.influxdb.username geth --metrics.influxdb.password DB_PASS \\
  >> geth.log 2>&1 &
The entire synchronization process takes around three days and the status can be monitored on https://ethernodes.org/.
There is a client_monitor.py script that, when deployed, observes the steady-state behavioral metrics of the client after the sync is completed. The following command will attach the client monitor to the process and also feed the metric data as an endpoint in Prometheus in port 8000:
nohup sudo ./client_monitor.py -p CLIENT_PID -m -i 15 --data-dir=CLIENT_DATA_DIR >/dev/null 2>&1 &
To scrape the metrics data from Prometheus, include the following script in your config file:
scrape_configs:
  - job_name: 'client_monitoring'
    static_configs:
      - targets: ['172.17.0.1:8000']
Alternatively, you can visualize the data by creating a Grafana dashboard, like so: ./visualization/Grafana - Syscall Monitoring.json file.
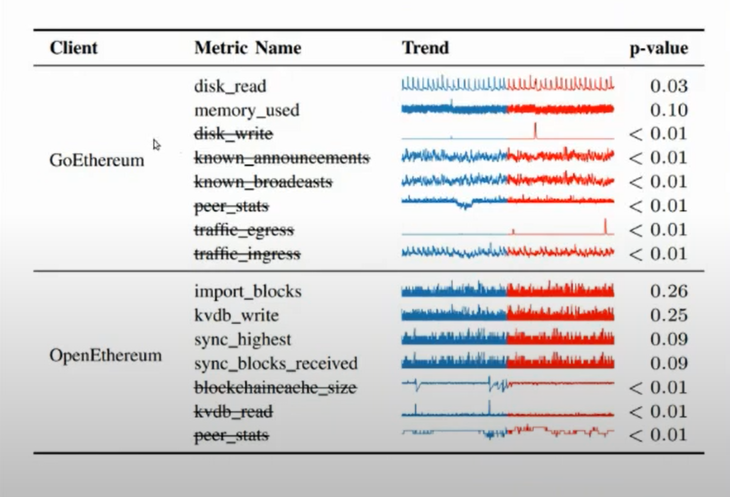
The steady-state analysis in the original experiment shows the metrics of data captured during two different monitoring sessions.

Chaos engineering and blockchain technology are both relatively new, but their importance has been proven and validated by wide adoption.
In this article, we provided an overview of chaos engineering principles, introduced the ChaosEth framework, and showed how to leverage the ChaosETH framework for resilience testing of a GETH client.
Implementing chaos engineering on Ethereum clients is critical for identifying potential faults that may occur during the lifecycle of a DApp or smart contract.
Client-side issues that impact users’ ability to activate and transact in your apps can drastically affect your bottom line. If you’re interested in monitoring UX issues, automatically surfacing JavaScript errors, and tracking slow network requests and component load time, try LogRocket.

LogRocket lets you replay user sessions, eliminating guesswork around why bugs happen by showing exactly what users experienced. It captures console logs, errors, network requests, and pixel-perfect DOM recordings — compatible with all frameworks.
LogRocket's Galileo AI watches sessions for you, instantly identifying and explaining user struggles with automated monitoring of your entire product experience.
Modernize how you debug web and mobile apps — start monitoring for free.

Learn how sibling-index() enables clean, JavaScript-free stagger animations using native CSS.

useEffect breaks AI streaming responses in ReactSee why useEffect breaks AI streaming in React, and how moving stream state outside React fixes flicker and stale updates.

A real-world debugging session using Claude to solve a tricky Next.js UI bug, exploring how AI helps, where it struggles, and what actually fixed the issue.

CSS wasn’t built for dynamic UIs. Pretext flips the model by measuring text before rendering, enabling accurate layouts, faster performance, and better control in React apps.
Hey there, want to help make our blog better?
Join LogRocket’s Content Advisory Board. You’ll help inform the type of content we create and get access to exclusive meetups, social accreditation, and swag.
Sign up now