Today we’re excited to announce official support for GraphQL in LogRocket!
Now, when facing bugs or user-reported issues, you can see all the GraphQL requests your app made to quickly understand what went wrong.

LogRocket is a frontend logging tool that lets you replay problems as if they happened in your own browser. Instead of guessing why errors happen, or asking users for screenshots and log dumps, LogRocket lets you replay the session to quickly understand what went wrong.
LogRocket works in any app regardless of framework. It instruments the DOM to record the HTML and CSS on the page, recreating pixel-perfect videos of even the most complex single page apps.
In addition, LogRocket records console logs, JavaScript errors, stacktraces, network requests/responses with headers + bodies, browser metadata, and custom logs. It also has deep integrations with React, Redux, and Angular to log actions and application state.
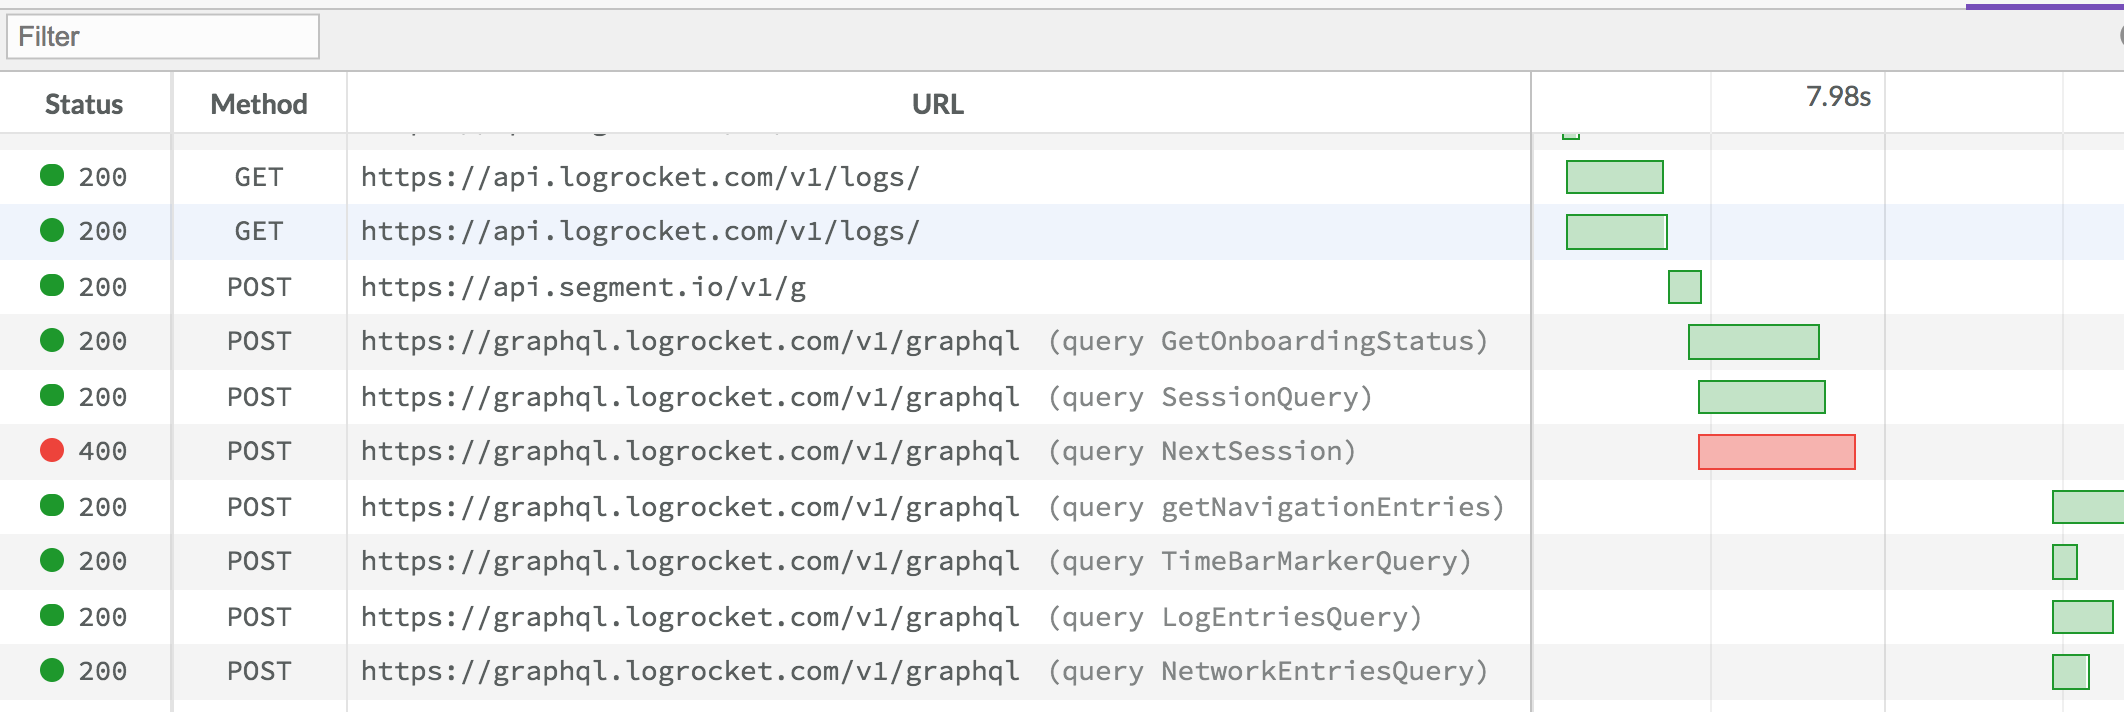
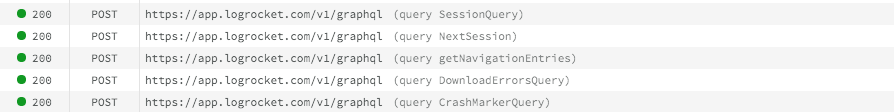
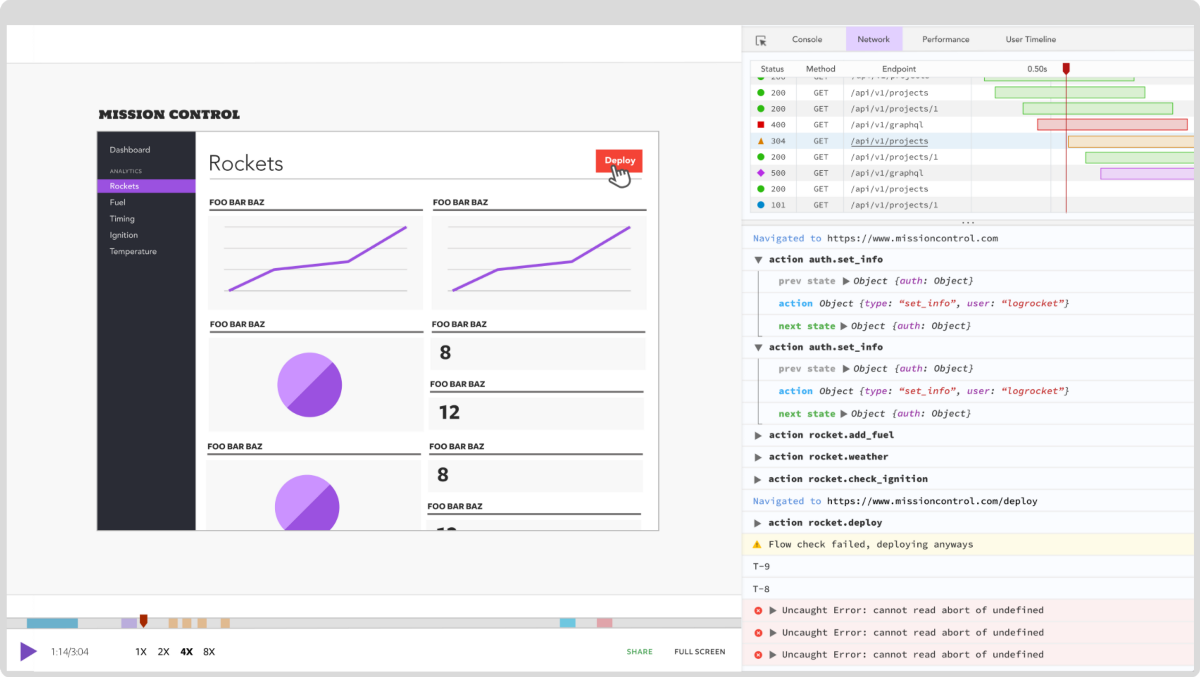
LogRocket captures both network requests and responses with headers and full bodies. The waterfall chart shows timings, making it easy to see which requests were slow, or if a potential race condition occurred. For GraphQL requests, LogRocket parses the query name so you can quickly see which requests correspond with particular queries. You can also search for queries both within a session, and across all sessions.
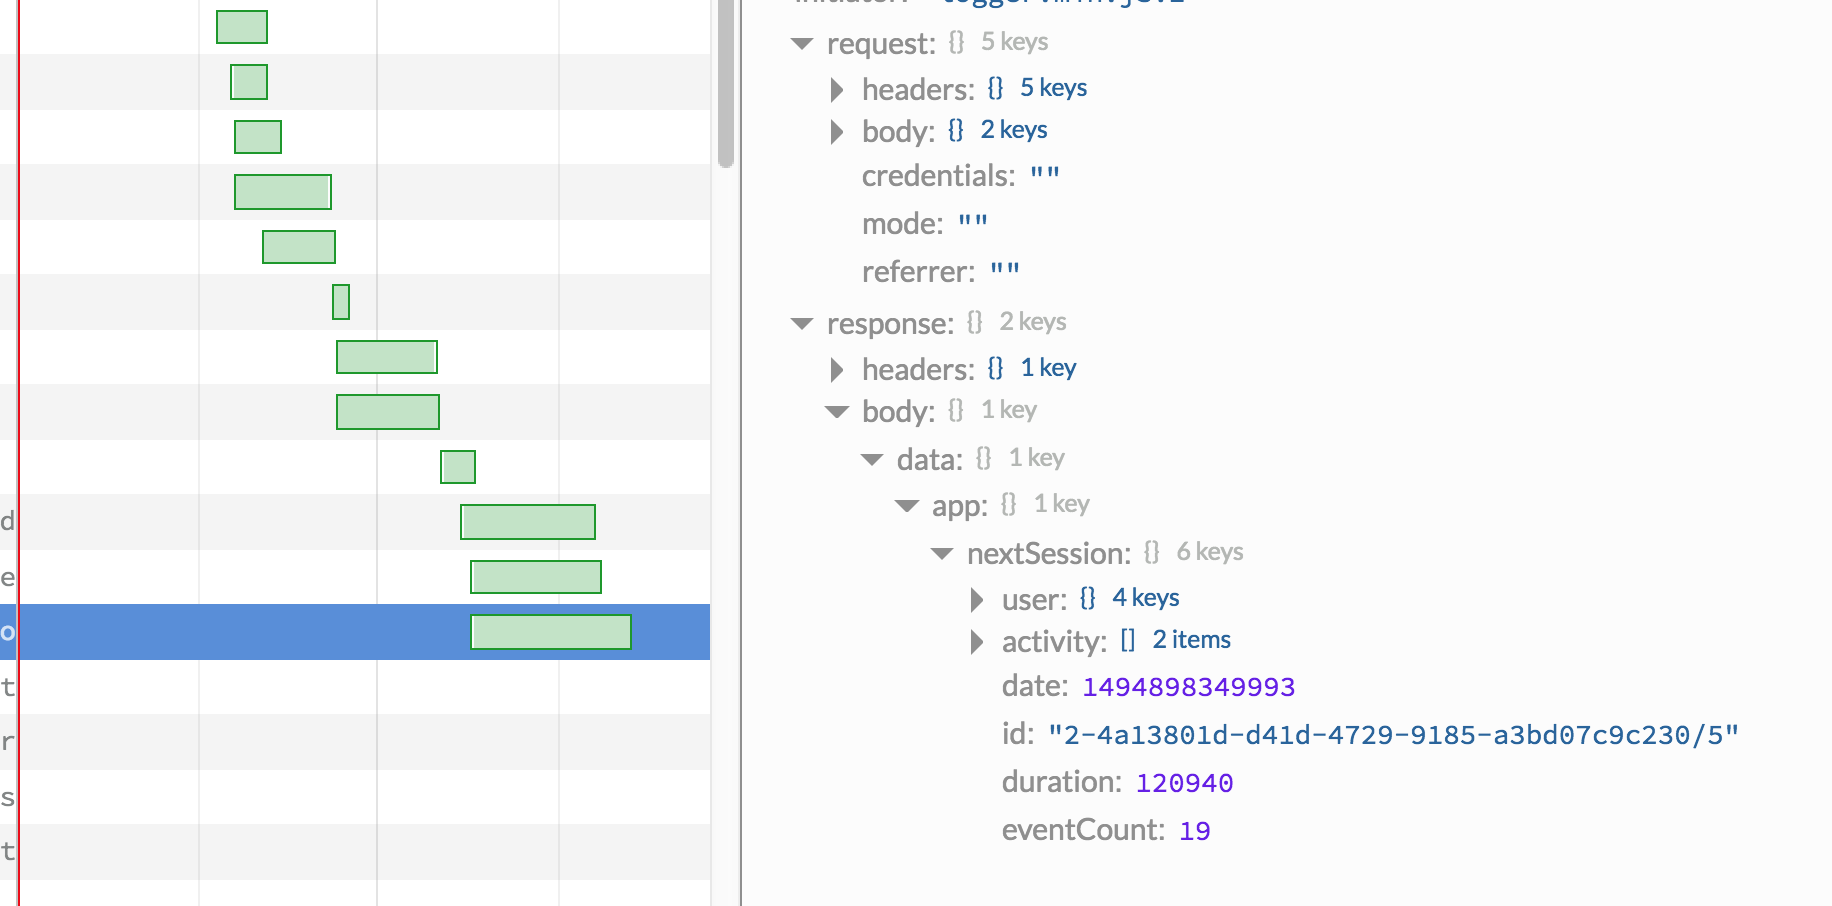
For each request, you can dig in and view the parsed request and response body. There’s also a button which generates a link to GraphQL with the query and variables pre-filled, so you can re-run the same query on your server and see the new results.
Since network requests sometimes contain secure tokens or sensitive user data, LogRocket makes it easy to redact any information from the logs, while still leaving important context to help with debugging.
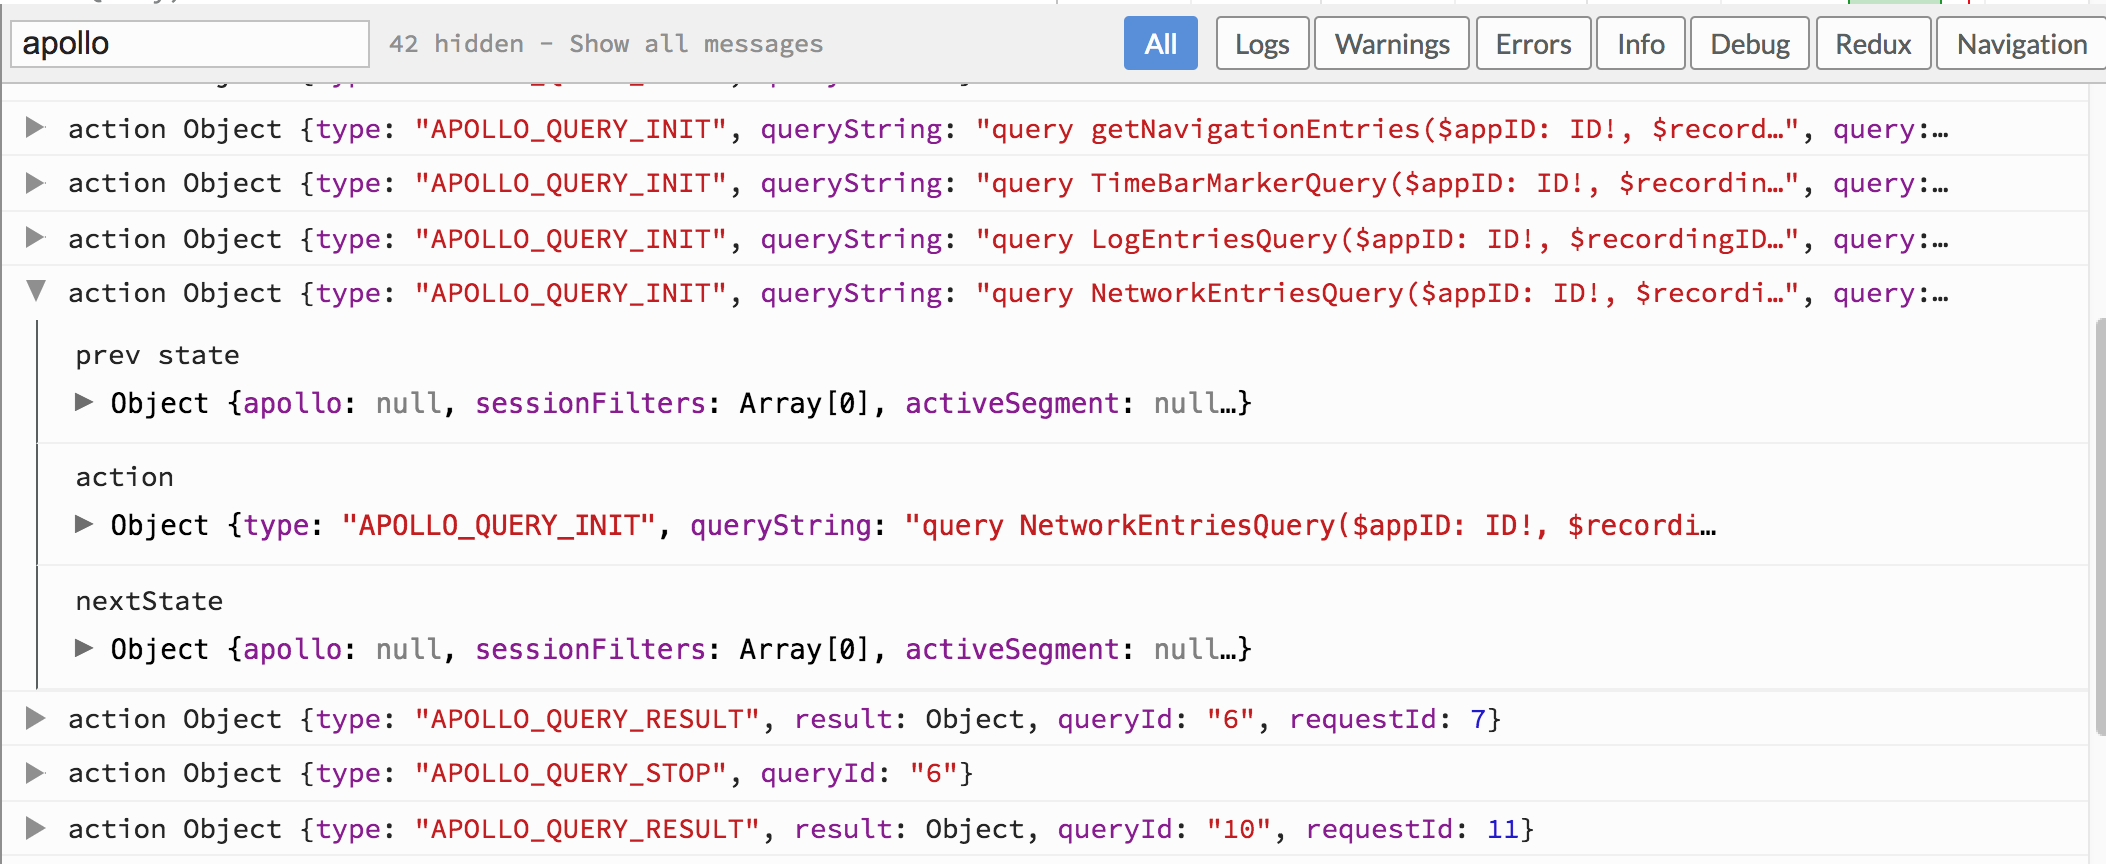
LogRocket logs Redux actions and state, so if you’re using apollo-client (which uses Redux internally), you’ll see request lifecycle logs in the LogRocket log viewer. This lets you quickly find query errors and dig in to understand the root cause.
GraphQL logs often hold the key to solving errors and user-reported issues.
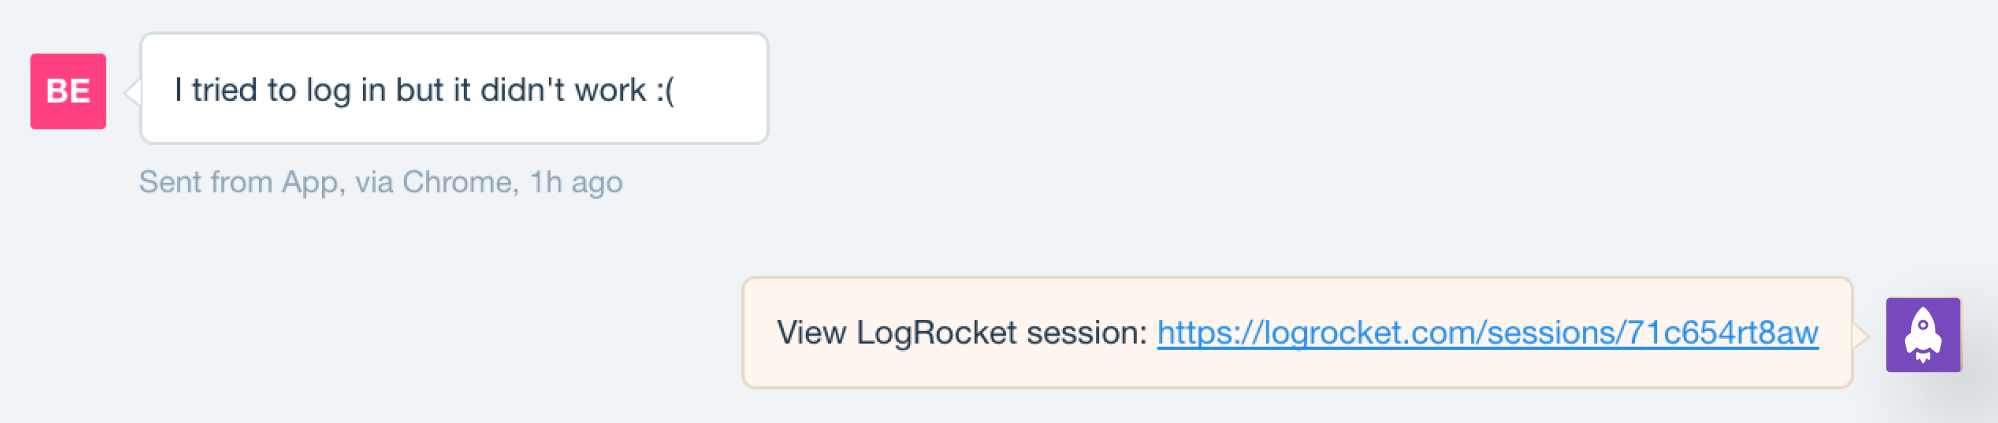
LogRocket integrates with Intercom and other support tools so when a user writes-in needing help, you can watch exactly what they’re seeing and guide them to a solution.
Sometimes, it’s unclear if a user is just confused, or actually experiencing a bug. By looking at the console and network/GraphQL logs from their session, you can easily make this distinction.
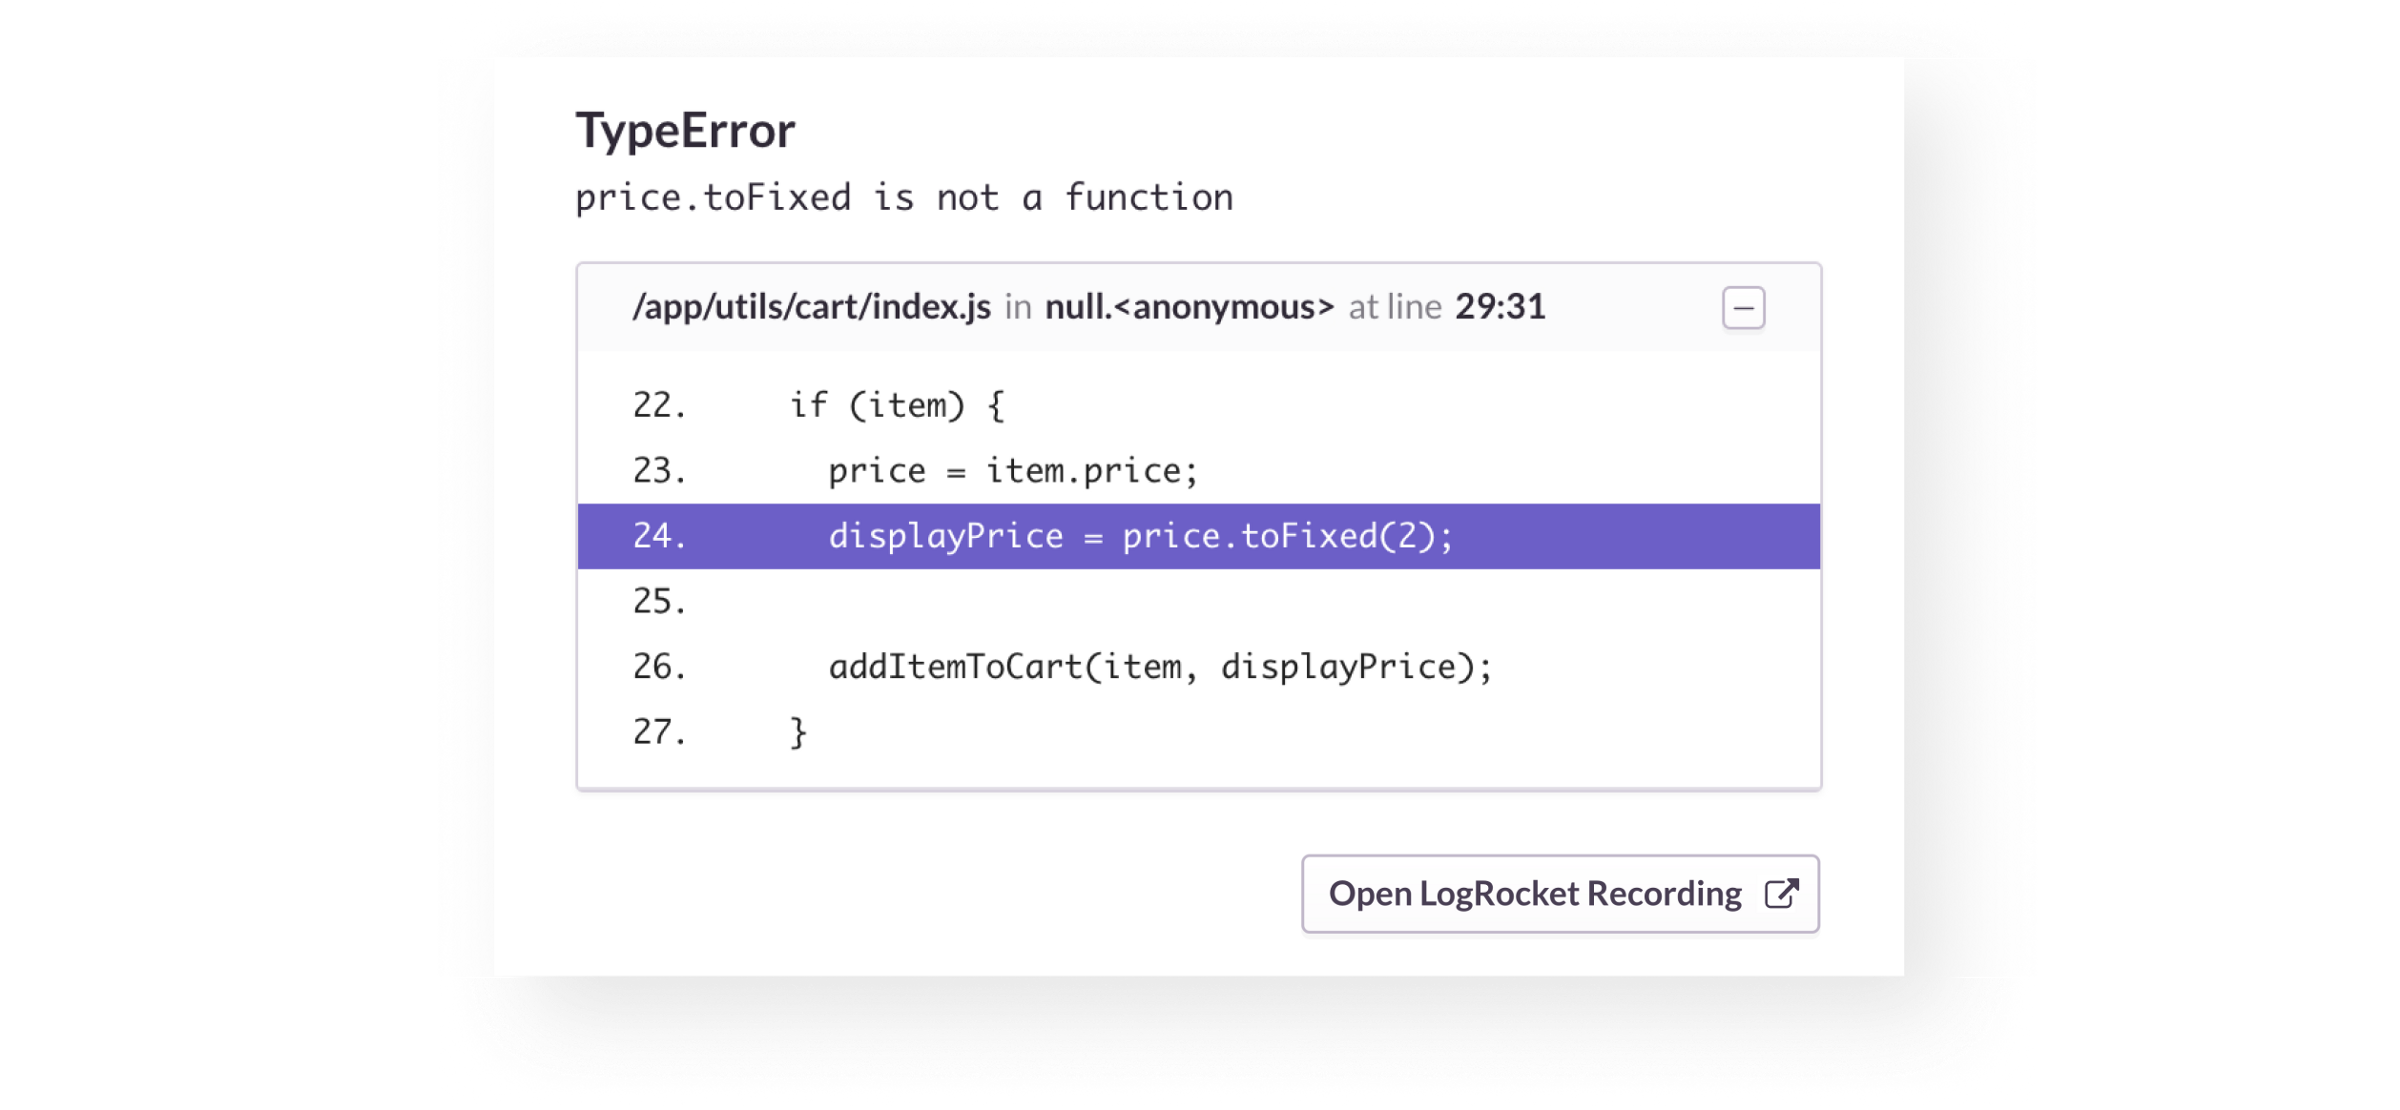
LogRocket integrates with error reporting tools like Sentry and Bugsnag to let you see GraphQL logs and video for every error. Not only does this help quickly understand bugs, but also lets you see the impact the error had on the user’s experience.
To get started with LogRocket, create a free account at https://logrocket.com
While GraphQL has some features for debugging requests and responses, making sure GraphQL reliably serves resources to your production app is where things get tougher. If you’re interested in ensuring network requests to the backend or third party services are successful, try LogRocket.
LogRocket lets you replay user sessions, eliminating guesswork around why bugs happen by showing exactly what users experienced. It captures console logs, errors, network requests, and pixel-perfect DOM recordings — compatible with all frameworks.
LogRocket's Galileo AI watches sessions for you, instantly aggregating and reporting on problematic GraphQL requests to quickly understand the root cause. In addition, you can track Apollo client state and inspect GraphQL queries' key-value pairs.
Would you be interested in joining LogRocket's developer community?
Join LogRocket’s Content Advisory Board. You’ll help inform the type of content we create and get access to exclusive meetups, social accreditation, and swag.
Sign up now
Learn how OpenAPI can automate API client generation to save time, reduce bugs, and streamline how your frontend app talks to backend APIs.

Discover how the Interface Segregation Principle (ISP) keeps your code lean, modular, and maintainable using real-world analogies and practical examples.
<selectedcontent> element improves dropdowns
Learn how to implement an advanced caching layer in a Node.js app using Valkey, a high-performance, Redis-compatible in-memory datastore.