Most modern, web-based software has to be efficient and handle a massive user base. Testing strategies can help web developers improve the quality and performance of these web modules.

Load testing, a performance test strategy, lets us measure application speed and monitor application behavior with a virtually created user load.
In this tutorial, I’ll discuss features of the Artillery test runner and guide you to write load test suites for your Node.js applications. I’ll also explain how to improve application performance using test reports and discuss advanced Artillery configurations. The code for this entire post can be found on my GitHub.
Jump ahead:
Artillery is a free, open-source, fully-featured, cloud-based load testing platform written in JavaScript. It works as a traditional, minimal CLI program and only requires a newer Node.js runtime as an installation dependency.
As Node.js is a popular app runtime for building modern web services, load testing is a crucial test that every Node developer should implement in their test suites. The Artillery test runner lets developers implement load test suites using YAML files and run tests with a CLI subcommand.
Artillery comes with the following highlighted features to compete with other popular competitive load testing platforms:
Artillery requires the Node.js runtime to work and its modules are released into the npm registry, so Artillery seems like a Node-specific load testing platform at first, but it is both a language- and tech stack-agnostic load test runner.
In other words, Artillery can run load tests for web services written using any programming language, such as any web service built using Go, Python, Zig, C++, etc.
Artillery supports both HTTP and WebSocket protocols. It also offers ways to write tests for Socket.IO-based servers and to run Microsoft Playwright tests.
We can run load tests on our local development machines, but it’s not practical to ask every team member to do a complete load test locally before submitting a new Git commit. As a solution, most software development teams automatically run their load test suites for pull requests with cloud CI (Continuous Integration) servers. They also automate their release flow by generating release artifacts on cloud CD (Continuous Delivery) servers.
Artillery offers pre-developed, Dockerized CI/CD server steps to run Artillery load test suites on the cloud for:
Nowadays, every cloud-native software module opts for a distributed design, i.e., most web developers choose microservices over monoliths. Testing also evolved along similar lines — now, there is a mechanism called distributed testing that speeds up test runs by running parallel test suites on remote workers.
Artillery CLI offers sub-commands to run distributed tests on AWS Lambda and AWS Fargate without using advanced DevOps skills and manually managing infrastructure.
Artillery internally uses an extendable and customizable project structure to motivate developers to extend and customize it. You can do so with the following methods:
The pre-developed plugins Artillery offers mainly focus on common use cases, like functional testing and metric assertion, and lets you use the same primary YAML file to work with plugin features.
Now that we’ve covered Artillery, let’s use it practically for load testing with a sample Node.js web service. We’ll write a load test suite for a RESTful Node.js API that uses a MySQL database instance.
The sample web service that we are about to develop requires Docker, so make sure that your development machine has a newer Docker version with Docker Compose.
Let’s create a sample web service to test with Artillery. In this tutorial, we’ll use a simple Node.js RESTful API that has three endpoints:
GET /locations: Returns a fixed list of locations where customers typically liveGET /customers: Returns a list of existing customersPOST /customers: Adds a new customer to the database by assigning them a random location identifierTo keep this tutorial’s focus on load testing, I added the source code of this sample project to GitHub with a Docker Compose file, so you can start the sample web service instantly.
First, clone the demo project’s GitHub repository into your computer:
git clone https://github.com/codezri/node-rest-api-demo.git
cd node-rest-api-demo
Open the project from your favorite code editor and familiarize yourself with the codebase. It implements three endpoints within one JavaScript file by directly calling MySQL queries without using ORM models. I’ve done that for the simplicity of this tutorial, but make sure to use proper design patterns for production apps that consist of many endpoints.
This project already contains an Artillery script and CI/CD configurations. Delete those source files to have a fresh start with the tutorial using the following command:
rm -rf tests .github
Next, start Docker Compose services as follows:
docker-compose up -d
The above command initializes a MySQL database with some pre-defined locations, starts the RESTful API, and starts listening to requests from the local port 5000. You can make sure that the web service works by requesting available locations as follows:
curl http://localhost:5000/locations
# --- or ---
wget -qO- http://localhost:5000/locations
You can also test the customer endpoints by creating a new customer and retrieving the available customers list with Postman, as shown in the following preview:
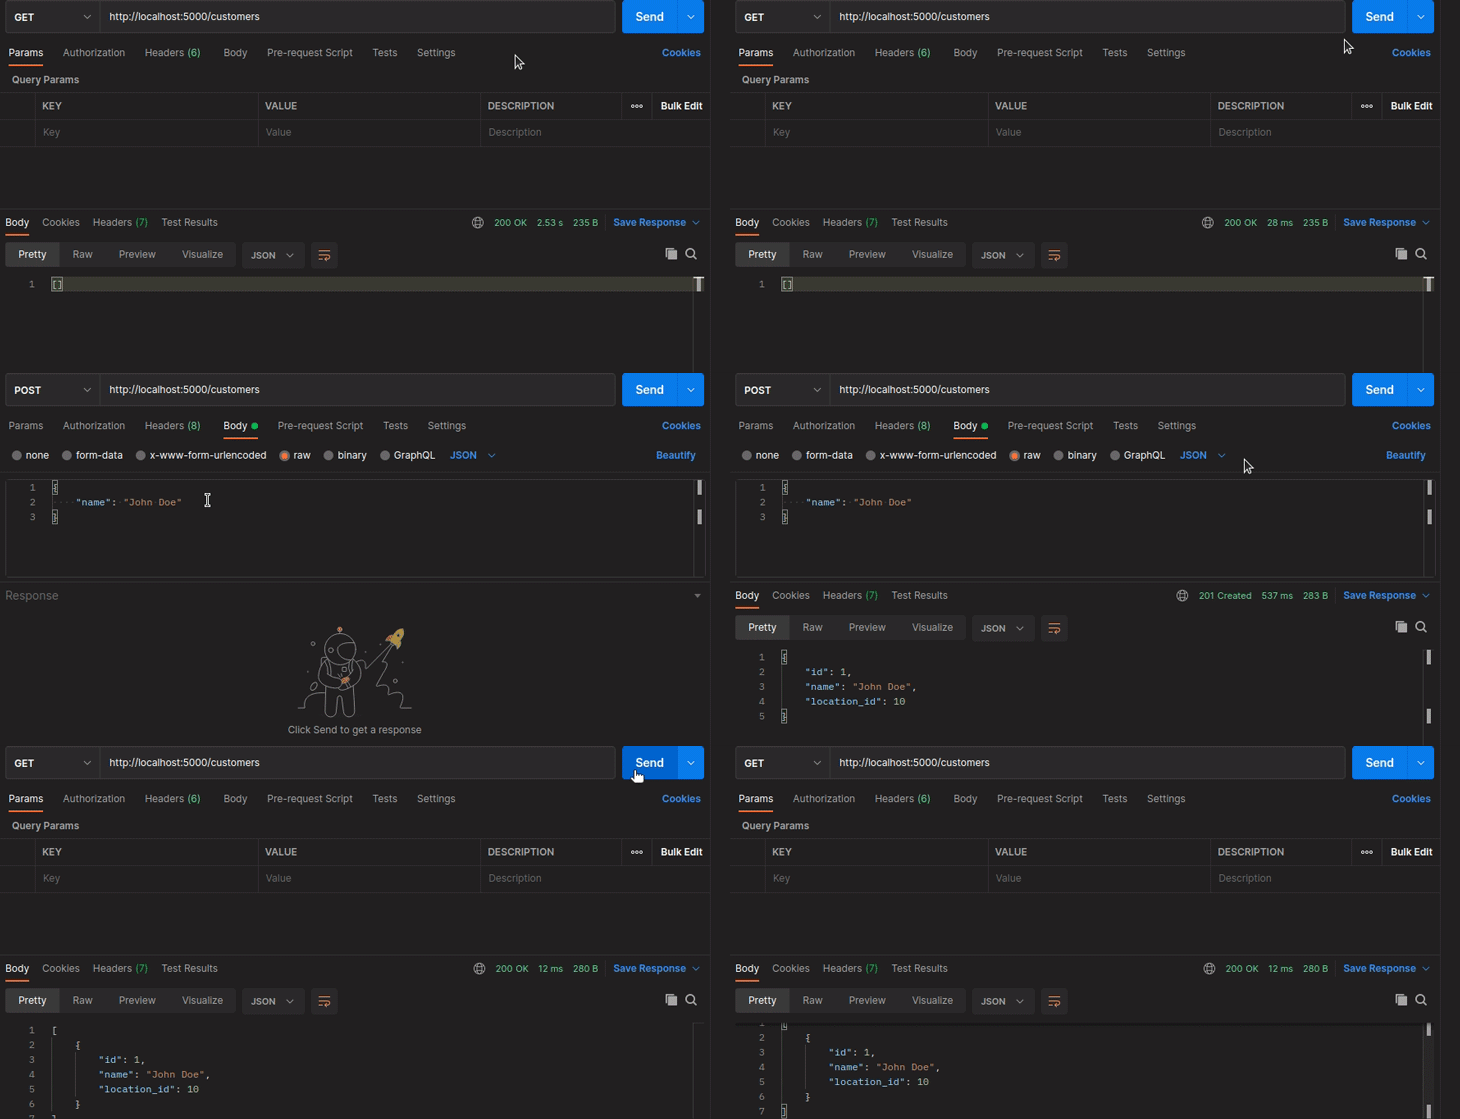
Now, our RESTful service is ready to be load tested. Let’s integrate Artillery and write a load test case. We can install the artillery npm package globally to add the artillery command to our developer environment:
npm install -g artillery@latest
# --- or ---
yarn global add artillery@latest
Confirm that the Artillery CLI works after the installation process by running the artillery command:
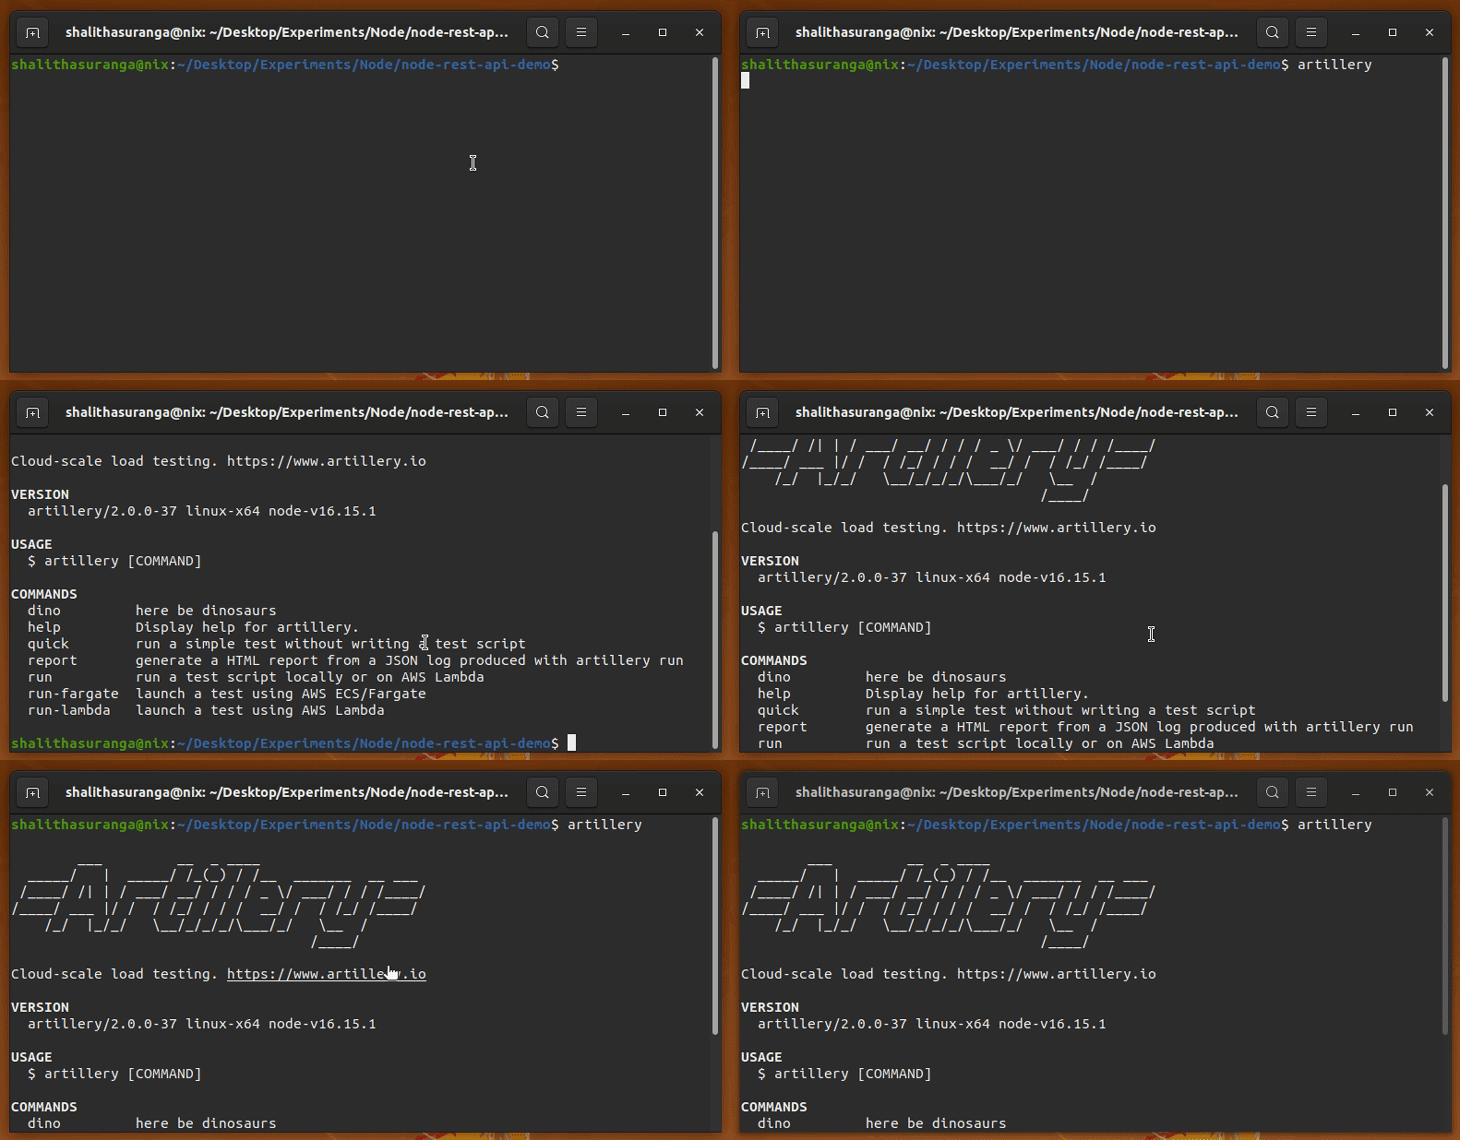
The Artillery CLI lets you run a quick load test with the quick subcommand without a test script, but load testing a production-grade app typically requires a well-defined test runner configuration in a test script file. Let’s write a test script to create our first test case.
Create a new directory for storing load testing-related files:
mkdir tests
Add the following YAML configuration to the tests/demo_api_load.yml file:
config:
  target: http://localhost:5000
  phases:
    - duration: 20
      arrivalRate: 5
      name: Startup phase
scenarios:
  - flow:
    - get:
        url: "/locations"
There are several important steps in this test you need to understand:
5 users for each second for 20 seconds to create a total of 100 virtual usersscenarios. In this script, we have one flow action so that every virtual user will make one HTTP request for the GET /locations endpointGET/ locations endpointNow, you can run the test script using the following command:
artillery run tests/demo_api_load.yml
Once Artillery completes running all phases for all scenarios, you can see the final summary report on the terminal with request/response timing and virtual user details:
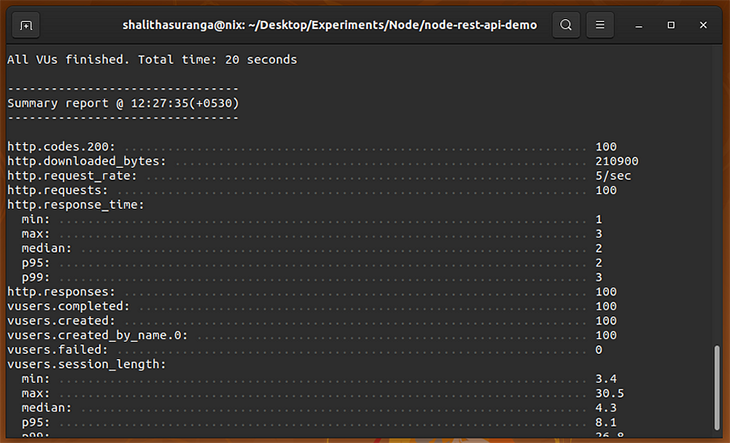
Since we’ll run this test many times in the upcoming tutorial sections, we can create a new npm script in our package.json, as shown in the following code snippet:
"scripts": {
  "start": "node server.js",
  "load-test": "artillery run tests/demo_api_load.yml"
},
Now, you can run the load test with the following command:
npm run load-test
# --- or ---
yarn load-test
The current test phase consists of a constant arrival rate of virtual users, but you can use the rampTo configuration option in a phase to increase the arrival rate dynamically with time:
phases:
    - duration: 20
      arrivalRate: 5
      rampTo: 40
      name: Startup phase
The above phase ramps up the arrival rate from 5 to 40 within 20 seconds.
We can inspect the final Artillery summary report to get an idea about the web service’s performance, but it’s a general practice to print the pass/fail status of a test suite. Returning the pass/fail status via the test runner’s process exit code is highly useful when we run tests in CI/CD servers.
We can return a pass/fail status by asserting metrics or data. Artillery offers inbuilt ensure and expect plugins for metrics and data assertion, respectively.
Update the YAML file as follows:
config:
  target: http://localhost:5000
  phases:
    - duration: 20
      arrivalRate: 5
      name: Startup phase
  plugins:
    ensure: {}

  ensure:
      thresholds:
        - http.response_time.max: 1000
      conditions:
        - expression: "http.codes.200 == http.requests"
scenarios:
  - flow:
    - get:
        url: "/locations"
The above test script implements two metric assertions:
200 HTTP response codesOnce you run the test script, you will see information about the above checks on the terminal:

Similarly, you can implement functional tests on API responses. Update the test script as follows:
config:
  target: http://localhost:5000
  phases:
    - duration: 20
      arrivalRate: 5
      name: Startup phase
  plugins:
    ensure: {}
    expect: {}

  ensure:
      thresholds:
        - http.response_time.max: 1000
      conditions:
        - expression: "http.codes.200 == http.requests"
scenarios:
  - flow:
    - get:
        url: "/locations"
        capture:
          - json: "$[:1].name"
            as: firstCity
        expect:
          - equals:
              - "{{ firstCity }}"
              - "Alaska"
Here, we checked whether the first city name is “Alaska” or not. Artillery will run functional tests with the load test case once you use the above test script:

In the previous sections, we wrote a load test script for a web service and extended it by adding metric checks and data assertions. We used one phase and one flow action to test only one endpoint to get started with Artillery.
However, we should test multiple endpoints with more than one test phase to mimic real-world load testing scenarios. Let’s turn our simple load test script into a complete test suite that is good enough to accomplish a proper load test for the sample web service.
Add the following content to your test script:
config:
  target: http://localhost:5000
  phases:
    - duration: 20
      arrivalRate: 5
      name: Startup phase
    - duration: 5
      arrivalRate: 20
      name: Peak phase
    - duration: 10
      arrivalRate: 2
      name: Slow-down phase
  plugins:
    ensure: {}
    expect: {}
  payload:
    path: customers.csv
    fields:
      - "name"
  ensure:
      thresholds:
        - http.response_time.max: 1000

scenarios:
  - flow:
    - get:
        url: "/locations"
        capture:
          - json: "$[:1].name"
            as: firstCity
        expect:
          - statusCode: 200
          - equals:
              - "{{ firstCity }}"
              - "Alaska"
    - post:
        url: "/customers"
        capture:
          - json: "$.name"
            as: savedName
        json:
          name: "{{ name }}"
        expect:
          - statusCode: 201
          - equals:
              - "{{ savedName }}"
              - "{{ name }}"
    - get:
        url: "/customers"
        expect:
          - statusCode: 200
          - hasProperty: "[0].id"
We’ve updated the previously created test script with the following improvements to load test all endpoints properly:
POST endpoint200 because the POST endpoint returns 201flow section by adding actions for the other two endpointsBefore running the test suite, add the following CSV content to the tests/customers.csv:
John Doe
Mike L
Ann Delma
Welma K
David Kat
Finally, run the load test suite using the load-test npm script, as shown in the following preview:
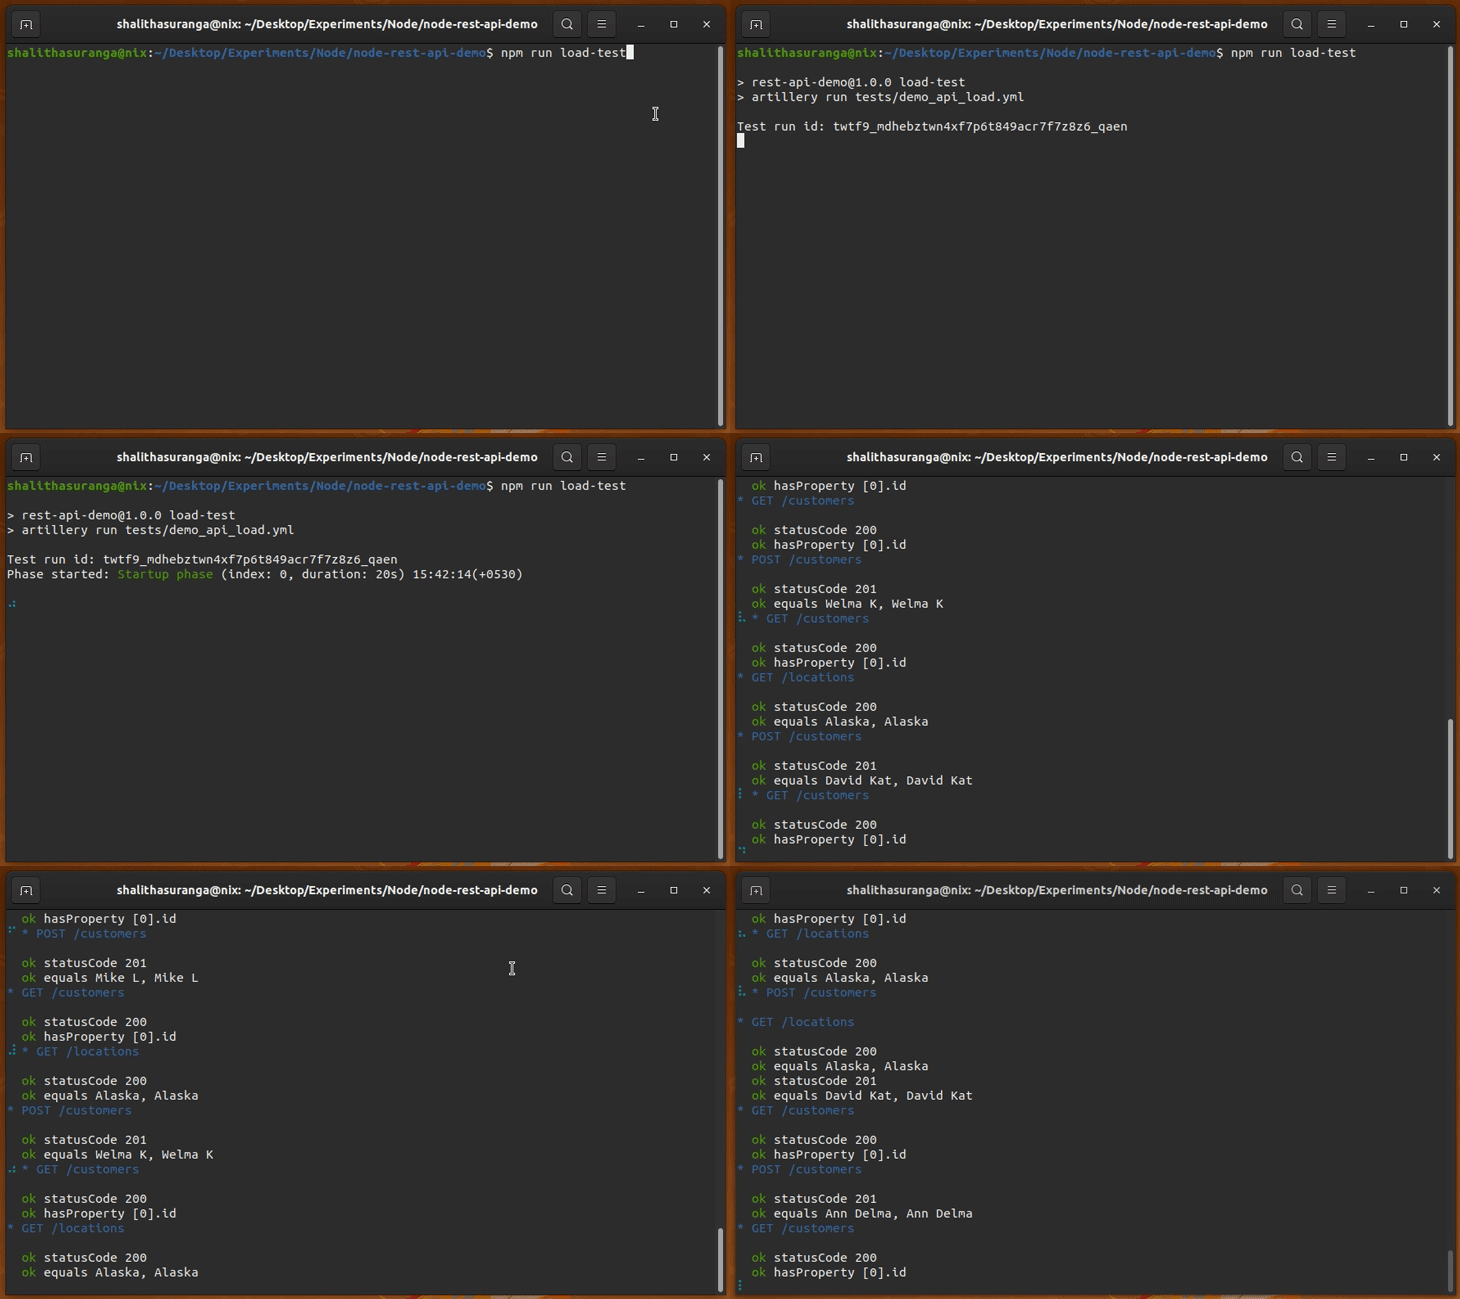
The terminal-based summary report is great for developers, but using a well-formatted document is undoubtedly great for business-related presentations and developer team discussions. Artillery offers the report subcommand to generate an HTML report based on output JSON reports.
To create an HTML report, first, you need to generate a JSON report as follows:
npm run load-test -- --output tests/report.json
# --- or ---
yarn load-test--output tests/report.json
Next, you can create an HTML report using the above JSON report:
artillery report tests/report.json --output tests/report.html
The above command generates a well-structured load test report in the tests/report.html file:
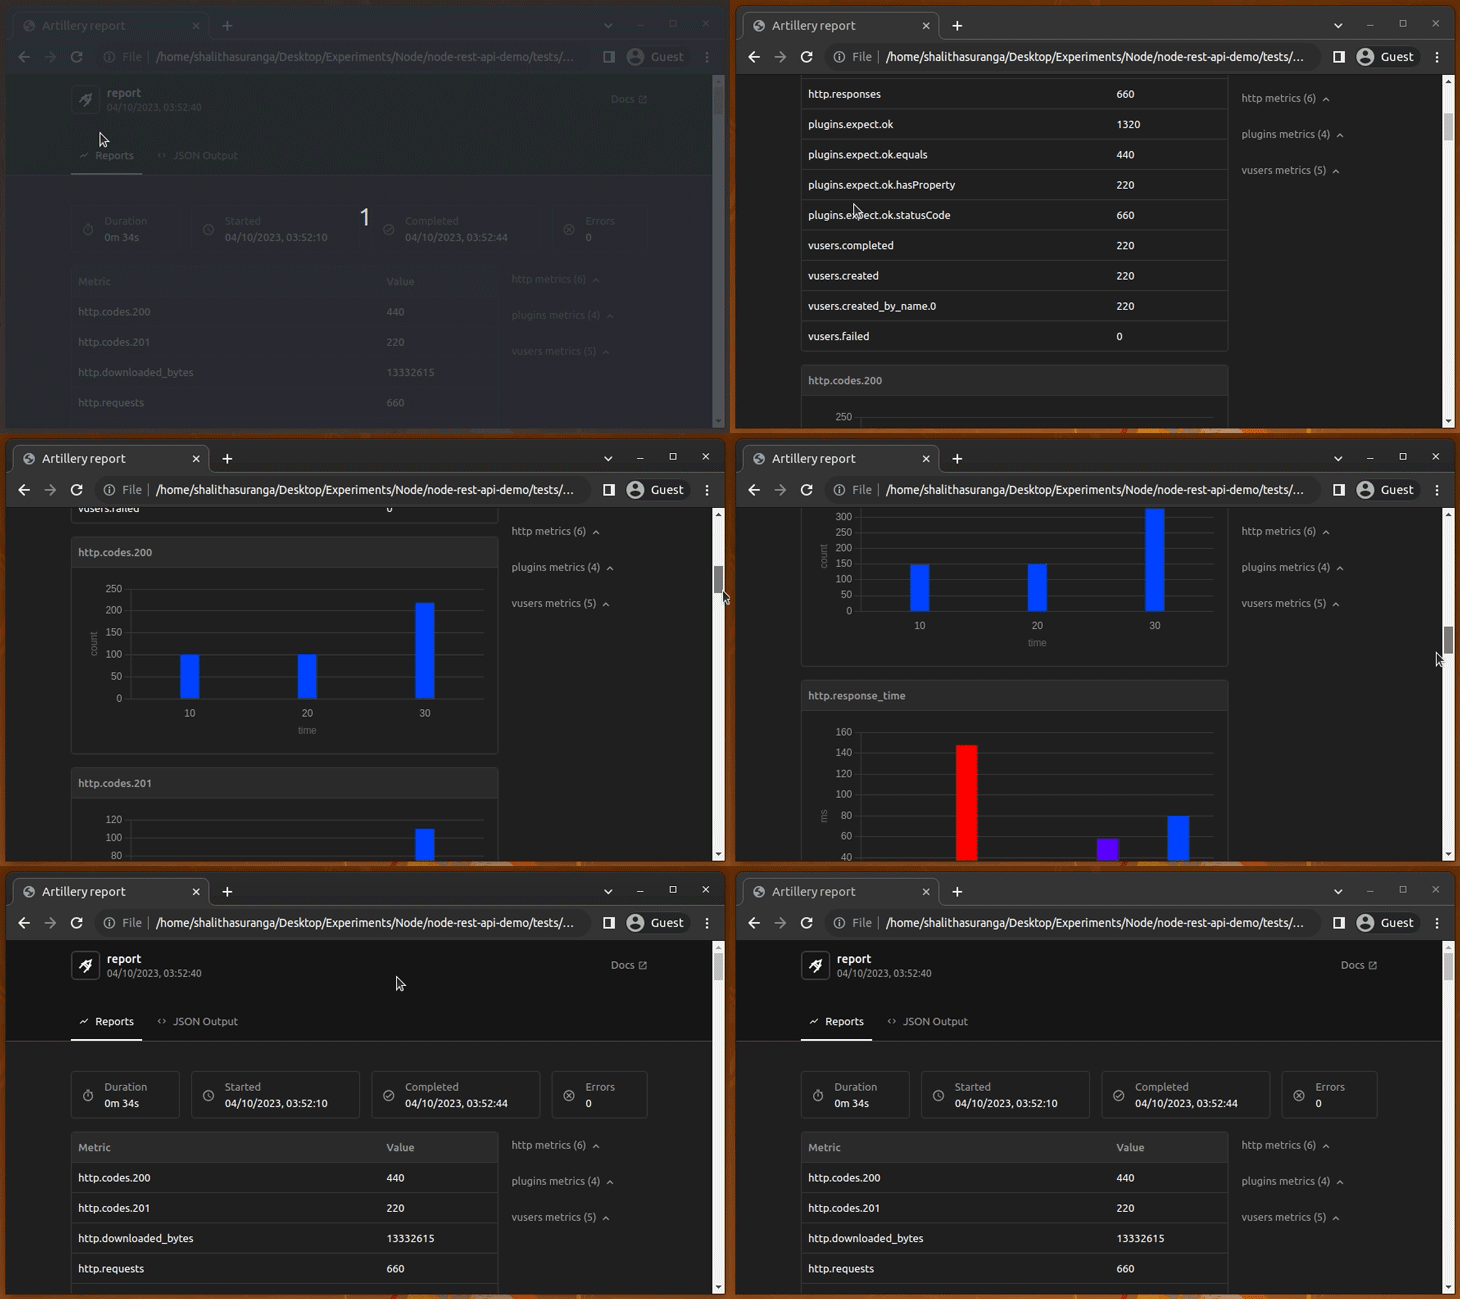
report commandIn our first demo, we locally executed the load test suite, but in real-world development scenarios, we’d probably run automated load test suites on CI/CD servers to save time. Artillery can run tests on popular cloud CI/CD platforms via a Dockerized instance or directly, via the Artillery npm package commands.
Let’s run this sample load test suite on GitHub Actions for each new Git commit and pull request that is added. Publish the sample app code into a new GitHub repository and create a new GitHub Actions workflow with the following workflow configuration:
name: Test suite

on:
  push:
    branches: [ "main" ]
  pull_request:
    branches: [ "main" ]

jobs:
  load-test:
    runs-on: ubuntu-latest

    steps:
    - uses: actions/checkout@v3

    - name: Start the webservice
      run: docker-compose up -d

    - name: Wait for API
      uses: iFaxity/[email protected]
      with:
        resource: http://localhost:5000/locations

    - name: Execute load tests
      run: npx artillery run tests/demo_api_load.yml
Here, I wrote action steps to start the web service, pause the workflow till the web service is ready, and execute the Artillery test suite. I ran Artillery tests with npx on the same GitHub Actions job runner — you can also use the official Artillery Action to run tests on an isolated Docker container.
Once you add this workflow, GitHub Actions will automatically run load tests whenever there is a new commit or pull request, as shown in the following screenshot:

You can browse the complete GitHub Actions-enabled codebase on this GitHub repository.
As a fully-featured load test runner, Artillery can send metrics to popular cloud monitoring platforms like AWS CloudWatch via the publish-metrics plugin. Here is a sample YAML configuration that integrates AWS CloudWatch with Artillery:
config:
  plugins:
    publish-metrics:
      - type: cloudwatch
        region: us-east-1
        namespace: continous-testing
        dimensions:
          - name: Team
            value: SQA
          - name: Service
            value: checkout-svc
You can browse the official plugin documentation to learn about sending metrics to all supported monitoring tools.
For demonstration purposes, I used a sample public API that doesn’t contain any authentication strategy. However, almost all production RESTful APIs are protected with a popular authentication/authorization strategy (i.e., username and password + JWT).
The following sample test script shows you how to log in, send an authenticated request, and log out using before, scenarios, and after flows:
config:
  target: "http://localhost:5000/private-api"
  phases:
    - duration: 10
      arrivalRate: 25

before:
  flow:
    - log: "Get auth token"
    - post:
        url: "/auth"
        json:
          username: "myUsername"
          password: "myPassword"
        capture:
          - json: $.id_token
            as: token
scenarios:
  - flow:
      - get:
          url: "/data"
          headers:
            authorization: "Bearer {{ token }}"
after:
  flow:
    - log: "Invalidate token"
    - post:
        url: "/logout"
        json:
          token: "{{ token }}"
You can undoubtedly load test your login backend URL by storing some test credentials on a CSV file and loading it to Artillery, as we created many customers previously with the tests/customers.csv file.
We can use load test reports to analyze and identify our web service’s performance issues. Let’s discuss some example scenarios where we can use Artillery reports to improve Node.js app performance.
First, enable endpoint-wise results in summary reports by activating the metrics-by-endpoint plugin in the test script:
plugins:
  ensure: {}
  expect: {}
  metrics-by-endpoint: {}
Now, we can see metrics per each unique endpoint, so it’s possible to analyze the performance of individual endpoints productively.
Caching helps us speed up data access times in computing modules. Most development teams use Redis-like, distributed in-memory caching for web services. I’ll demonstrate the performance gain of caching by implementing in-memory, application-level caching with a JavaScript global variable.
Check the response times of the GET /locations endpoint for peak virtual user loads:

You might be wondering, why do response times show a large gap for receiving a simple fixed data set? Can we cache the location results since the locations table never gets updated in the sample app?
Let’s cache the fixed locations array in memory with a global JavaScript variable and avoid unwanted database calls as follows:
let locations = null;

app.get('/locations', async(req, res) => {
    if(locations) {
        return res.json(locations);
    }
    try {
        [locations] = await sql.query('SELECT * FROM location');
        return res.json(locations);
    }
    catch(error) {
        return res.status(500).json({
            message: 'Internal server error',
        });
    }
});
Once you rerun load tests for the above version of the code, you should see a significant improvement in high response times:

Learn more about production-grade Node.js caching solutions in this article.
Database design and configuration also affect your app performance. In relational database systems, slow queries and non-indexed columns often cause critical performance issues.
Artillery’s endpoint-wise metrics can help you find slow areas of your app caused by database-related issues. To demonstrate this, we can use the following code to simulate a slow database query:
app.get('/locations', async(req, res) => {
    try {
        await sql.query('SELECT SLEEP(1)'); // simulate a slow query
        const [locations] = await sql.query('SELECT * FROM location');
        return res.json(locations);
    }
    catch(error) {
        return res.status(500).json({
            message: 'Internal server error',
        });
    }
});
Once you run the load test suite for this version of code, you’ll notice a significant gain in response times, including the minimum response time:

Though Artillery can’t detect database issues, it can guide you to find slow queries by navigating through endpoints. Learn how to improve MySQL performance in production apps from this article.
In some scenarios, we can fix performance issues by refactoring code to optimize algorithms, change third-party APIs, etc. Once you detect slowness in a specific API endpoint, you can quickly load-test the particular endpoint with ongoing code refactoring, as follows:
artillery quick http://localhost:5000/locations -c 5 -n 2
The above command creates 10 HTTP requests with 5 virtual users who create 2 requests each.
You can run two Artillery instances side-by-side if the refactor affects the entire API (i.e., changing an underlying protocol):
npm run load-test
npm run load-test -- --target http://localhost:5001

# --- or ---
yarn load-test
yarn load-test --target http://localhost:5001
Comparing both reports will give you an idea of the specific code refactoring’s performance improvement.
Artillery can load test both HTTP and WebSocket protocols. WebSocket testing requires using the ws engine, which implements five communication actions for the flow segment: connect, send, think, loop, and function.
Here is a simple example scenarios configuration that sends a test message to a WebSocket server:
scenarios:
  - name: WebSocket test
    engine: ws
    flow:
      - send: "Hello from Artillery!"
You can see a complete guide about the Artillery WebSocket engine from the official documentation and inspect a sample project in this GitHub repository folder. Artillery also supports load testing Socket.IO-based web services, as demonstrated in this project.
Internally, Artillery uses a better design principle to achieve extendability — it implements runner logic in the core and uses plugins for extended features. It offers pre-developed, pre-activated plugins for every common load testing scenario; you can build your own plugins for advanced unique load testing requirements.
The official Artillery blog has an article about developing custom plugins, and the official documentation offers these guidelines for plugin development.
Artillery also offers several extension APIs via pre-developed engines, known as Hooks. For example, the HTTP engine offers the beforeRequest Hook to run a custom JavaScript function handler before each HTTP request:
- post:
    url: "/customers"
    beforeRequest: "setCustomHeaders"
Besides this, you can create custom engines using the generic engine interface. Check the official engine API references for more details.
In this tutorial, we learned about the Artillery load test runner features by creating a complete load test suite for a simple Node.js RESTful API. We ran the sample test suite on GitHub Actions, learned how Artillery helps to identify performance issues, and checked out advanced Artillery features.
Artillery typically generates reports on the terminal and offers inbuilt commands to generate well-structured HTML reports. You can publish metrics to external cloud monitoring tools via the publish-metrics plugin and it’s possible to use the Artillery Cloud dashboard to analyze your load tests in real-time.
Artillery doesn’t come with a GUI like Apache JMeter or Postman, but it undoubtedly offers a developer-friendly, CI/CD server-friendly productive CLI and minimal test script format to integrate load tests for any web service in record time. Artillery’s simplicity, productivity, and developer-friendliness indeed make it competitive with other alternative load test runners.
 Monitor failed and slow network requests in production
Deploying a Node-based web app or website is the easy part. Making sure your Node instance continues to serve resources to your app is where things get tougher. If you’re interested in ensuring requests to the backend or third-party services are successful, try LogRocket.
LogRocket lets you replay user sessions, eliminating guesswork around why bugs happen by showing exactly what users experienced. It captures console logs, errors, network requests, and pixel-perfect DOM recordings — compatible with all frameworks.
LogRocket's Galileo AI watches sessions for you, instantly identifying and explaining user struggles with automated monitoring of your entire product experience.
LogRocket instruments your app to record baseline performance timings such as page load time, time to first byte, slow network requests, and also logs Redux, NgRx, and Vuex actions/state. Start monitoring for free.
Hey there, want to help make our blog better?
Join LogRocket’s Content Advisory Board. You’ll help inform the type of content we create and get access to exclusive meetups, social accreditation, and swag.
Sign up now
This guide explores how to use Anthropic’s Claude 4 models, including Opus 4 and Sonnet 4, to build AI-powered applications.

Which AI frontend dev tool reigns supreme in July 2025? Check out our power rankings and use our interactive comparison tool to find out.

Learn how OpenAPI can automate API client generation to save time, reduce bugs, and streamline how your frontend app talks to backend APIs.

Discover how the Interface Segregation Principle (ISP) keeps your code lean, modular, and maintainable using real-world analogies and practical examples.