Graphery SVG, usually referred to as gySVG is a small, but powerful library used to simplify the construction and manipulation of SVG graphics from JavaScript. This library can be used in Vanilla JavaScript and frameworks like React, Vue, Svelte, Stencil, or Angular. In this article, we will discuss the basics of SVG and how to use Graphery to create simple and complex shapes.
The Replay is a weekly newsletter for dev and engineering leaders.
Delivered once a week, it's your curated guide to the most important conversations around frontend dev, emerging AI tools, and the state of modern software.
SVG stands for scalable vector graphics and is used to define vector-based graphics for the web in XML format.
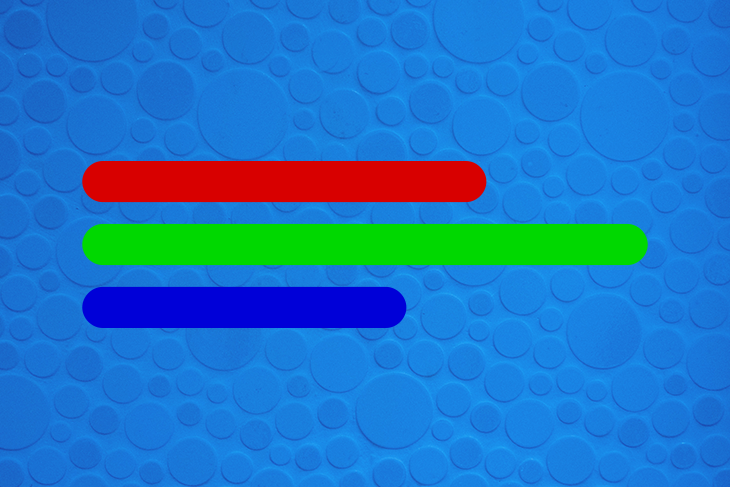
Here is a very simple example of an SVG (yellow circle with green border):
<svg width="100" height="100">
  <circle cx="50" cy="50" r="40" stroke="green" stroke-width="4" fill="yellow" />
</svg>
The main goal is to reduce code complexity. Even though there have been many SVG libraries over the years, there was still a need to build a new library that was smaller and faster, and closer to the SVG format. The result is gySVG. In previous SVG libraries, the minimized library size was less around 3 KB; this value is reduced to 1.5 KB with gzip. Graphery SVG is also faster, taking 20ms compared to 40ms for SVG.js.
gySVG is a simple library that provides an easy way to work with SVG without penalizing the project performance or size.
As many of us know, creating a simple SVG requires many lines of code in Vanilla JavaScript which can become challenging to understand and maintain. Using gySVG simplifies the creation and manipulation of code through a set of very light methods that fit SVG DOM attributes, properties, and methods.
const div = document.querySelector('#drawing');
const svg = document.createElementNS('http://www.w3.org/2000/svg', 'svg');
svg.setAttribute('width', '100%');
svg.setAttribute('height', '100%');
div.appendChild(svg);
const rect = document.createElementNS('http://www.w3.org/2000/svg', 'rect');
rect.setAttribute('x', '10');
rect.setAttribute('y', '10');
rect.setAttribute('width', '90');
rect.setAttribute('height', '90');
rect.setAttribute('fill', '#F06');
svg.appendChild(rect);
const svg = gySVG().width('100%').height('100%');
const rect = svg.add('rect').x(10).y(10).width(90).height(90).fill('#f06');
svg.attachTo('#drawing');
The result is an entirely valid SVG that can be used without limitations as part of the HTML DOM. As you can see, it is a much simpler block.
The magic of gySVG lies in its use of proxy, which is one of the most powerful features of ES6. JavaScript’s proxies allow us to create the wrappers dynamically for each SVG element, reducing the library’s size, while keeping up the performance.
Proxy is supported by:
Proxy is not supported by Internet Explorer 11, and is cannot be integrated using polyfills or transpilers.
There are two methods to get started with gySVG: load from CDN or install locally with npm.
When loading from CDN, either use Import module or load the script version. The easiest way to use gySVG library is to import it as an ES module from our CDN service:
import gySVG from 'https://cdn.graphery.online/svg/0.1.4/module/index.js';
Another easy way is to load the script version from our CDN with a tag <script>:
<script src="https://cdn.graphery.online/svg/0.1.4/script/index.js"></script>;
npmYou can install the Graphery SVG library locally by npm:
npm install @graphery/svg
If you have installed locally, you’ll need to reference node_modules/@graphery/svg and use this code for import:
import SVG from './node_modules/@graphery/svg/index.js';
Or, load script as follows:
<script src="./node_modules/@graphery/svg/script/index.js"></script>
If you use webpack or other loaders, you may be able to omit the node_modules folder in these calls.
The function gySVG() creates an SVG element and returns an object with a gySVG wrapper over that element. It can be used to nest other elements, define its coordinate system, or establish other configuration parameters.
const svg = gySVG();
The above acts similarly to having the SVG HTML tags (<svg></svg>).
For display elements, you can use the method .viewBox() to define the graphic’s internal canvas, while the methods .width()and .height() can be used to define the viewport. We will discuss these in more detail in the following sections.
viewBoxThe .viewBox() method defines the internal position and dimensions of an SVG. It makes use of four parameters: min-x, min-y, width, height. These numbers specify a rectangle that is mapped within the internal boundaries associated with the SVG element. All measures of nested elements take these dimensions as a reference. Calling this method without parameters will return the current viewbox value.
Example:
const svg = gySVG().viewBox(0, 0, 100, 100);
These methods are used to define the viewport, i.e, the image’s size in the HTML page where they will be embedded. The horizontal length is defined with .width() and the vertical length is defined with .height().
Example:
const svg = gySVG().width(100).height(100);
Finally, to include the SVG within the DOM of our HTML page, we use the .attachTo() method, which provides a parameter as a selector to locate the element. As a result, our SVG is inserted into the page.
Example:
const svg = gySVG().viewBox(0, 0, 100, 100).width(50).height(50);
svg.attachTo('#content')
Before we continue on to see how to create basic shapes like circles and rectangles using gySVG, we will first review how to add nested elements.
To add elements within the SVG we will use .add() method passing a parameter with the name of the element that we want to create. This method returns an object which we can use to set up all the characteristics of the element we have named (in this example, circle).
Example:
const svg    = gySVG().viewBox(0, 0, 100, 100).width(75).height(75);
const circle = svg.add('circle').cx(50).cy(50).r(50).fill('#f06');
Next, we will walk through how to create basic shapes with gySVG. Note, every element and attribute in an SVG file can be animated if desired.
To create a rectangle, we will make use of the .add('rect') method. The .width() and .height() establish the size of the rectangle while .x() and .y() moves the shape to the appropriate position. All of these values are related to the dimensions defined in the viewBox.
Example:
const svg  = gySVG().viewBox(0, 0, 100, 100).width(75).height(75);
const rect = svg.add('rect').x(10).y(10).width(90).height(90).fill('#00D800');
.fill() sets the interior color for the shape, while .stroke() sets the border color and .stroke_width() the width of this border. Note that all colors default to black when left unspecified.
It is also possible to create rounded corners by specifying values within .rx() and .ry().
To create a circle, we will make use of the .add('circle') method, which creates a circle defined with a center point (.cx() and .cy()) and an outer radius (.r()). All these values are determined according to the dimensions defined in the viewBox.
Example:
const svg    = gySVG().viewBox(0, 0, 100, 100).width(75).height(75);
const circle = svg.add('circle').cx(50).cy(50).r(50).fill('#0000D8');
The .fill() method sets the interior color for the circle while the method .stroke() can be used to set the circle border color and .stroke_width() the border width.
Example:
const svg    = gySVG().viewBox(0, 0, 100, 100).width(75).height(75);
const circle = svg.add('circle').cx(50).cy(50).r(45)
                  .fill('#D80000').stroke('#00D800').stroke_width(10);
Learn how to create other shapes like ellipses, polygons, lines, and more here.
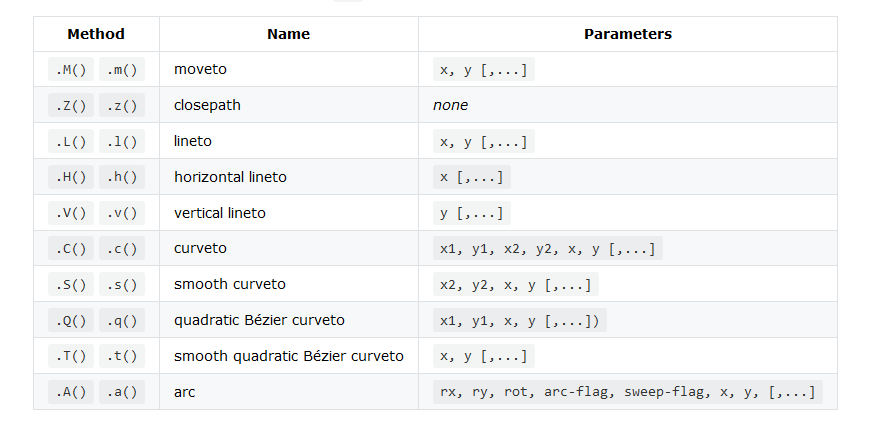
The .add('path') method is used to create an SVG path. This element represents the outline of a shape. Although all basic shapes can be created with a path element, path elements are normally reserved for more complex shapes.
The path information is described with .d and a group of special methods, or directly with .d(path_data). The easiest approach is to use .d methods like .d.M() or .d.L() and then build the path data step-by-step from there.
Uppercase letter methods express coordinates in absolute terms, while lowercase methods express them in relative terms from the most recently declared coordinates. Here is a short list of available methods in .d:
Example:
gySVG () is used in the code below to create an SVG heart with path element.
See the Pen
Heart | SVG by Olawanle Joel (@olawanlejoel)
on CodePen.
In previous examples, we saw how to make use of .fill() and .stroke() to add color to an SVG. In this section, we will consider how to make use of gradients and patterns to fill shapes.
We can .fill() and .stroke() values with the gradient’s and pattern’s method .url(). This method return the element’s unique id reference with the pseudo-function url().
There are two types of gradients that we will consider: linear and radial.
linearGradient changes color uniformly along a straight line based on each of the color points (stop) and the transition between them. By default, the gradient is from left to right; if you need another angle (for example, 45), you can use .gradientTransform(rotate(45)).
The stop element is defined with an .offset() to define a percentage, and .stop_color() and .stop_opacity() to define the color reference for that point.
The code below is used to create a circle shape SVG with a linear gradient fill.
See the Pen
Linear Grad. | Graphery SVG by Olawanle Joel (@olawanlejoel)
on CodePen.
radialGradient is very similar to linearGradient, but in this case, the coordinates for the gradient are now circular, moving from the center to the edge.
The code below is used to create a circle shape SVG with a radial gradient fill.
See the Pen
Radial Grad. | Graphery SVG by Olawanle Joel (@olawanlejoel)
on CodePen.
pattern defines a graphic object which can be redrawn on intervals into the SVG. It has its own .viewBox() bound reference, and its size is defined by .width() and .height().
The behavior of width and height depends on the .patternUnits() configuration, which, by default, is objectBoundingBox. To proceed, we will need to configure it as 'userSpaceOnUse'. With this configuration, height and width are references to the element’s coordinate system that uses the pattern.
The code below is used to create a circle shape SVG with pattern fill:
See the Pen
Pattern | Graphery SVG by Olawanle Joel (@olawanlejoel)
on CodePen.
In addition to being great for creating basic and complex shapes, gySVG can also be used to build more dynamic elements including:
See the Pen
gySVG: clock by graphery (@graphery)
on CodePen.
This example is a very simple car racing game. Click the start button to see how it works!
See the Pen
car racing by graphery (@graphery)
on CodePen.
Explore even more gySVG examples and documentation here.
In this article, we’ve seen how to get started with Graphery SVG in JavaScript, including how to create both basic and complex shapes using gySVG. Check out additional Graphery documentation or their quick reference guide for more information.
Install LogRocket via npm or script tag. LogRocket.init() must be called client-side, not
server-side
$ npm i --save logrocket

// Code:

import LogRocket from 'logrocket';
LogRocket.init('app/id');
// Add to your HTML:

<script src="https://cdn.lr-ingest.com/LogRocket.min.js"></script>
<script>window.LogRocket && window.LogRocket.init('app/id');</script>
Learn how to build advanced Next.js forms with rule engines, client-side previews, Server Actions, and server-validated form logic.

AI is reshaping engineering teams emotionally as well as technically. A CTO shares insights on fear, trust, burnout, identity, and leading through AI change.

Learn what context rot is, why AI agent sessions degrade over time, and how to fix it with compaction, prompt anchoring, context files, plan files, and RAG.

Learn about TypeScript v6’s breaking changes, new ES2025 features, and deprecated options. A complete migration guide from v5 to prepare for v7.
Would you be interested in joining LogRocket's developer community?
Join LogRocket’s Content Advisory Board. You’ll help inform the type of content we create and get access to exclusive meetups, social accreditation, and swag.
Sign up now