
When building web applications, it is almost impossible to avoid encountering bugs. This could range from a typo to a forgotten semicolon or an undefined function. But most importantly, you want to have an idea of everything going on in your application, how and when they happen. Having access to this information gives you a lot more control in narrowing down bugs and identifying opportunities to improve your application.
Laravel Telescope gives you exactly this power. It’s an amazing debugging assistant recently introduced in Laravel, that makes development a breeze with tools that allow you to not only monitor and debug various aspects of your application but also have access to a wide range of information that you’d normally not have direct access to.
Laravel Telescope provides insights into the requests coming into your application, exceptions, log entries, database queries, queued jobs, mail, notifications, cache and a lot more. It also shows how different parts of your application work together. You can find out which pages are working right and which queries were run when a request was made to a certain page.
In this article, we will be covering the amazing features of Telescope, how to set it up and what it can do for you.

If debugging in Laravel is not foreign to you, then chances are you may have used the following tools in the past to cater to your debugging needs.
Clockwork gives you an insight into your PHP application runtime, including request data, application log, database queries, cache usage, execution visualization and much more.
Clockwork provides a Chrome or Firefox extension, or a web UI and a server-side component for gathering data that easily integrates with any PHP project, including out-of-the-box support for major frameworks.
Laravel Debugbar adds a small bar at the bottom of the browser with debug information (e.g the number of queries). With Eloquent it can be easy to make unnecessary database requests so Debugbar helps to identify code that is not performant. It displays this right next to the developer console at the bottom of the browser.
Laravel log viewer allows you to see the logs from the storage/logs file in the browser as a pretty HTML table. The logs will be available at /logs.
Laravel Telescope provides a very powerful user interface for you to view, monitor and debug various aspects of your application. From requests to commands run in the terminal and even scheduled jobs. It does this through multiple watchers that have been configured to monitor these things.
These watchers have been designed to collect information about every request coming into your application, provide insight into database queries, how long they take to execute, exceptions encountered, events, queues, commands and more.
Laravel Telescope was introduced in the latest Laravel version which is 5.7 and requires a minimum of Laravel 5.7.7 to work. At the time of this writing, Laravel is at version 5.7.14.
Once you have your Laravel application good to go, you can install Telescope through composer by running:
composer require laravel/telescopeYou can also specify during installation if you want it to only work in your dev environment using the --dev flag. To do that, you’ll have to run:
composer require laravel/telescope --devOnce done, you can publish the telescope assets and run migrations:
php artisan telescope:installphp artisan migrate
Laravel comes with two migrations already in place for you, the users table and the password_resets table. When you run the migration, three tables are also created that handle telescope operations namely — telescope_entries, telescope_entries_tags, and telescope_monitoring.
Now, that we have installed and set up Telescope, visit /telescope on your project and you’ll arrive right in the telescope dashboard with tabs on the left listing pages that highlight the features.
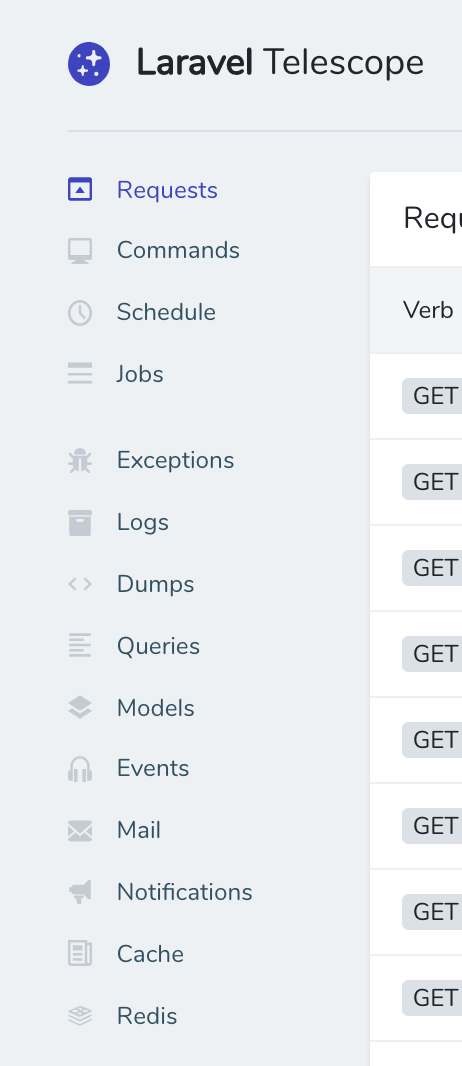
Each of the features listed above has its own page and watcher set up in Telescope. Now, we will go through what each of them lets us monitor and the details they provide.
This feature page lists out all of the HTTP requests that come into your application and the time the request was made. It also provides additional information on each request by clicking on the eye icon to the right of each entry.
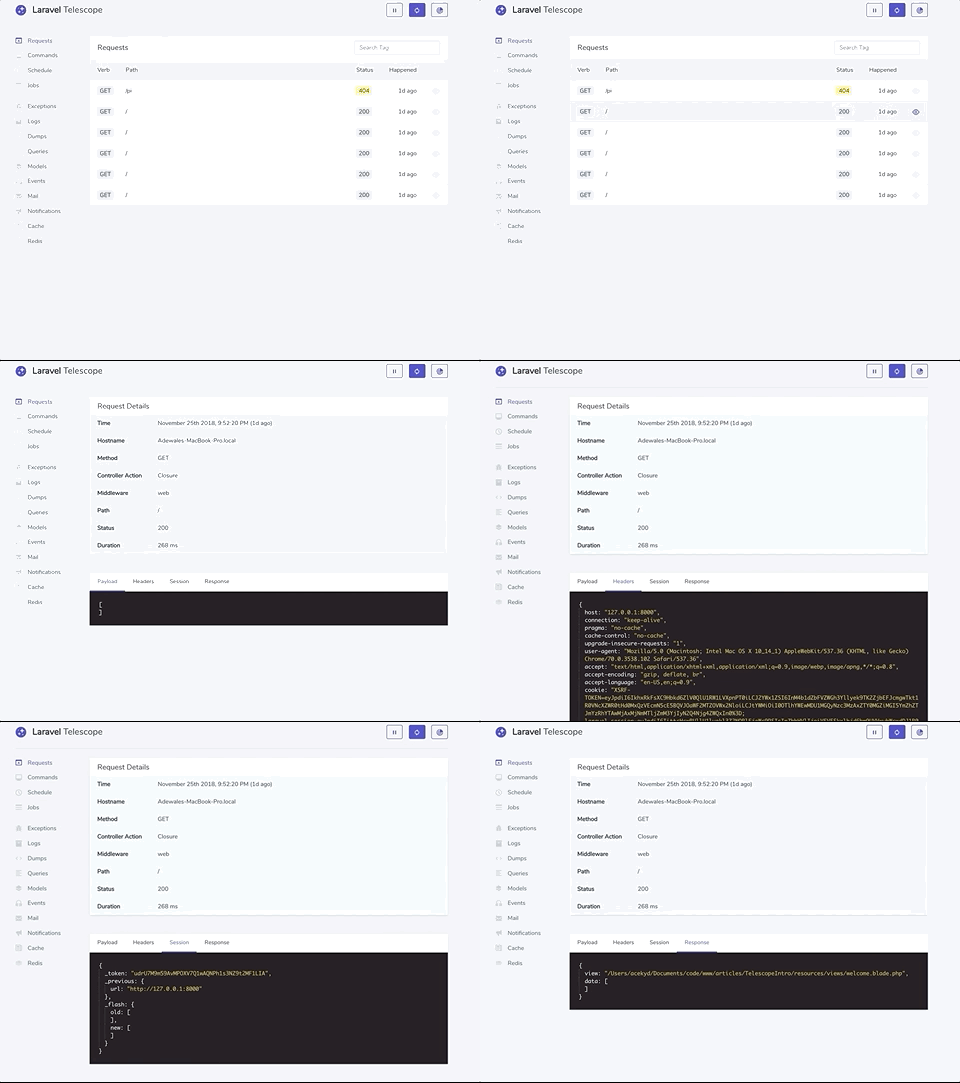
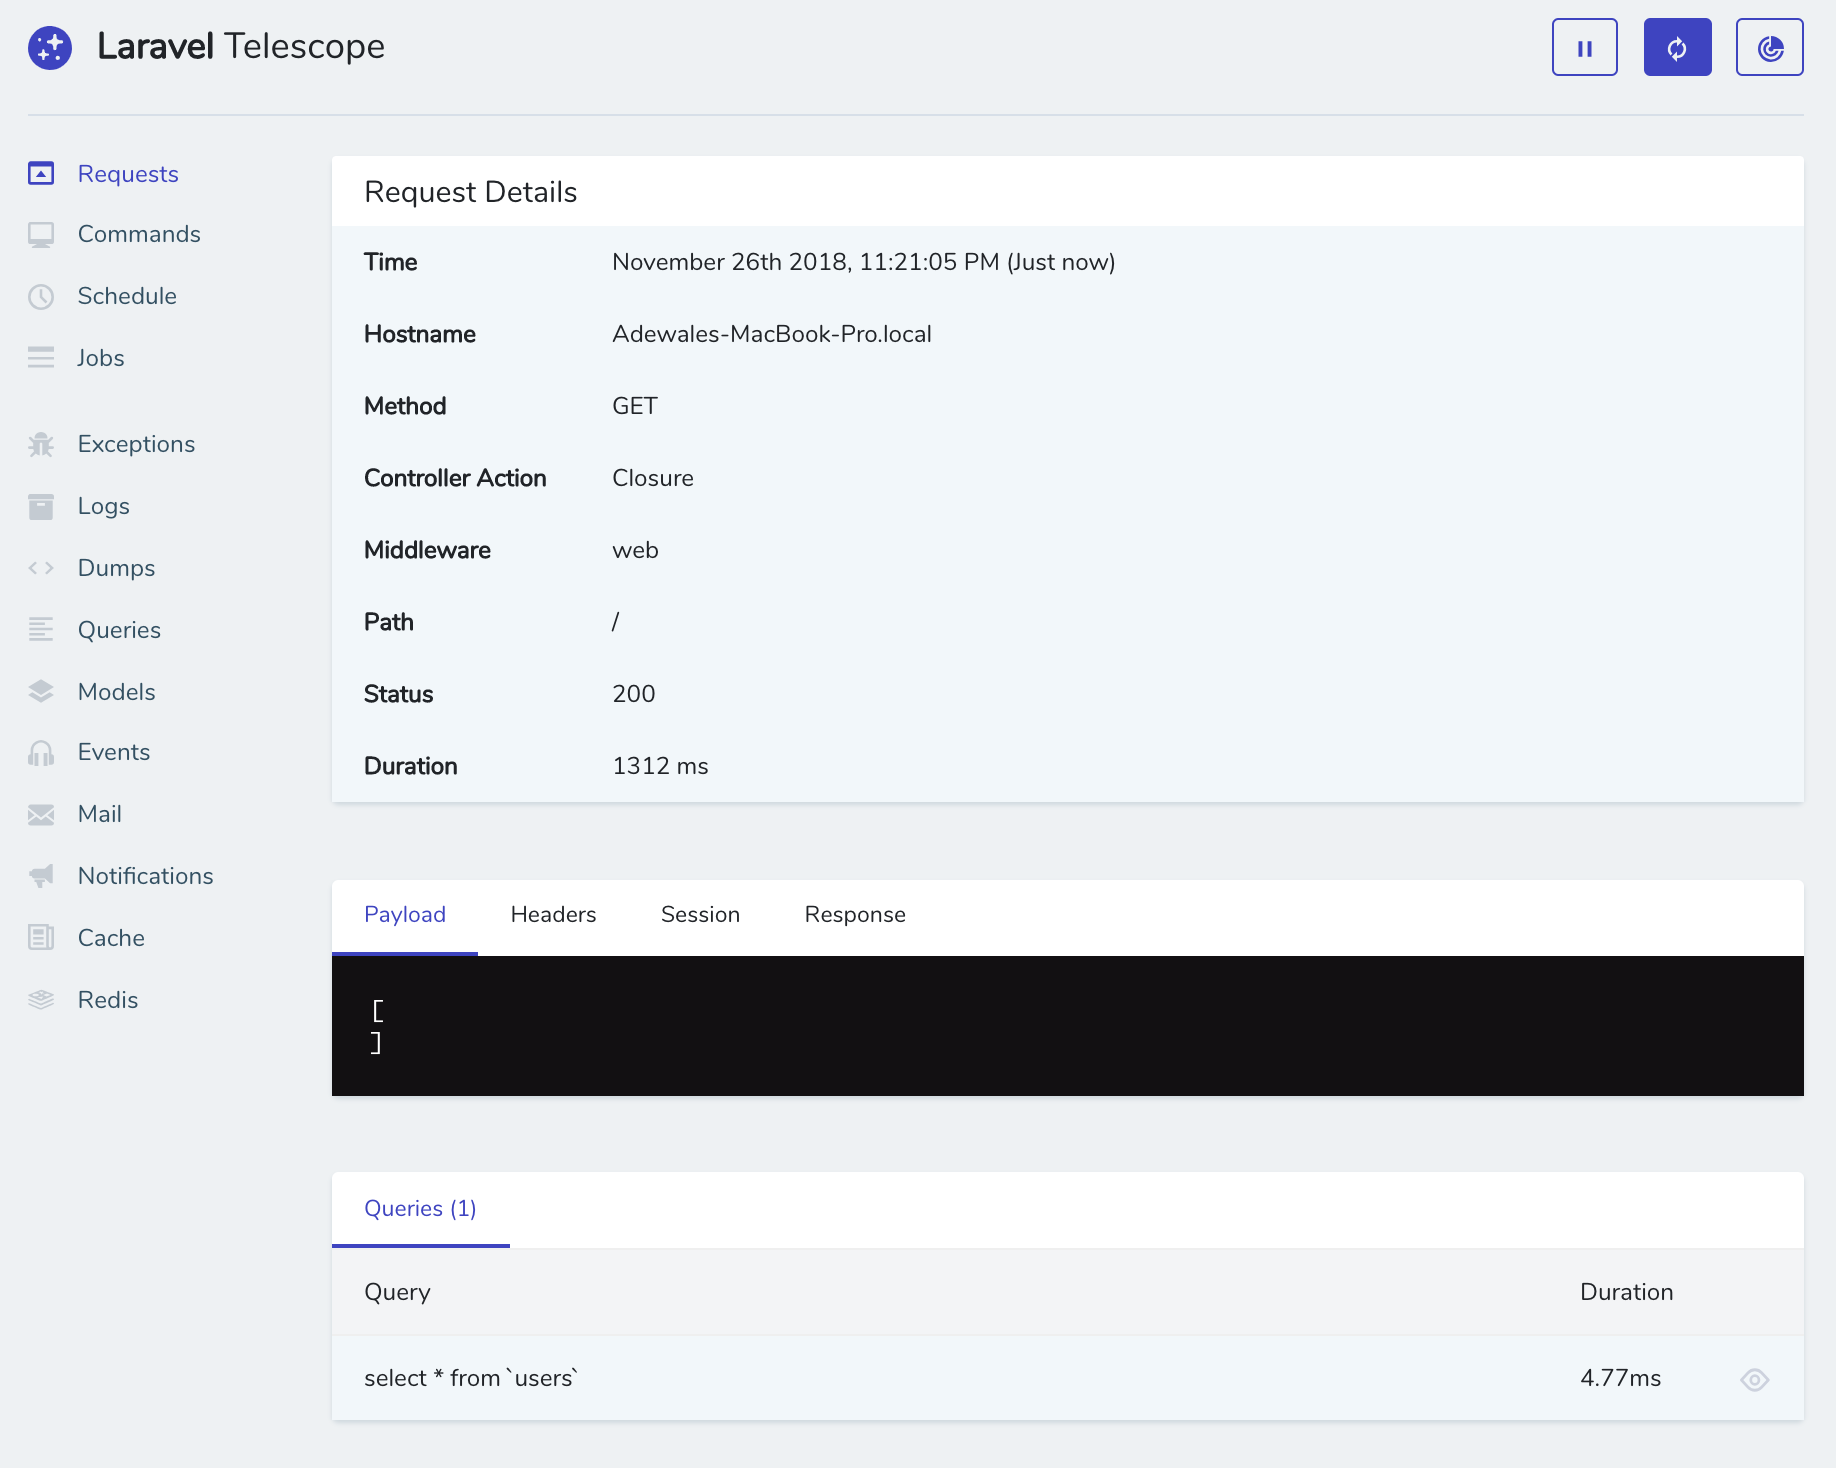
For each request made, you are also able to view related data from other watchers. For example, I ran a quick query to fetch all of the users on the homepage and it shows up in the requests along with how long that query took. This additional information is not limited to queries alone and can show information on any other watcher that was triggered by the request.
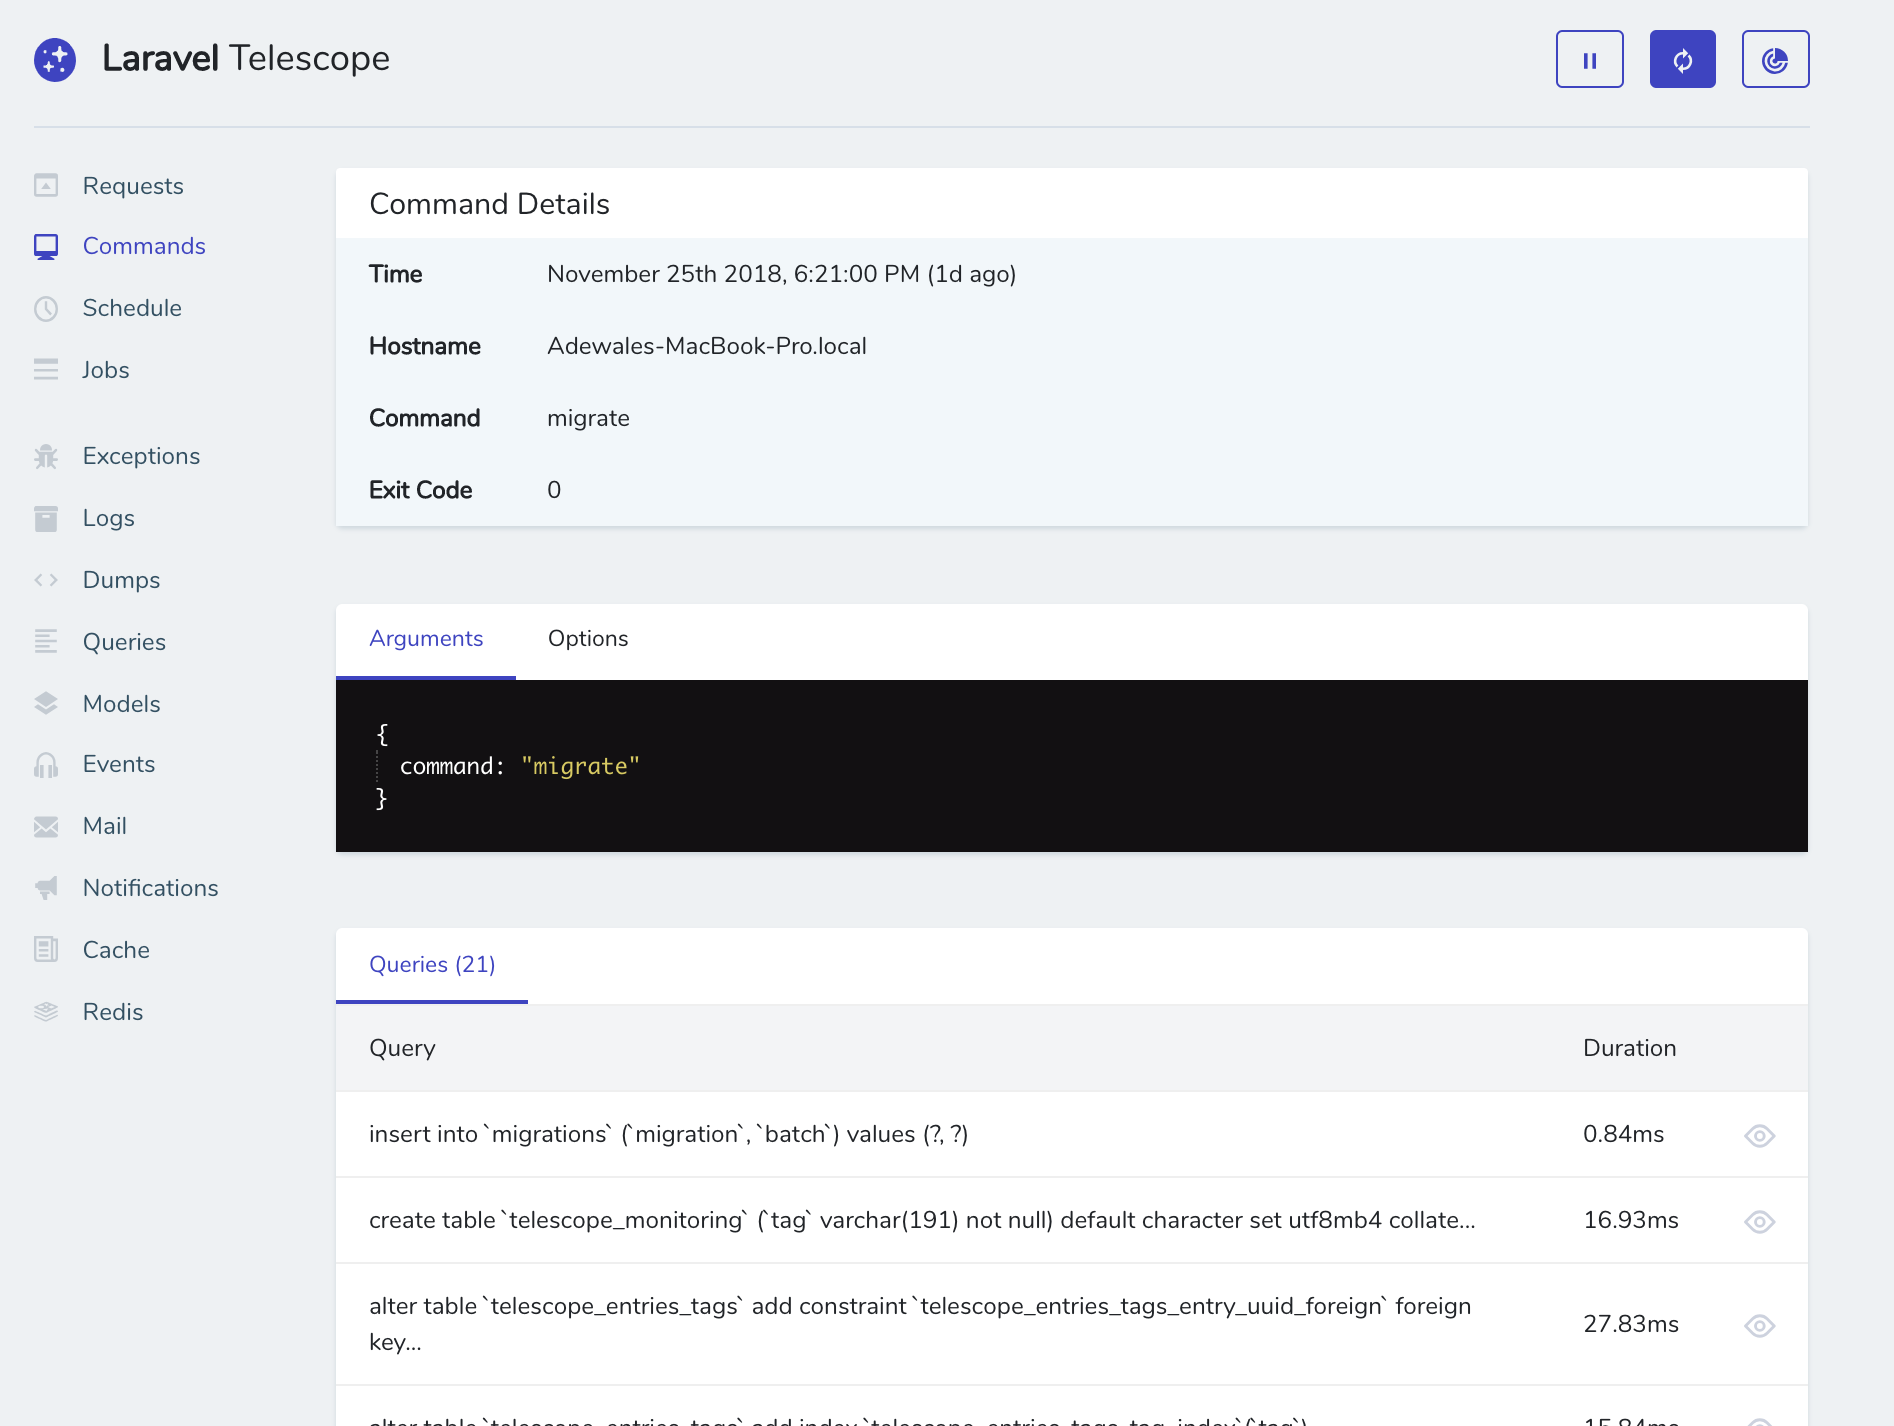
Telescope isn’t just limited to actions in the browser or requests but also covers Artisan commands run in the terminal as well. The commands page lists all of the commands that have been run in the terminal and shows if they were a success using their exit codes. Exit codes are usually 0 for when it’s a successful command and returns anything else ranging from 1 to 255 if another result was encountered. An example, as shown below, shows details of the php artisan migrate command ran in the terminal earlier while we were configuring telescope.
Instead of having multiple cron entries for each task you need to schedule on your server, Laravel provides the scheduler that allows you to define these inside Laravel itself. The schedule page lists all of the commands for these scheduled tasks that have been run, providing information on when it happened and the cron schedule. If you have a command that provides an inspirational message at intervals using Laravel’s php artisan inspire, you can track the status each time this schedule is executed.

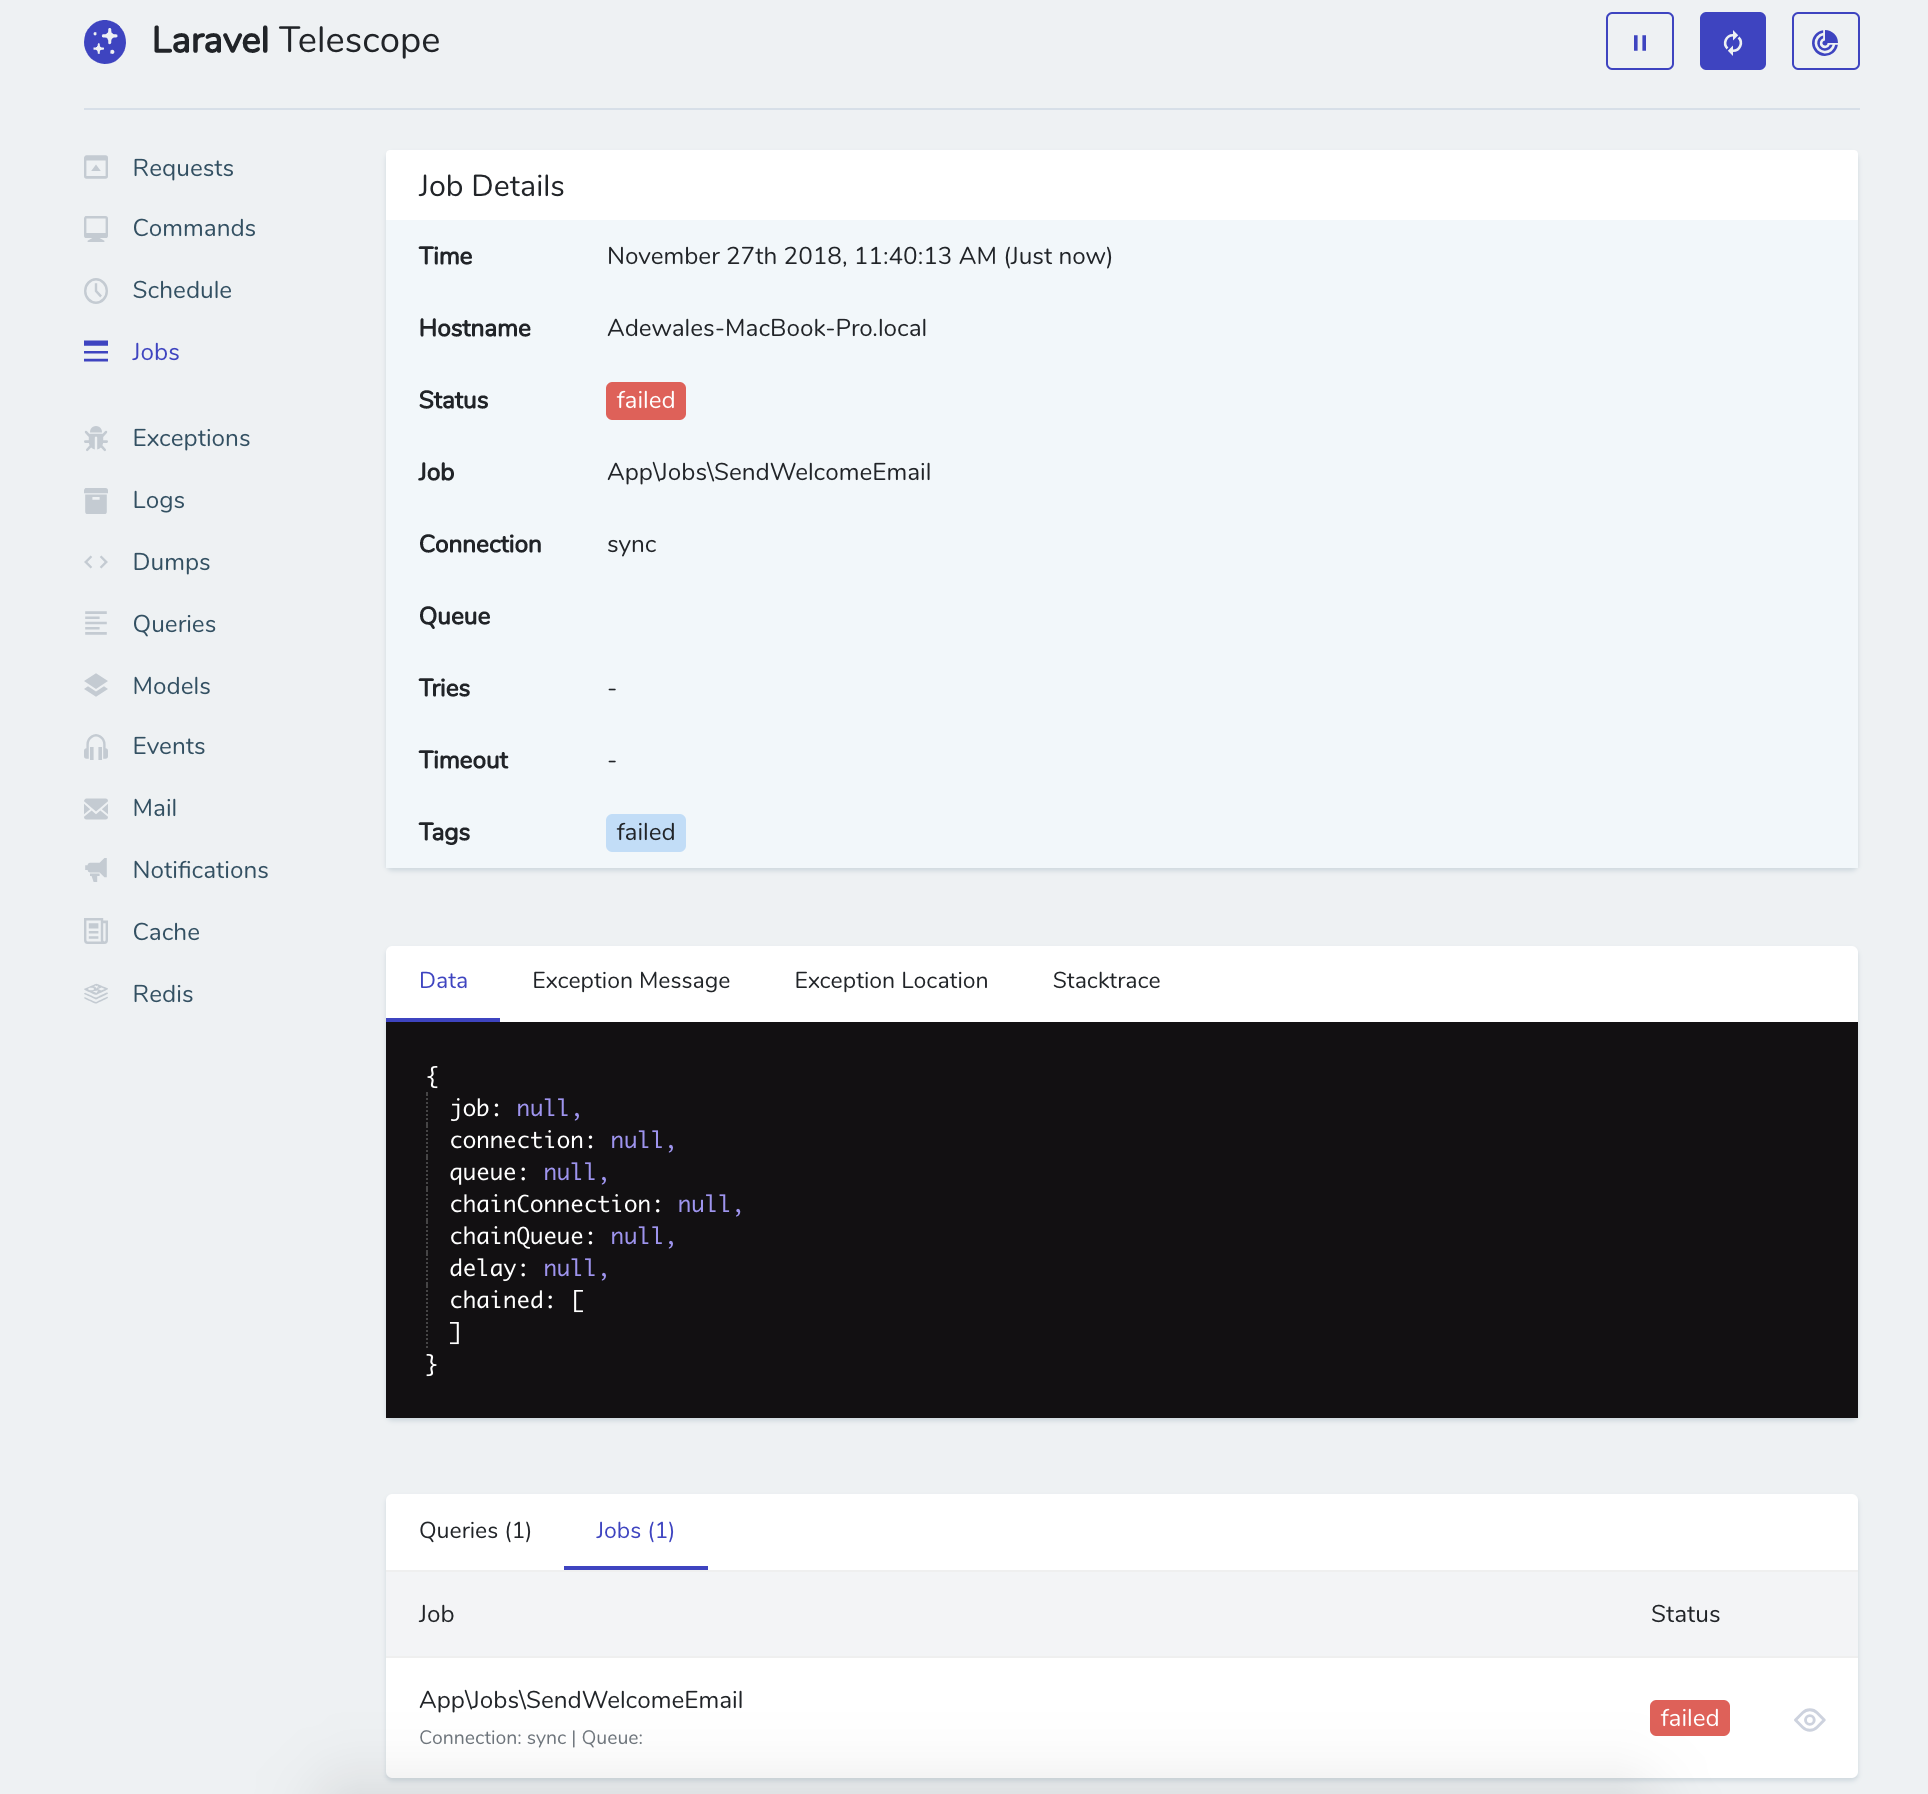
The jobs page also lists out all of the jobs that have been run and their resulting status. Compared to Horizon which handles your Laravel powered Redis queues, Telescope works for all of the queue drivers included in Laravel. On the jobs details page, you can see the number of tries, timeouts, queue and the class name of the job ran etc. Here I have a SendWelcomeEmail job that is triggered anytime a new user signs up. I’m able to see that it failed and then find out why it did.
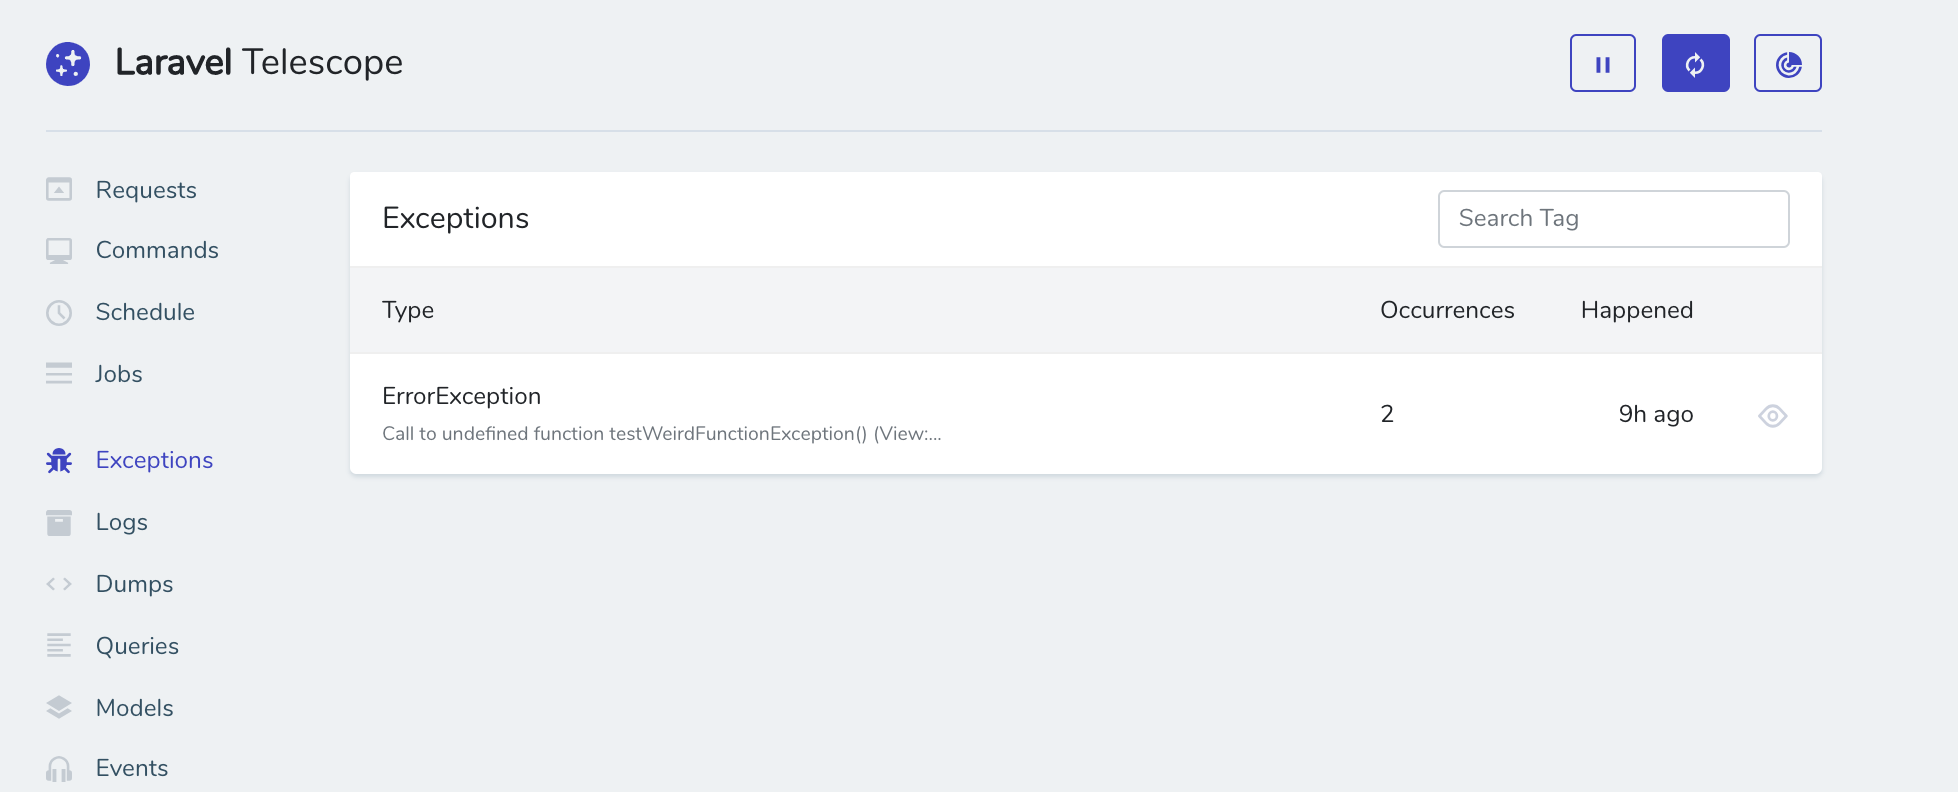
With Telescope, exceptions have become easy to look at. The exception page lists all of the exceptions and the number of times they occurred.
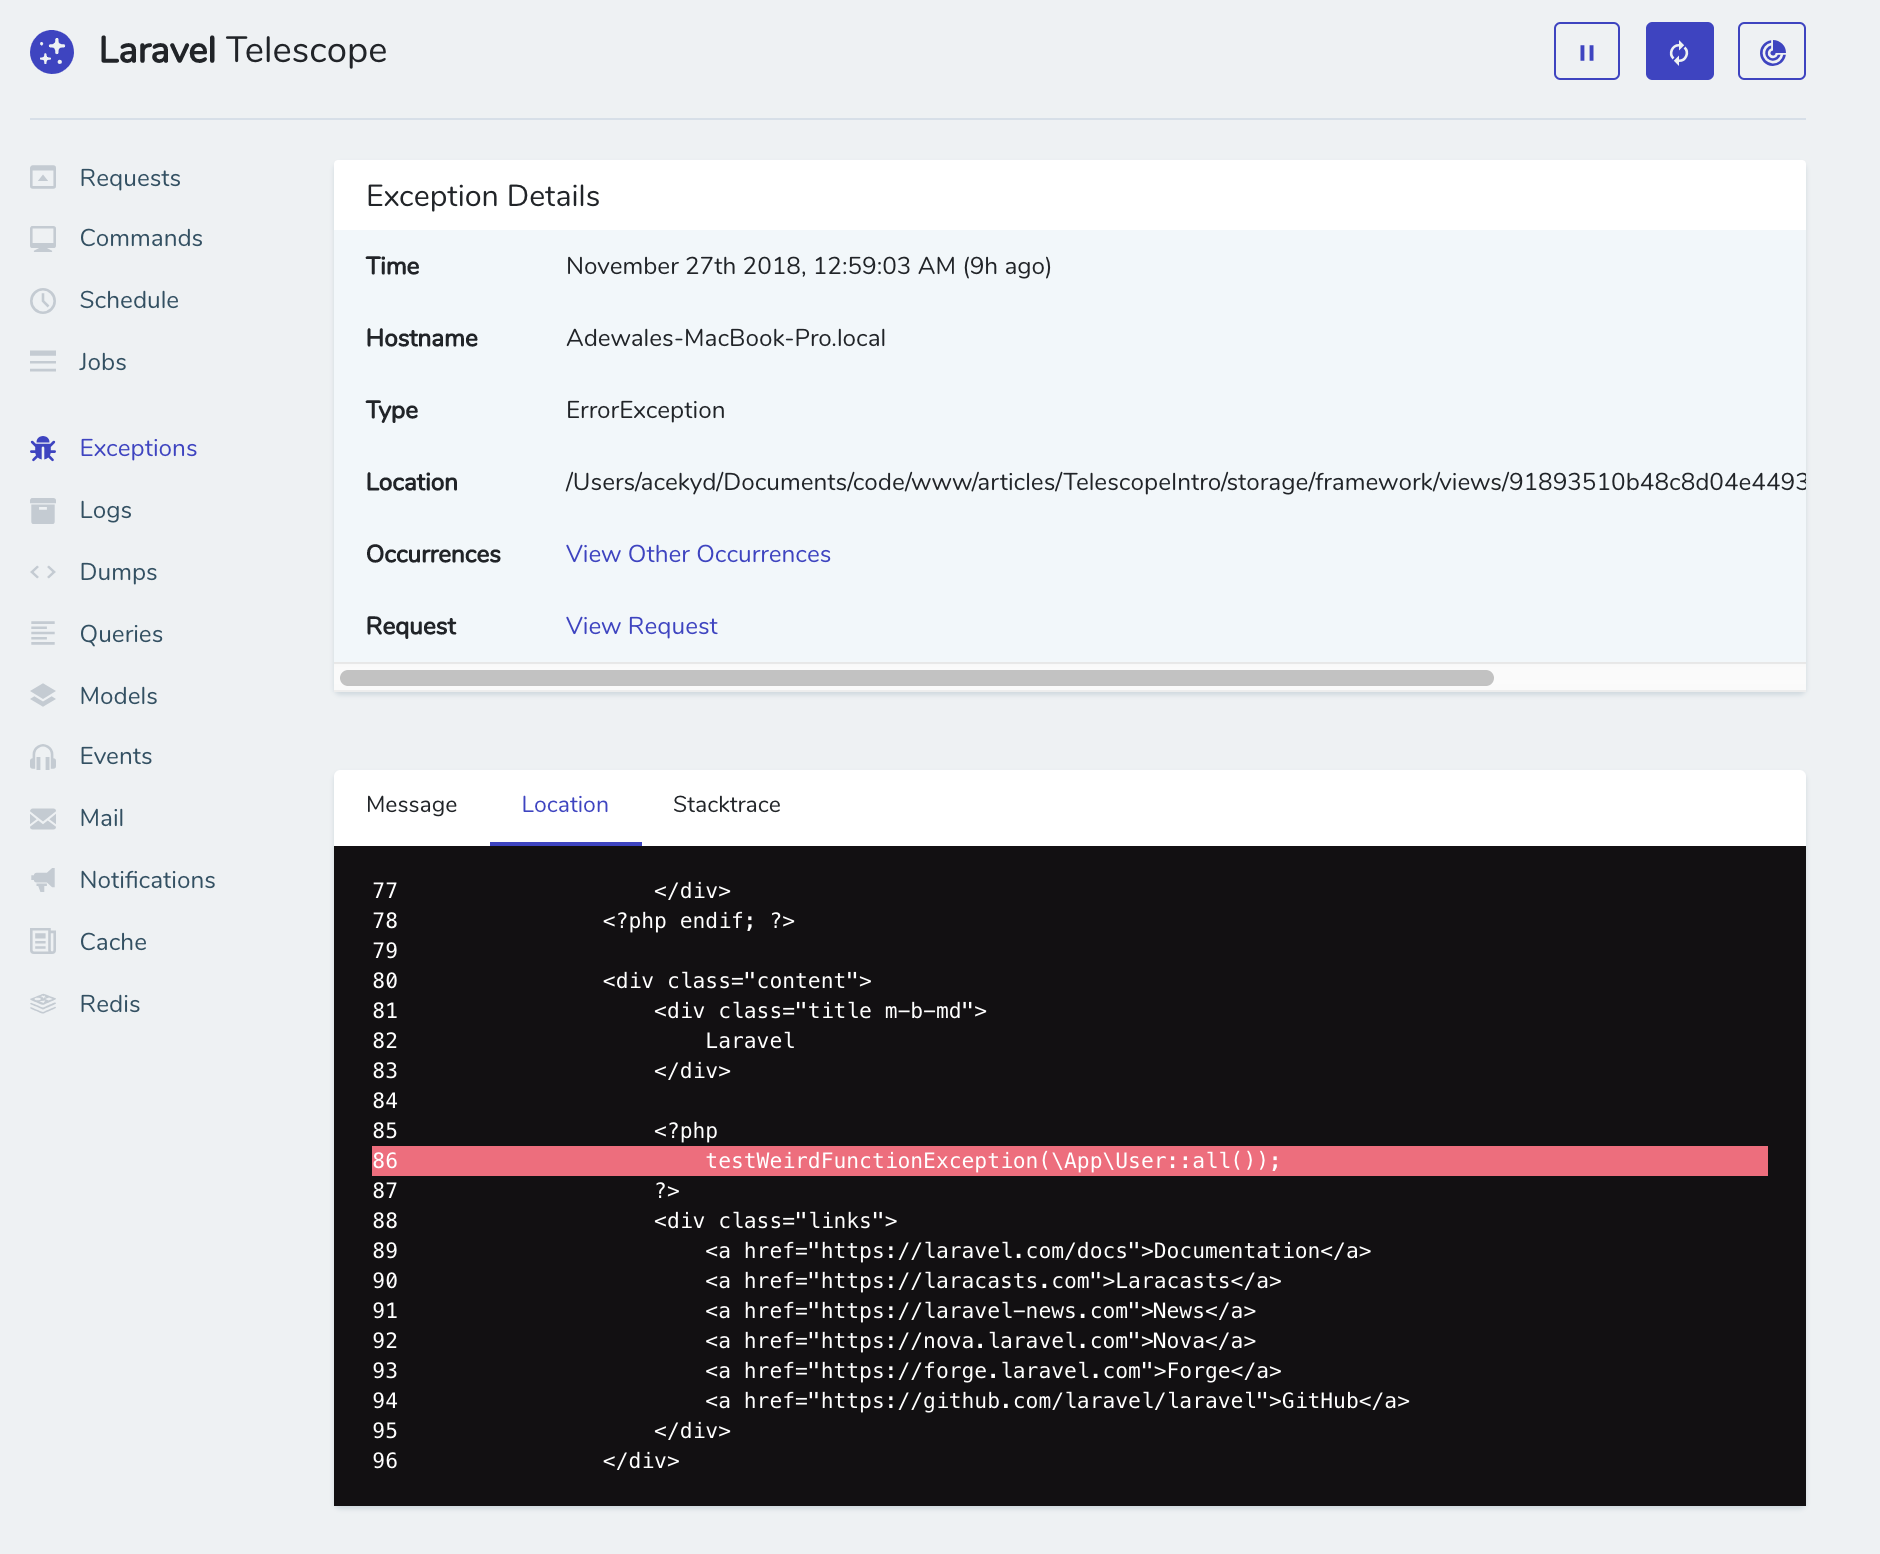
Moving on to the details page, it shows you the exact error message, what line in your code caused it and even the complete stack trace that is neatly formatted and fun to look at 😀.
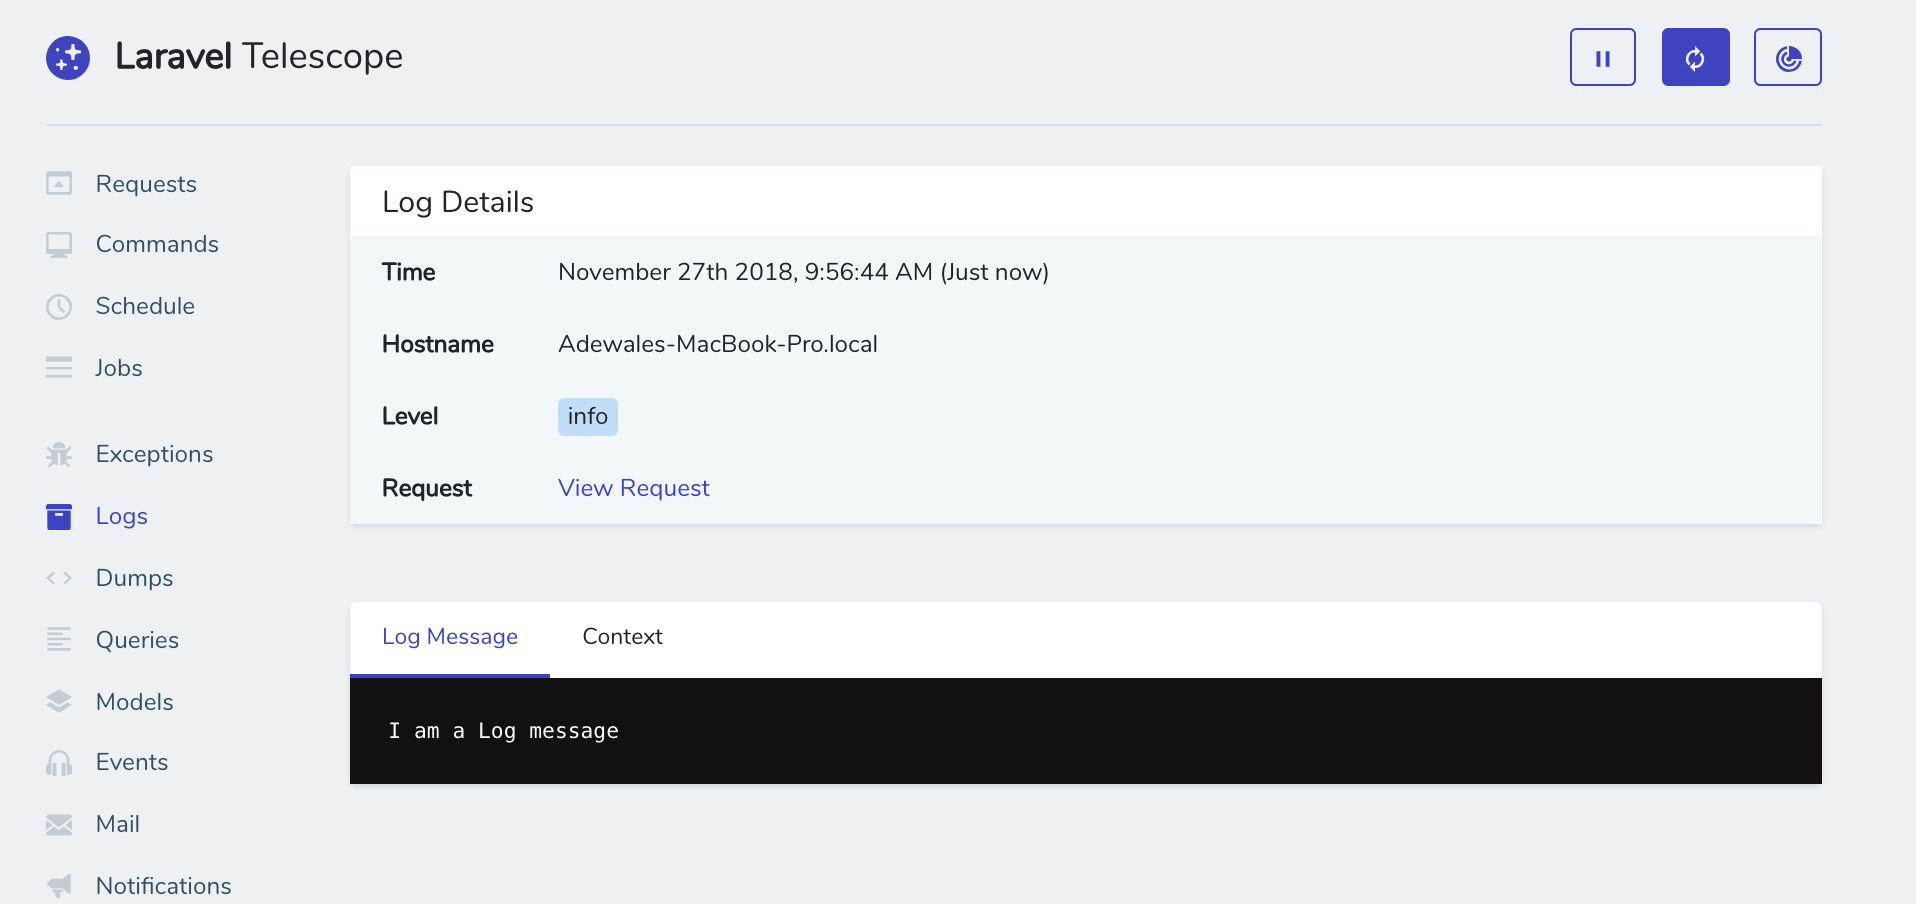
The logs page shows you a list of log messages, level and time each of them happened. Like all other pages, the individual details page shows more information including any context data you might have passed along. This totally beats having to go through the text files at storage/logs for log information.
Most of the time, when faced with a bug, I just want to see the current state of variables or objects or any other information on the screen using the dump() method. Doing this normally results in the page formatting getting a bit distorted, but with Telescope, if you use the dump() method in your code, and you have the Dumps page open in Telescope, your page will appear normal and the output of the data will show up in the Dumps page instead.
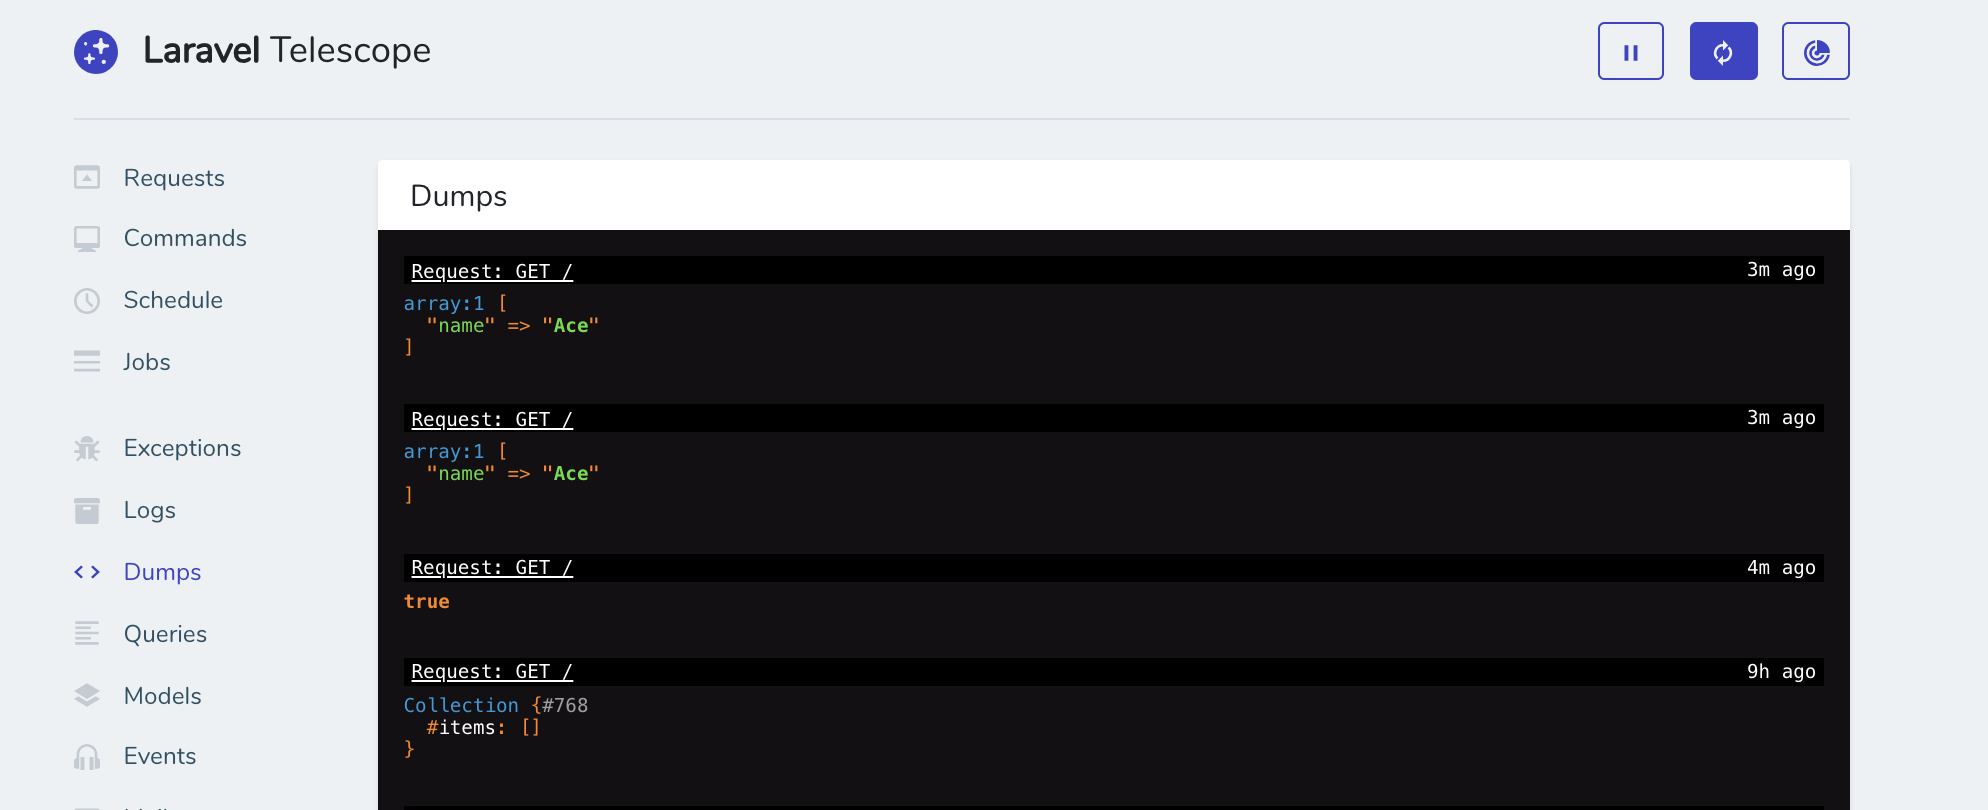
One behavior I noticed with Dumps, however, is that if you try to dump a function that outputs a value directly, the dumps page will only show the returned value and the output will still show up on your page. For example:
function ace() {
    echo "Adewale";
    return false;
}
dump(ace());
Will show up on the dumps page as:

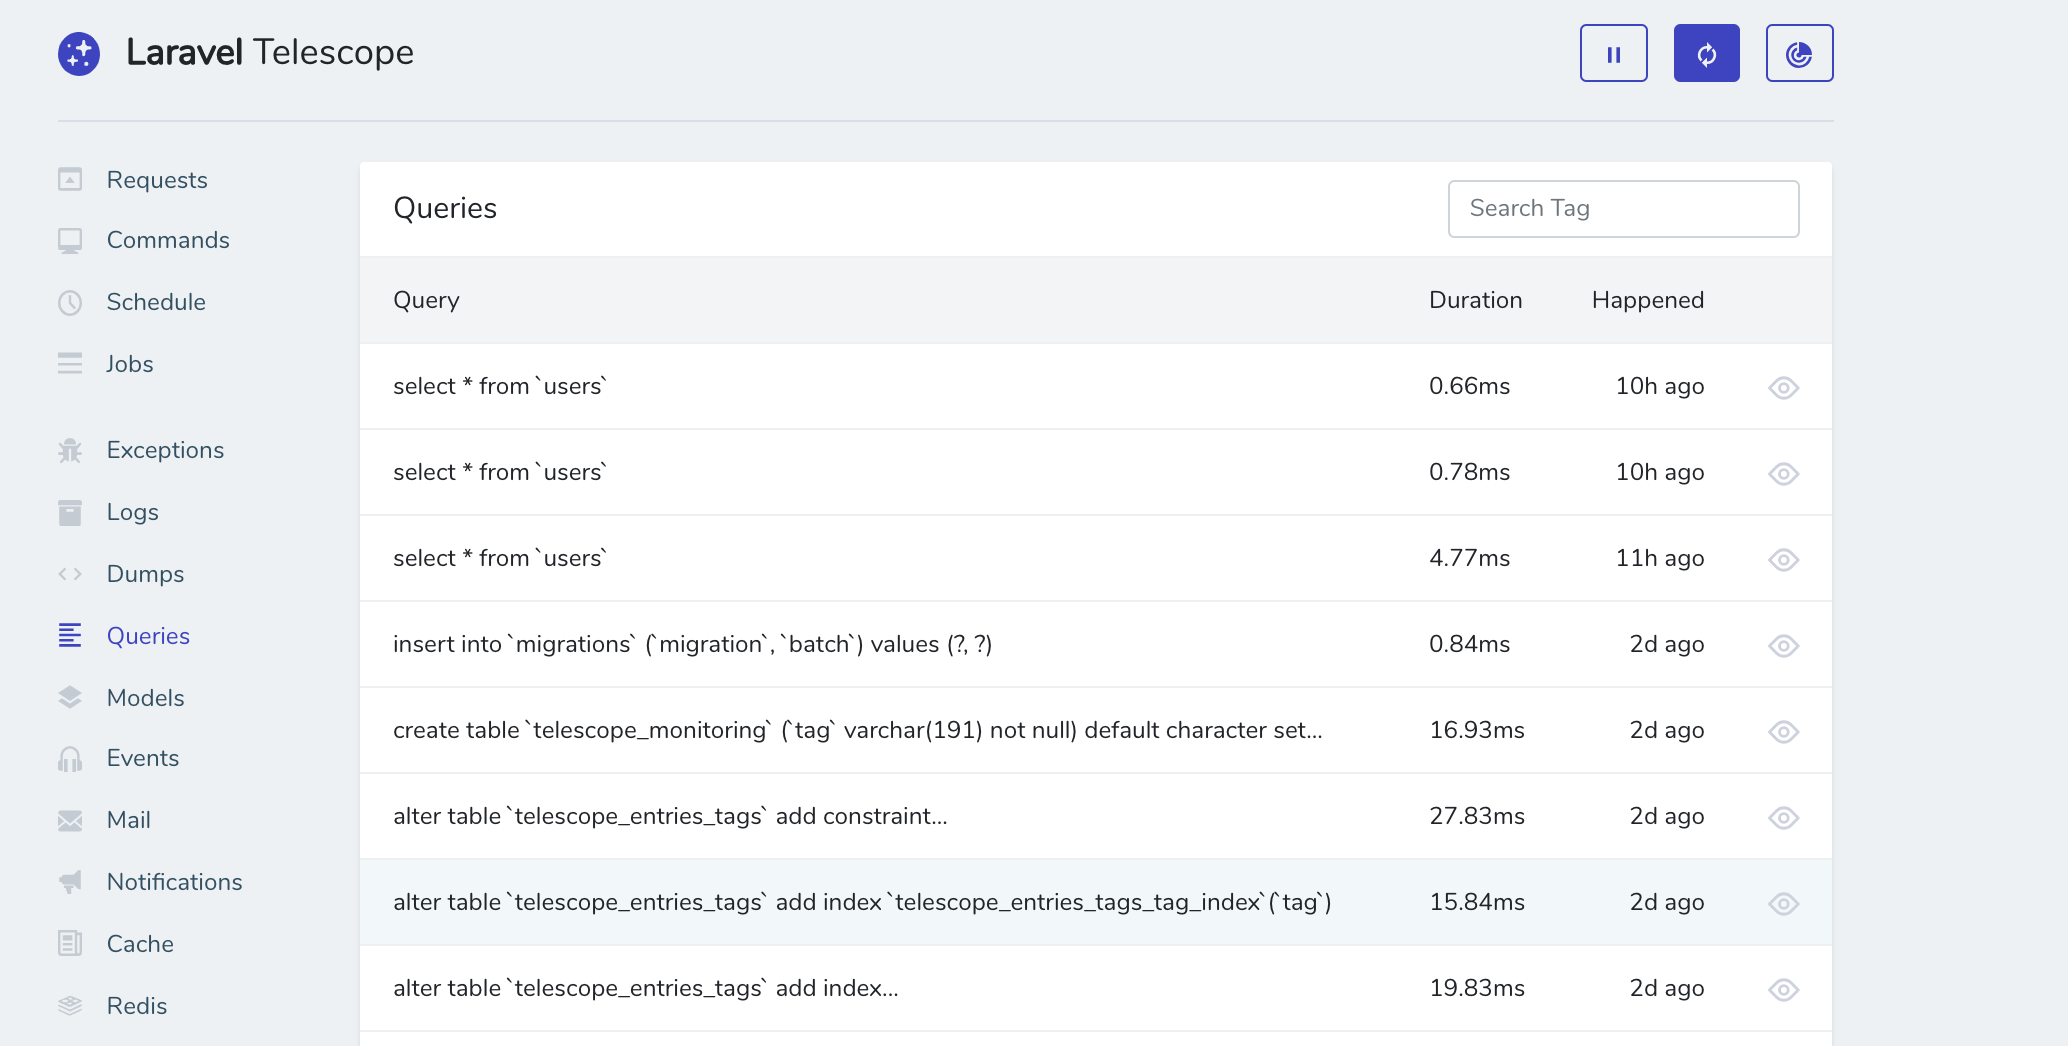
The queries page works a lot like the Debugbar mentioned above. It lists all of your database queries, how long they took, on which requests etc. You can easily use this page to set a benchmark for which of your queries are considered slow once then take longer than a specific time. You can also set this in config/telescope.php. In the image attached below, I can see that select * from ‘users’ query was run three times and had a different duration each time.
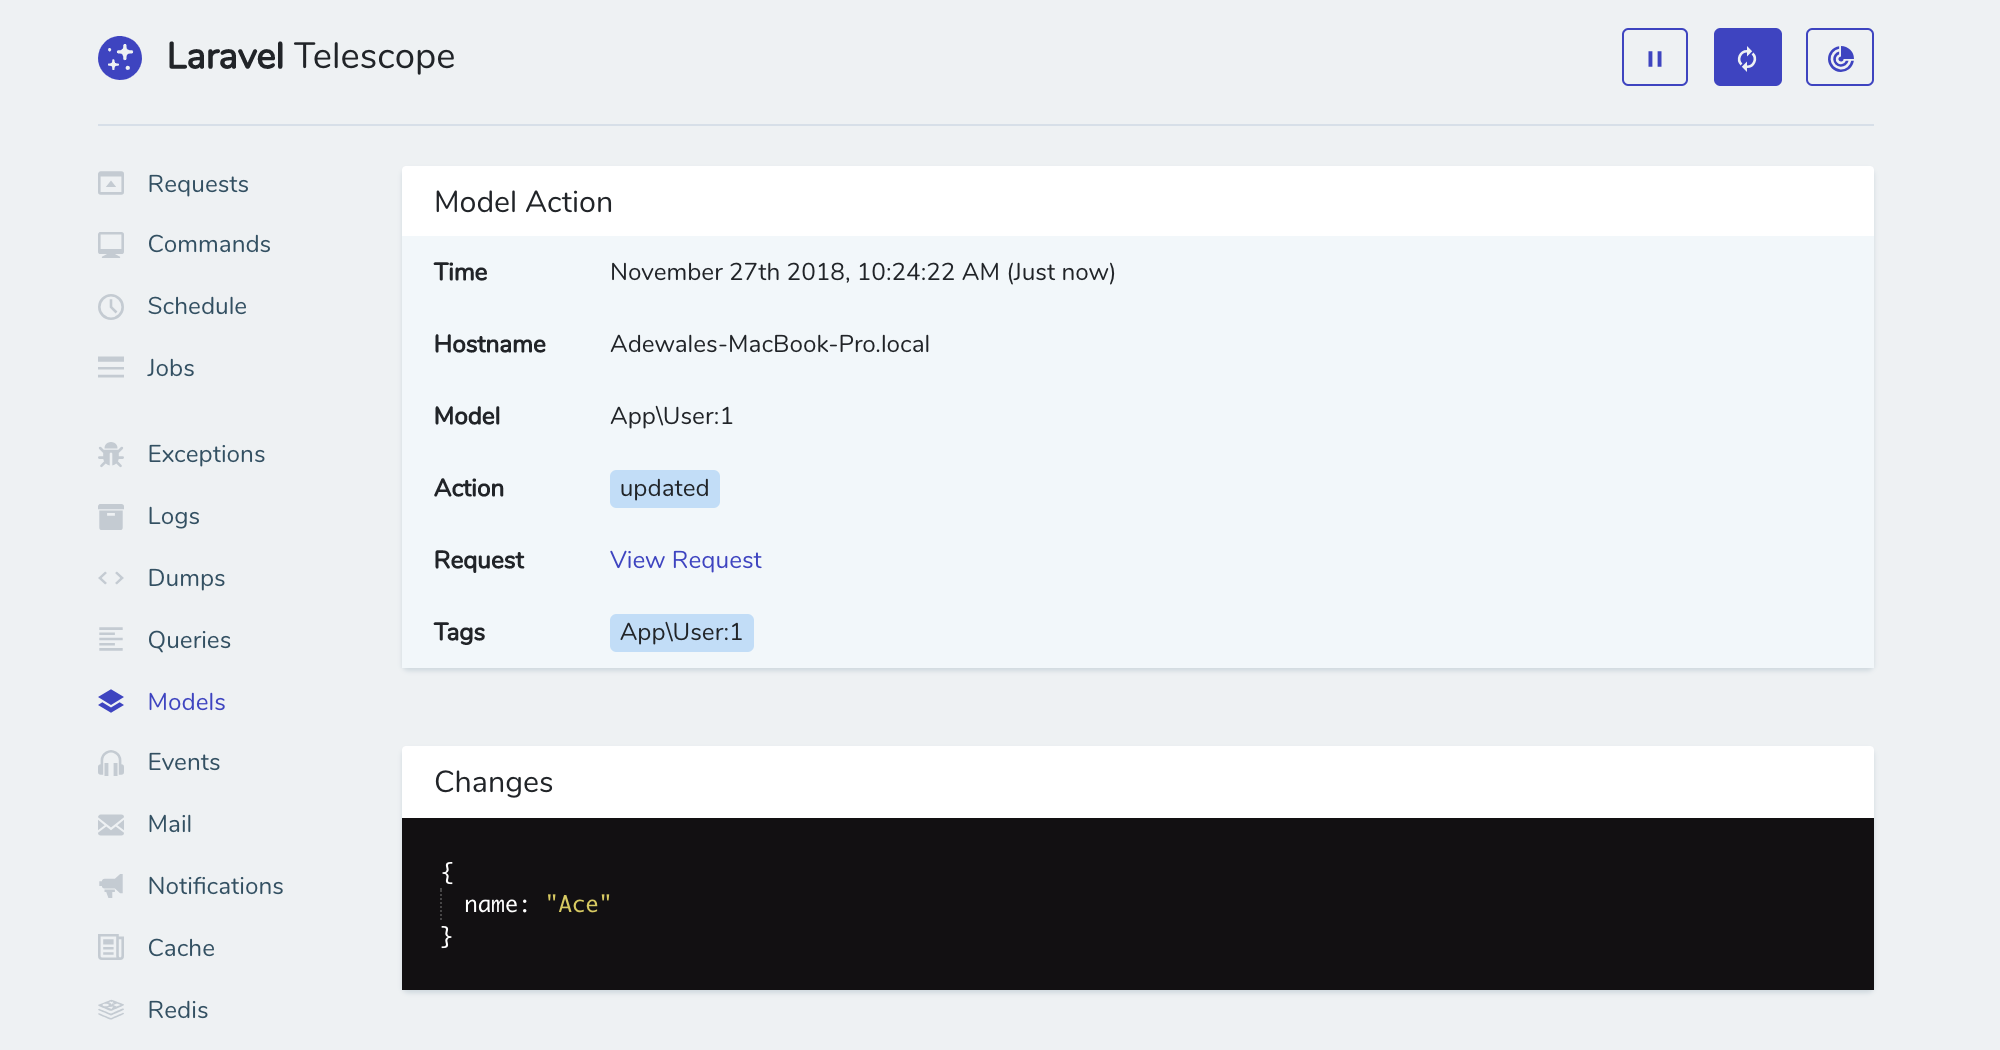
The Models page tracks all of the activities that go on with your models. The User model comes by default with Laravel. So as an example, every action taken on the User model will show up on this page. From when you create a new user or even update the user profile, it all shows up.

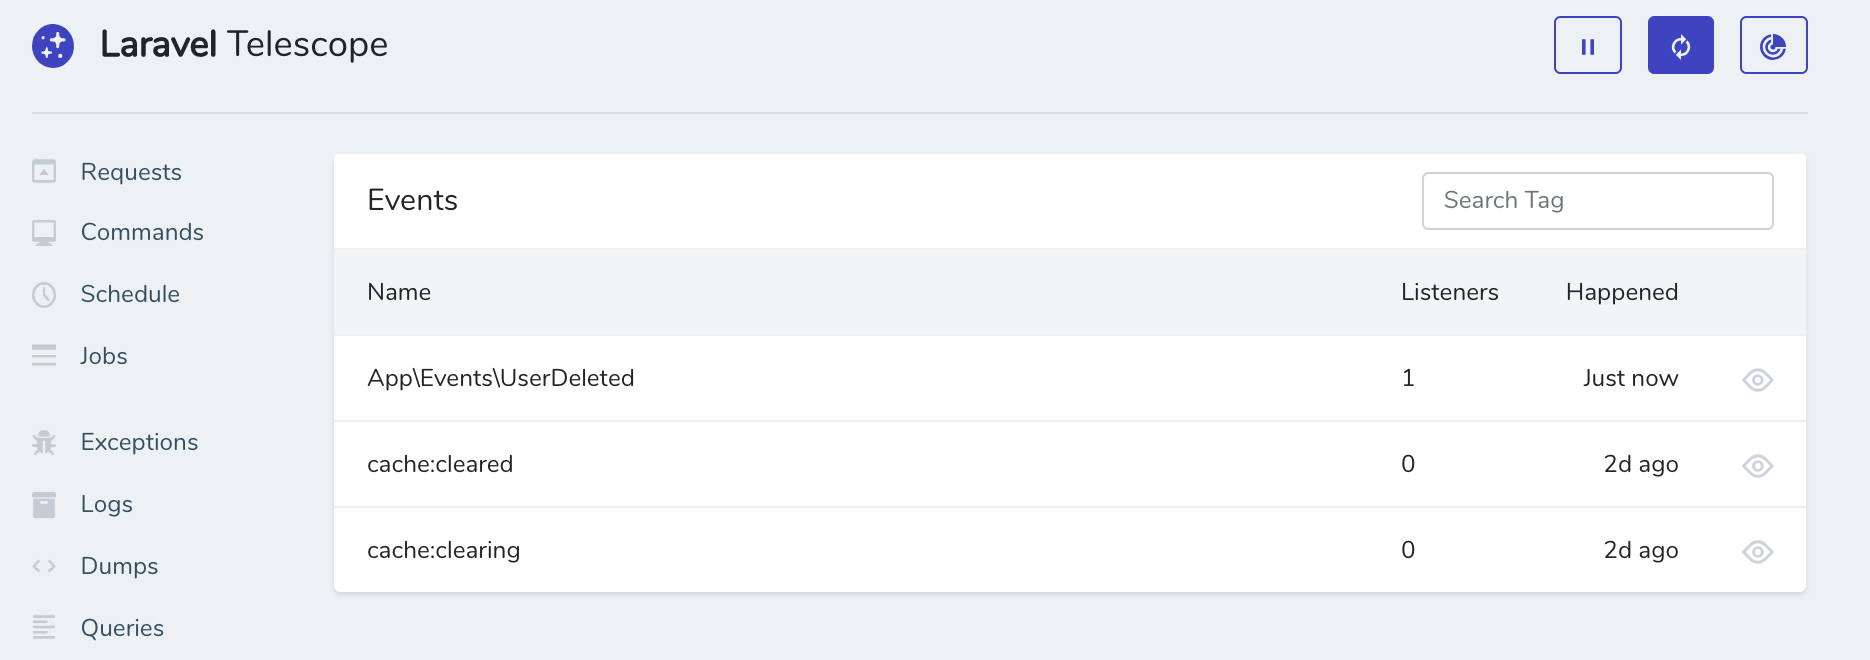
The events page shows a list of all of your events with additional information to go with it. Including the time, listeners and which events were broadcasted with a tag.
The mail page also shows a list of all the emails sent, who it was sent to, the time it was sent, the subject and even the preview of the email.
The notifications page shows a list of notifications, the channels they were created on, the time and who was the recipient of the notification.
The cache page shows a list of cache hits, misses, updates etc. You can see the request that triggered it and much more.
The redis page is also quite similar to the cache page. It shows you how long it took, when it happened and the request that triggered it.
Telescope publishes a config file located at config/telescope.php that you can use to configure the various watcher options and path. Each of these configurations come with a description of its purpose making it easy to understand what it’s meant to do.
As mentioned above, Telescope opens on /telescope by default in your application but you can change it to whatever suits you.
Telescope also allows you to specify who can access it in production, this is done by specifying a list of emails in the telescope service provider.
// app/Providers/TelescopeServiceProvider.php
...
/**
* Register the Telescope gate.
*
* This gate determines who can access Telescope in non-local environments.
*
* @return void
*/
protected function gate() {
    Gate::define('viewTelescope', function ($user) {
        return in_array($user->email, [
            //
        ]);
    });
}Yes, you can use Telescope in production. It has built-in authorization tools for protecting private data and you can even change the path as mentioned above to something else. For other protection techniques, you can filter out what data is monitored or stored, schedule jobs that delete old entries and also choose which of the watchers you want enabled or disabled.
Telescope gives us great insight and overview of what goes on in Laravel applications and you should definitely start using it for all of your projects.
Install LogRocket via npm or script tag. LogRocket.init() must be called client-side, not
server-side
$ npm i --save logrocket

// Code:

import LogRocket from 'logrocket';
LogRocket.init('app/id');
// Add to your HTML:

<script src="https://cdn.lr-ingest.com/LogRocket.min.js"></script>
<script>window.LogRocket && window.LogRocket.init('app/id');</script>
Hey there, want to help make our blog better?
Join LogRocket’s Content Advisory Board. You’ll help inform the type of content we create and get access to exclusive meetups, social accreditation, and swag.
Sign up now
Making carousels can be time-consuming, but it doesn’t have to be. Learn how to use React Snap Carousel to simplify the process.

Consider using a React form library to mitigate the challenges of building and managing forms and surveys.

In this article, you’ll learn how to set up Hoppscotch and which APIs to test it with. Then we’ll discuss alternatives: OpenAPI DevTools and Postman.

Learn to migrate from react-native-camera to VisionCamera, manage permissions, optimize performance, and implement advanced features.