Editor’s note: This article was last updated 14 December 2022 to reflect changes made in D3.js v7.

React and D3.js are both JavaScript libraries that enable developers to create engaging, reusable data visualizations like area charts, line graphs, bubble plots, and more.
Although React and D3 is an extremely popular pairing among frontend developers, the two libraries can be challenging to use in tandem. In this article, we’ll cover how to use D3 in React, discuss why you should use D3, and demonstrate how to create a chart in React with D3.
We’ll cover the following in detail:
D3.js is a JavaScript library for creating dynamic, interactive data visualizations using HTML, CSS, and SVG. D3 binds data to the DOM and its elements, enabling you to manipulate visualizations by changing the data. At the time of writing, the most recent release is D3.js v7.7.
While D3’s focus on web standards enables you to harness the full capabilities of modern browsers without restricting yourself to a proprietary framework, D3.js and React are commonly used together to bring dynamic data visualizations to life.
React is an open source, frontend JavaScript library for building intricate user interfaces and UI components. It is a declarative, efficient, and flexible framework that allows you to build complex UIs composed of simple, reusable components. These components are capable of maintaining their state by themselves.
For a visual guide to help you get started with React and D3.js, check out the video tutorial below:
Data visualization in React using React D3
Curious about data visualization in React? Check out this tutorial to learn about data visualization in React using React D3. Getting started with React – 00:34 Introduction to D3.js – 01:12 Selectors in D3.js – 01:41 D3.js selectors demo – 03:28 Plotting the chart – 05:24 Charting demo – 06:59 Modularizing component – 08:21 Try LogRocket for free: https://logrocket.com/?yt25 LogRocket is a frontend application monitoring solution that lets you replay problems as if they happened in your own browser.
Data visualization helps you communicate information clearly and efficiently using shapes, lines, and colors. There are many data visualization tools available on the web, but D3.js has won the confidence of countless frontend developers, making it the de facto choice for data visualization in JavaScript.
D3.js is lightning-fast and supports large datasets and dynamic behaviors, enabling you to foster user interaction using animations and other eye-catching features.
D3.js and React can be challenging to use together because both libraries want to handle the DOM. They both take control of UI elements, and they do so in different ways.
In this article, we’ll learn how to get the most out of React and D3’s distinct advantages by building a simple bar chart using the two libraries. First, we’ll need to install React and D3. You can find the full code for the completed app on GitHub.
To set up React, we’ll use the Create React App boilerplate. Run the following code to install it globally on your local machine so that it can be reused:
npm install -g create-react-app
Next, we’ll create a new app using the create-react-app template. Be sure to use the latest version of React, which is version 18 at the time of writing. Feel free to change react-d3 to a different name for your project directory:
create-react-app react-d3
Change the directory in the newly created project:
cd react-d3
You can add the D3.js library to your app using either the CDN or by installing it via npm, as shown below. As expected, this will install the latest stable version of D3.js, which is v7.7 at the time of writing:
npm install d3
Now, we can begin using D3 to create data visualizations in React. To preview the app that was just created on your default browser, run the code below:
npm start
The command above will also enable the hot reload of the web app, which will really be helpful when fiddling with the code.
Open the newly created project with your favorite text editor and navigate to src/App.js, which is the component that is currently rendered in the browser. We need to remove the content that is returned by the App() method, which is the main entry point for your web app, so that we can replace it with our own content.
For now, let’s add the following code:
import BarChart from './BarChart'

const App = () => {
    return ( <BarChart /> )
}
export default App;
The <BarChart> tag is the component that will collect our bar chart graph, and BartChart.js is where the bar chart will be rendered. In the src folder, create a new JavaScript file called BarChart.js.
To start, add the following code to the BarChart.js file:
import React, {Component} from 'react';
import * as d3 from "d3";

class BarChart extends Component {

}

export default BarChart;
To display the bar chart when the BarChart component is mounted in the DOM, we’ll use the ComponentDidMount lifecycle method.
Next, add the following code to the BarChart component:
class BarChart extends Component {

  componentDidMount() {
    this.drawChart();
  }
}
drawChart is the method where we’ll perform all of our D3.js magic. Normally, when using D3.js without React, you don’t have to put your D3.js code in a method, but in React, this step is important, ensuring that the chart displays only when the component has been mounted on the DOM.
Next, we’ll create the drawChart method as follows:
drawChart() {

  const data = [12, 5, 6, 6, 9, 10];

  const svg = d3.select("body").append("svg").attr("width", 700).attr("height", 300);

}
First, we define the data variable, which contains the data we want to visualize. Next, we define an SVG using D3.js methods. We’re using SVG because it’s scalable, meaning no matter how large the screen is or how much you zoom in to view the data, it will never appear pixelated.
We use d3.select() to select an HTML element from the document. It selects the first element that matches the argument passed and creates a node for it. In this case, we passed the body element, which we’ll change later to make the component more reusable.
The append() method appends an HTML node to the selected item and returns a handle to that node. We use the attr method to add attributes to the element, which can be any attribute you would normally add to the HTML element, like class, height, width, or fill.
We then append an SVG element to the body element with width: 700 and height: 300. Under the SVG variable we created, add the following code:
svg.selectAll("rect").data(data).enter().append("rect")
Just like the select method, selectAll() selects the element that matches the argument that is passed to it. Therefore, all elements that match the arguments are selected, not just the first.
Next, we use the data() method to attach the data passed as an argument to the selected HTML elements. Usually, these elements are not found because most visualizations deal with dynamic data, and it is nearly impossible to estimate the amount of data that will be represented.
The enter() method rescues us from that bottleneck since it is used alongside the append method to create the nodes that are missing and still visualize the data.
So far, we’ve created nodes for each data point in the array. All that’s left is to make it visible. For this, we need to create a bar for each point in the data array, set the width, and update the height of each bar dynamically.
The attr method allows us to use a callback function to deal with the dynamic data:
selection.attr("property", (d, i) => {})
In the line above, d represents the data point value, and i is the index of the data point of the array.
First, we need to set each data point at a specific point on the x and y-axes of the bar chart. We use the x and y attributes to achieve this, where x represents the position of the bar along the x-axis and y represents the position of the bar along the y-axis.
We also need to set the width and height of each data point. The width of each data point is constant since the bars would be of the same width. The height, on the other hand, depends on the value of each data point. To make the bar chart display the value of each data point, we have to use the callback function.
We’ll modify our SVG variable to the following:
svg.selectAll("rect")
  .data(data)
  .enter()
  .append("rect")
  .attr("x", (d, i) => i * 70)
  .attr("y", 0)
  .attr("width", 65)
  .attr("height", (d, i) => d)
  .attr("fill", "green");
For x, each index of the data point in the array is multiplied by a constant integer, 70, to shift the position of each bar by 70, while y has a constant value, which we’ll change later.
The width also has a constant value of 65, which is less than the position of each element on the chart, creating a space between each element. The height of the bar depends on the value of each entry in the data set.
Now, we’ve created a bar chart. However, we have two issues. For one, the bars in the chart are small, and the chart is also inverted.
To resolve these issues, we’ll multiply each datum by a constant value of, say, 10 to increase the size of each bar without affecting the data:
.attr("height", (d, i) => d * 10)

Next, we’ll need to solve the issue of the bar being inverted. But before that, let’s understand why the chart is inverted in the first place.
The SVG position goes from top to bottom, so using a y attribute of 0 puts each bar at the top edge of the SVG element.
To fix this, subtract the height of each bar from the height of the SVG element. Please note that 10 * d is the height we got from our previous calculation:
.attr("y", (d, i) => 300 - 10 * d)
Putting it all together, the BarChart component will be as follows:
import React, { Component } from 'react'
import * as d3 from 'd3'

class BarChart extends Component {
    componentDidMount() {
        this.drawChart();
    }
    drawChart() {
        const data = [12, 5, 6, 6, 9, 10];

        const svg = d3.select("body")
                    .append("svg")
                    .attr("width", 700)
                    .attr("height", 300);

        svg.selectAll("rect")
            .data(data)
            .enter()
            .append("rect")
            .attr("x", (d, i) => i * 70)
            .attr("y", (d, i) => 300 - 10 * d)
            .attr("width", 65)
            .attr("height", (d, i) => d * 10)
            .attr("fill", "green");
    }
    render() {
        return <div id={"#" + this.props.id}></div>
    }
}
export default BarChart;

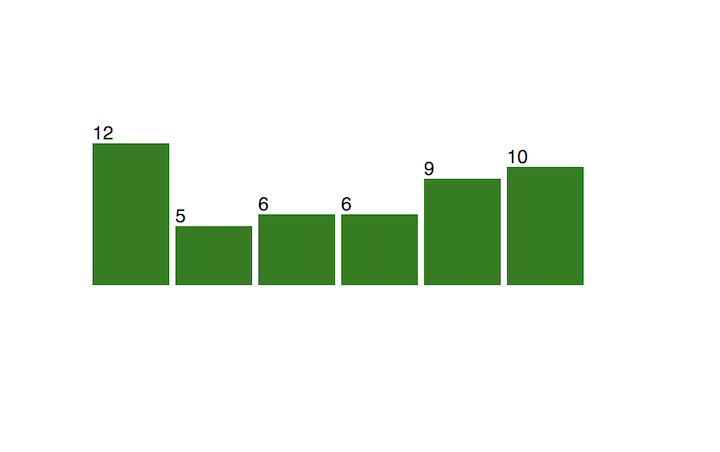
Now, we have a basic bar chart. Let’s go a little further and add some labels.
To add labels, add the following code to the drawChart function:
        svg.selectAll("text")
            .data(data)
            .enter()
            .append("text")
            .text((d) => d)
            .attr("x", (d, i) => i * 70)
            .attr("y", (d, i) => 300 - (10 * d) - 3)
This is similar to what we did for the bars, but this time, text is appended instead. The bar chart should now look like the following:
One of the most important principles of React is to make components that are reusable. To do so, we need to make the BarChart component independent from the data and make it a parameter. In doing so, we’ll also get rid of all the dependencies from constants, like the height of the graph and its width. For this, we’ll use the props mechanism.
Now, we’ll modify App.js to pass parameters to the BarChart component:
import BarChart from './BarChart'

const App = () => {
    return (<BarChart
        data={[12, 5, 6, 6, 9, 10]}
        width={700}
        height={300}/>)
}
export default App;
Coherently, we modify how the BarChart component uses them. They will be available in the props object in the BarChart.js source file:
const data = this.props.data;
The width and height attribute change from the code block below to the following, respectively:
const svg = d3.select("body").append("svg").attr("width", 700).attr("height", 300);


const svg = d3.select("body").append("svg")
  .attr("width", this.props.width)
  .attr("height", this.props.height);
This way, we can reuse the bar chart anywhere we want in our React app.
In this article, we explored creating a simple bar chart using D3.js and React. We then went a step further to customize our bar chart with labels. We learned how to solve some issues that may arise when pairing D3.js and React, like spacing issues and chart inversion.
Although D3.js and React are both popular libraries that work well together, pairing them can be tricky. Hopefully, this article will serve as a guide to help you get started. I hope you enjoyed this article, and be sure to leave a comment if you have any questions. Happy coding!
Install LogRocket via npm or script tag. LogRocket.init() must be called client-side, not
server-side
$ npm i --save logrocket

// Code:

import LogRocket from 'logrocket';
LogRocket.init('app/id');
// Add to your HTML:

<script src="https://cdn.lr-ingest.com/LogRocket.min.js"></script>
<script>window.LogRocket && window.LogRocket.init('app/id');</script>

Learn how to set up Meilisearch, index documents, and build keyword, semantic, and hybrid search with AI-powered retrieval.
Compare pnpm and npm across security defaults, disk usage, dependency strictness, and workspace policy to decide which package manager fits your project.

I migrated 20 production-style components from Tailwind to StyleX. Here’s what the data showed about LOC, CSS bundle size, build time, and type safety.

A guide for using JWT authentication to prevent basic security issues while understanding the shortcomings of JWTs.
Would you be interested in joining LogRocket's developer community?
Join LogRocket’s Content Advisory Board. You’ll help inform the type of content we create and get access to exclusive meetups, social accreditation, and swag.
Sign up now