
A Gantt chart is a popular and invaluable project management tool that has been in use since the 1900s. A Gantt chart is a specialized type of bar chart that is used to visualize the timeline of a project by representing each of the tasks comprising the project as a horizontal bar, the length of which is proportional to the allotted time for that task.
A Gantt chart also shows the relationships between the tasks in a project. Tasks further down the project timeline are always to the right of tasks earlier in the timeline, and tasks that depend on a previous task are connected to that task with arrows.
According to Wikipedia, the Gantt chart as we know it was created and popularized by Henry Gantt during the years 1910 to 1915. He initially designed this tool to help measure the productivity levels of his employees, but as time passed, the Gantt chart became more and more widespread across many industries. The Gantt chart was even used in World War I!
In this article, we’ll guide you through the process of building a Gantt chart for your web application using a JavaScript library called Frappe Gantt.
To follow along with this tutorial, you’ll need the following:
The Replay is a weekly newsletter for dev and engineering leaders.
Delivered once a week, it's your curated guide to the most important conversations around frontend dev, emerging AI tools, and the state of modern software.
Frappe Gantt is a free, open source JavaScript library created and maintained by the Frappe team. Frappe Gantt makes it extremely easy for you to build interactive, easily customizable Gantt charts with JavaScript.
Frappe Gantt offers the following features for Gantt charts:
In this tutorial, you’ll build a Gantt chart to manage the development of a website. We’ll follow the steps in the order below:
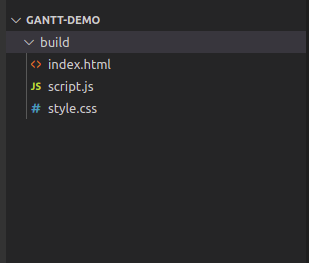
Let’s create the structure for our project and install Frappe Gantt. Start by creating a directory for the project and call it gantt-demo. Inside gantt-demo, create a folder called build. Create three files inside build, index.html, style.css, and script.js.
Your file structure should look like the following:
Next, we’ll write some foundational markup for our Gantt chart. Paste the following code in build/index.html:
<!DOCTYPE html>
<html lang="en">
<head>
    <meta charset="UTF-8">
    <meta http-equiv="X-UA-Compatible" content="IE=edge">
    <meta name="viewport" content="width=device-width, initial-scale=1.0">
    <link rel="stylesheet" href="style.css">
    <title>Gantt</title>
</head>
<body>
    <div>
        <svg id="gantt">
        </svg>
    </div>

    <script src="script.js"></script>
</body>
</html>
There are a couple of ways that you can include Frappe Gantt in your project. For one, you can use the library from CDN, or you can install it locally with npm. Installing it with npm is recommended, so we’ll use that approach.
Open your terminal and navigate to the gantt-demo directory, then run the following command:
npm install frappe-gantt
The code above will create a folder called node_modules inside of gantt-demo, containing a sub-folder called frappe-gantt. The structure of your node_modules folder should look like the following:
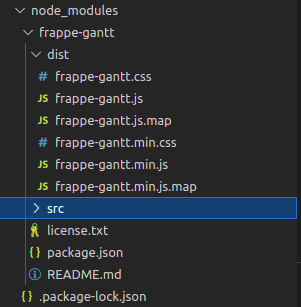
Copy the dist folder from node_modules/frappe-gantt and paste it into build. After that, add the following code to the head of your build/index.html file:
<script src="dist/frappe-gantt.min.js"></script> <link rel="stylesheet" href="dist/frappe-gantt.min.css">
If you’re using Frappe Gantt in a project that already has a bundler set up, like a Vue or React project, you don’t need to copy the dist folder. Simply go to the JavaScript file you want to use Frappe Gantt in and add the following code to your import statements:
import Gantt from 'frappe-gantt'
Now that our setup is complete, our next job is to create the chart with an initial set of tasks. Since the chart is for a website development project, you’ll be creating the chart with these tasks:
The website design task depends on the wireframe task, the frontend task depends on the visual design task, and the deploy task depends on both the frontend task and the backend task. Let’s assume that the hosting and wireframe tasks have been completed already.
How are you going to represent these tasks as the bars of a chart? In Frappe Gantt, tasks are represented by JavaScript objects with the following structure:
 {
    id: '', // a string that represents the id of a task
    name: '',// the label the task will have on the chart
    start: '',// the start date of the task in year-month-day-time format. The time is optional, but should be specified in 24-hour format if provided
    end: '',// the end date of the task
    progress: 50,// optional property, the percentage completion of the task
    dependencies: 'Task a, Task b',//optional, comma-separated ids of the task(s) this task depends on
    custom_class: 'special-task' // optional property to control the appearance of the task with a CSS class
}
To add your tasks to a Gantt chart, you’ll create an object like this for each task, then put all the tasks in an array. Copy the following code into your build/script.js:
let tasks = [
    {
        id: 'Task 1',
        name: 'Buy hosting',
        start: '2022-01-22',
        end: '2022-01-23',
        progress: 100,
    },
    {
        id: 'Task 2',
        name: 'Draw wireframes',
        start: '2022-01-23',
        end: '2022-01-25',
        progress: 100,
    },
    {
        id: 'Task 3',
        name: 'Visual Design',
        start: '2022-01-25',
        end: '2022-01-27',
        progress: 20,
        dependencies: 'Task 2'
    },
    {
        id: 'Task 4',
        name: 'Build frontend',
        start: '2022-02-01',
        end: '2022-02-03',
        progress: 0,
        dependencies: 'Task 3'
    },
    {
        id: 'Task 5',
        name: 'Build backend',
        start: '2022-02-03',
        end: '2022-02-07',
        progress: 0,
    },
    {
        id: 'Task 6',
        name: 'Deploy Website',
        start: '2022-02-07',
        end: '2022-02-09',
        progress: 0,
        dependencies: 'Task 4, Task 5'
    },
]
Then, to render the chart, add the following JavaScript code to your script.js:
let ganttChart = new Gantt("#gantt", tasks, {});
The code above uses the Gantt constructor to create a Gantt chart from your list of tasks. The first argument to the Gantt constructor is either a string CSS selector that describes an element in the DOM or a direct JavaScript reference to a HTML element. The second argument is the array of task objects.
The last argument to the constructor is an options object that allows you to further customize your chart. You’ll fill it out later in this tutorial, but leave it empty for now.
Next, add some styling to your chart by pasting the following code in your build/style.css file:
.gantt-container {
    width: 90vw;
    margin: 0 auto;
}
At this point, if you open the build/index.html file in your browser, your webpage should look like the following image:

Next, we’ll implement the ability for the user to change the time scale of the chart. The time scale of the chart is the unit of time the chart uses to display your tasks.
By default, the time on your chart is measured in days, but Frappe Gantt allows you to change that. Frappe Gantt provides Quarter day, Half day, Day, Week, and Month as unit of time options for your charts.
Let’s implement the ability for our chart to show time in weeks and months as well as days. To build some buttons for your chart, start by adding the following markup to your index.html file just before the script in your body tag:
<div class="chart-controls">
    <p>Change Chart Timescale</p>
    <div class="button-cont">
        <button id="day-btn">
            Day
        </button>

        <button id="week-btn">
            Week
        </button>

        <button id="month-btn">
            Month
        </button>
    </div>
</div>
Next, style this markup by adding the following code to your style.css file:
.chart-controls {
    text-align: center;
}
.chart-controls > p {
    font-size: 1.2rem;
    font-weight: 500;
}
Finally, add the following JavaScript code to the end of your script.js file:
document.querySelector(".chart-controls #day-btn").addEventListener("click", () => {
    ganttChart.change_view_mode("Day");
})
document.querySelector(".chart-controls #week-btn").addEventListener("click", () => {
    ganttChart.change_view_mode("Week");
})
document.querySelector(".chart-controls #month-btn").addEventListener("click", () => {
    ganttChart.change_view_mode("Month");
})
The JavaScript code above creates click event listeners for each of the buttons in your markup, then calls the change_view_mode() method with the desired unit of time as an argument to change the timescale of your Gantt chart.
Frappe Gantt allows you to specify code to run when a user performs certain actions on your chart.
Frappe Gantt provides four event listeners. The on_click listener accepts a function that is executed when a user double clicks on a task in the chart, and the function passed to it receives a task option as an argument. The on_date_change listener accepts a function that is run when the date of a chart is changed. The function passed to it receives the task object, and the new start and end dates of the task.
The on_progress_change listener accepts a function that is run when the progress of a task on the chart is changed. The accepted function receives a task object and the new progress value as arguments. The on_view_change listener accepts a function that is run when the timescale of the chart is changed. The accepted function receives a task object and the new progress value as arguments.
In this tutorial, you’ll use the on_view_change listener to create a dynamic label that shows the current timescale of your Gantt chart. Start by adding the markup to your index.html above the div that contains your SVG:
<p class="chart-label">
        Timescale: <span id="current-timescale">Day</span>
</p>
Add the following styling to your style.css:
.chart-label {
    font-size: 1.5rem;
    text-align: center;
    font-weight: 500;
}
Now, we’ll make the label dynamic. Add an event listener to your constructor by passing it as a property of the third argument as follows:
let ganttChart = new Gantt("#gantt", tasks, {
    on_view_change: function(mode) {
        document.getElementById("current-timescale").innerText = mode;
    },
});
The chart timescale label is now fully dynamic.
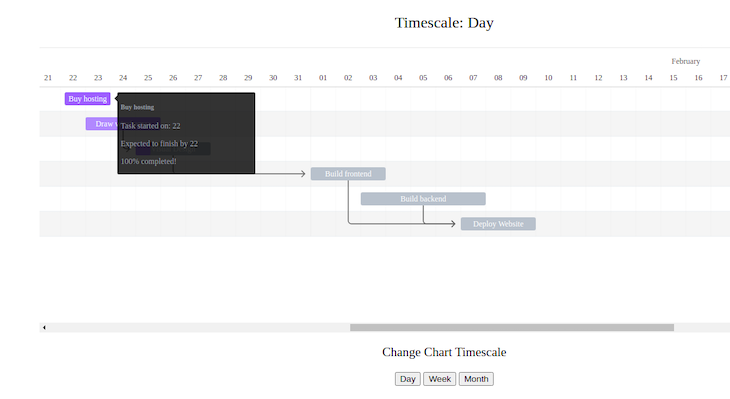
With Frappe Gantt, you can determine the contents of the popup that appears when your user clicks on a task in your chart by returning custom HTML for each task.
First, you’ll provide a property to the third argument to your constructor, called custom_popup_html. The value of this property is a function that accepts a task object as an argument.
Add the following JavaScript code inside the third argument to your constructor:
custom_popup_html: function(task) {
        return `
          <div class="details-container">
            <h5>${task.name}</h5>
            <p>Task started on: ${task._start.getDate()}</p>
            <p>Expected to finish by ${task._start.getDate()}</p>
            <p>${task.progress}% completed!</p>
          </div>
        `;
}
Next, add the following styling to your styles.css file:
gantt-container .popup-wrapper {
    width: 200px;
    padding: 0 5px;
}
Each task should now have a custom popup that should looks like the following:
Frappe Gantt allows you to change the look of the task bars on the chart. The library allows you to tweak two aspects: the color of the bars, and the height of the bars.
To change the color of the bars, you have two options, depending on whether you’re changing the color of all the bars or only a few of them. Both options involve you writing custom CSS to overwrite the default styling.
The Gantt chart Frappe Gantt constructs is an SVG, so changing the color involves changing the fill and stroke properties of the bars, and not color or background-color as you might expect. To change the color of all the bars, you need to overwrite the following CSS classes:
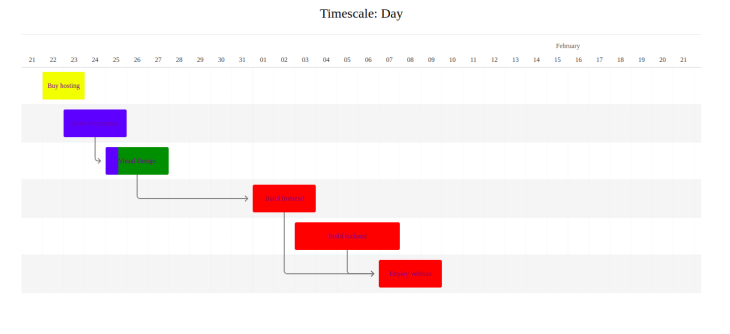
.bar for the background color of each bar.bar-progress for the progress indicator of the bars.bar-label for the text labels of the tasksHere’s an example. Add the following code to your style.css file:
.gantt .bar {
    fill: red !important;
}
.gantt .bar-progress {
    fill: yellow !important;
}

.gantt .bar-label {
    fill: rebeccapurple !important;
}
This code will give all your task bars a red background, a yellow progress indicator, and purple text. Here’s what your chart should look like after the change:
If you only want to change the look of some of the bars, you can use the same strategy with a slight modification. You’ll use the custom_class property of each task object (in your JavaScript) to specify a class that should be applied to the task bar, and then style the chart elements based on the custom class.
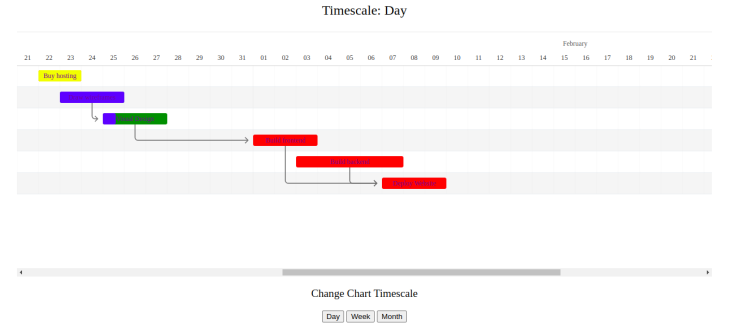
To illustrate, let’s say the second and third tasks are very high priority, and we want those task bars to have green backgrounds instead of red ones, and blue progress bars. Here’s what that code would look like. Add the following to your style.css:
.special .bar {
    fill: green !important;
}
.special .bar-progress {
    fill: blue !important;
}
Now that this is in place, all you have to do is add special as the value of custom_property in the special tasks. Add the following to your script.js file, after you declare the tasks variable:
tasks[1]['custom_class'] = 'special'

tasks[2]['custom_class'] = 'special'
And now, the second and third tasks will have a different look:
The last thing you can tweak about the task bars is their height, and doing so is easy. Frappe Gantt task bars are rect SVG elements, with a default height value of 20, and Frappe Gantt allows you to edit this default by passing an option to the Gantt constructor called bar_height.
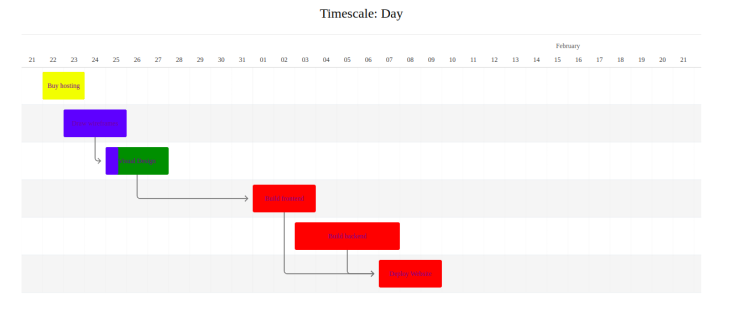
As an example, let’s double the height of our task bars. Add this line inside the third argument to your Gantt constructor (the options object):
bar_height: 40,
Now, each task bar should be noticeably larger:
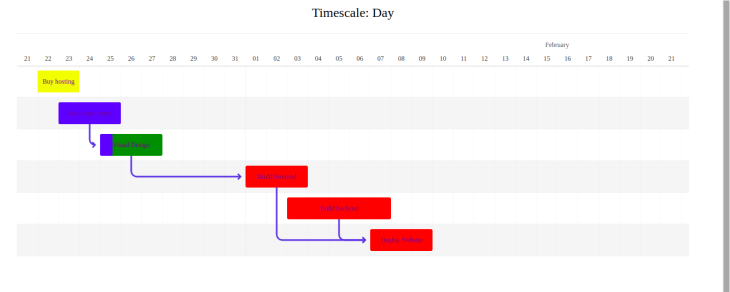
Much like the bars, Frappe Gantt allows you to customize the appearance of the dependency arrows. You do this by overriding CSS classes. Let’s say you wanted the arrows to be blue, and to double in thickness. Here’s the CSS you would write:
.gantt .arrow {
    stroke: royalblue !important;
    stroke-width: 2.8px !important;
}
Frappe Gantt also allows you to adjust how much your arrows should curve by passing a property called arrow_curve to the constructor. The default value of this property is 5. To illustrate, we’ll double it. Add the following to the options object of your Gantt constructor:
arrow_curve: 10,
And your task arrows should now look like this:
Frappe Gantt doesn’t allow you to create new timescales for your chart, but it does let you specify which one the chart should start out with. Once again, the solution is the options object. Let’s assume you wanted to make your chart start off on the week view, instead of the day view. You’d add the following line to the options object:
view_mode: "Week",
And the chart would start off in the week view on page load.
In this article, we covered building a Gantt chart using Frappe Gantt, an interesting, open source library that greatly simplifies generating Gantt charts. A Gantt chart is a great tool for managing teams, and we learned to easily customize ours to best suit our needs.
You can check out a live demo of Frappe Gantt, as well as a collection of useful examples. Thanks for reading!
There’s no doubt that frontends are getting more complex. As you add new JavaScript libraries and other dependencies to your app, you’ll need more visibility to ensure your users don’t run into unknown issues.
LogRocket is a frontend application monitoring solution that lets you replay JavaScript errors as if they happened in your own browser so you can react to bugs more effectively.
LogRocket works perfectly with any app, regardless of framework, and has plugins to log additional context from Redux, Vuex, and @ngrx/store. Instead of guessing why problems happen, you can aggregate and report on what state your application was in when an issue occurred. LogRocket also monitors your app’s performance, reporting metrics like client CPU load, client memory usage, and more.
Build confidently — start monitoring for free.

Learn how LLM routing works in production, when it’s worth the complexity, and how teams choose the right model for each request.

Compare key features of popular meta-frameworks Remix, Next.js, and SvelteKit, from project setup to styling.

Discover what’s new in The Replay, LogRocket’s newsletter for dev and engineering leaders, in the February 4th issue.

AI-first isn’t about tools; it’s about how teams think, build, and decide. Ken Pickering, CTO at Scripta Insights, shares how engineering leaders can adapt.
Hey there, want to help make our blog better?
Join LogRocket’s Content Advisory Board. You’ll help inform the type of content we create and get access to exclusive meetups, social accreditation, and swag.
Sign up now