In this tutorial, we’ll show you how to use React Native Debugger to — you guessed it — debug React Native apps.
You might be wondering, why not use the default React Native debug tool? What makes React Native Debugger unique? Read on to learn the answers to these questions and see how React Native Debugger works.
To start debugging, we need to install React Native Debugger. You can install React Native Debugger from GitHub. Or, if you’re on macOS, you can run this command in your terminal:
brew update && brew install --cask react-native-debugger
After downloading and installing the package, you can start using React Native Debugger.
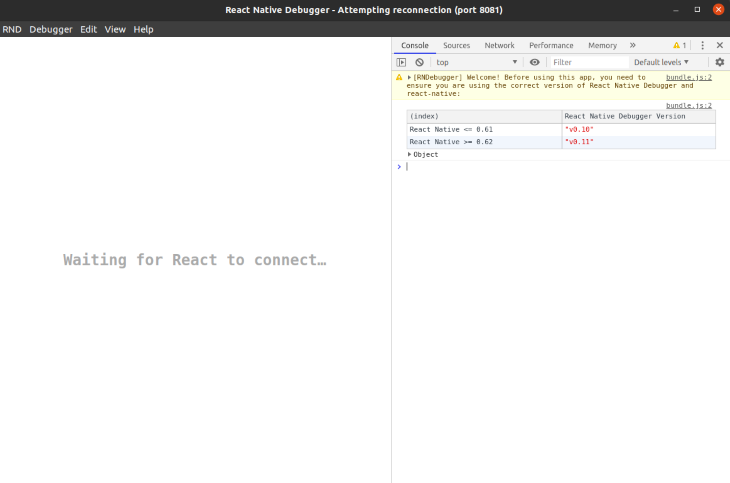
Let’s launch the debugger tool. You can see that React Native Debugger is in waiting state and the debugger tool is listening at port 8081:
To connect your app with React Native Debugger, you need to run your app and start debug mode.
To start debug mode, shake your mobile device or press Command + Shift + Z or Ctrl + M and choose the debug option.
Now you’ll see that your app is connected with the React Native Debugger tool:
We’re all set to begin using React Native Debugger.
What sets React Native Debugger apart is that it combines a wide range of features into a single standalone app. Some of the coolest features include:
Let’s zoom in on each feature in more detail.
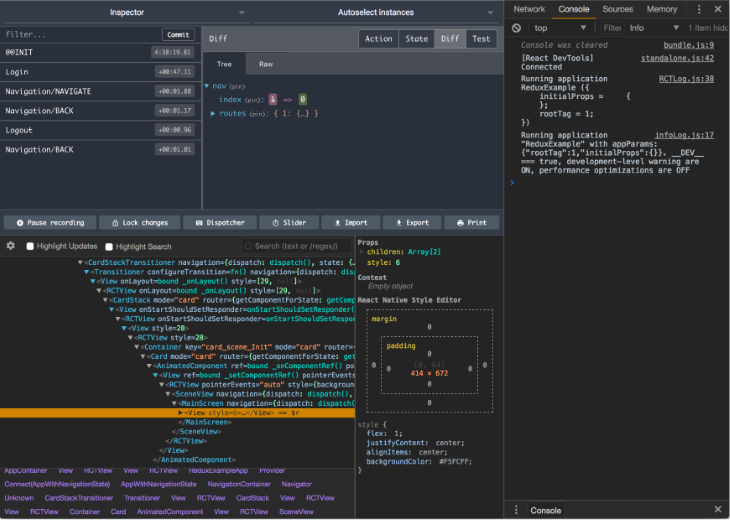
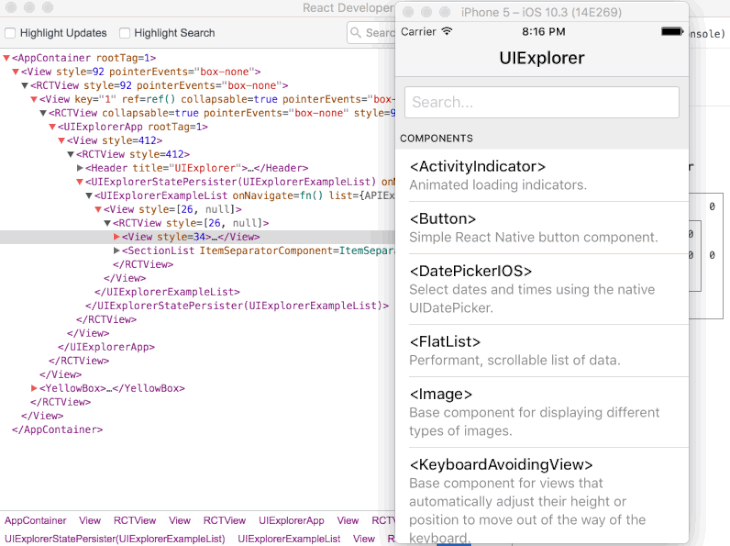
If you’re a web developer, you should be familiar with the element inspector. In React Native Debugger, the UI Inspector works the same way: you can see all the tags you use in your app and check the styling. Even more amazing, you can test your UI and change styling from the inspector.
This makes your UI testing much faster and accelerates the process of building your UI accordingly.
Whether you’re working on a React or React Native app, you’ll eventually need a state management library. Redux is one of the leading state management libraries available.
That said, using Redux can be a pain if you can’t debug your state, especially in React Native. React Native Debugger enables you to easily debug your Redux-based app. You can even debug real time state.
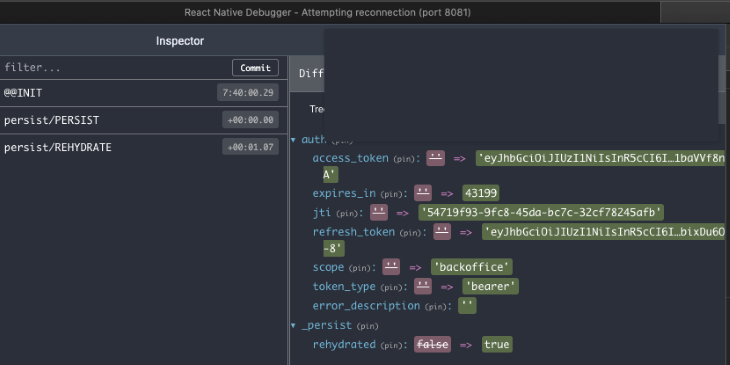
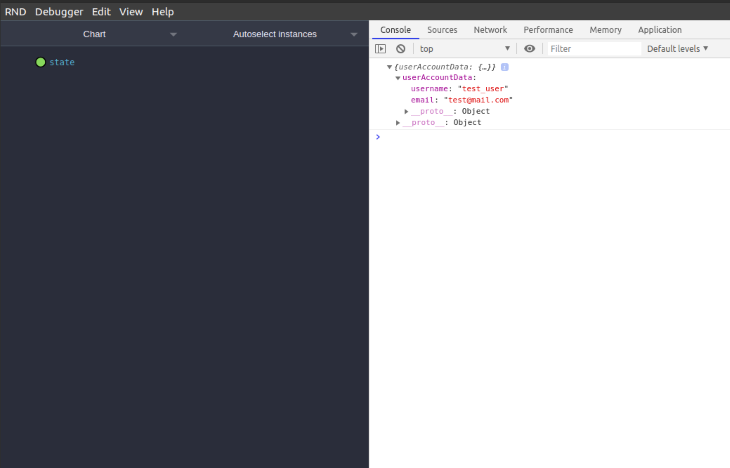
You can use Redux time travel to debug your state over the time. This technique is especially helpful when working on big projects.
To use the Redux dev tool, you need to activate Redux in your app. To do this, you need to add the following code to your App.js. Or, you can add it to main function of Redux.
const composeEnhancers = window.__REDUX_DEVTOOLS_EXTENSION_COMPOSE__;
const store = createStore(reducers, /* preloadedState, */ composeEnhancers(middlewares));
Today, it’s very common for an app to fetch data from the cloud or a server. To perform such a task, we need to connect to the internet or a network.
You may encounter the need to monitor a request. For example, when making an API call, you may need to check whether you’re sending the right API parameters. Or you might want to verify the response from the server.
To debug a request, we can use the network inspector feature in React Native Debugger. Click the Network tab, as shown below:
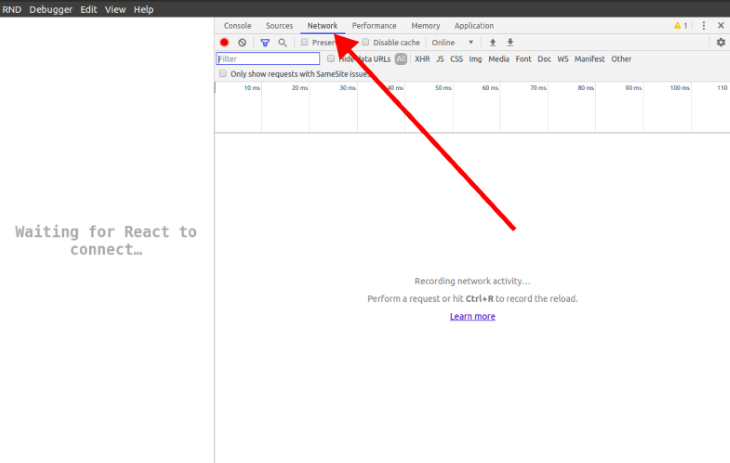
After opening the network inspector, if you make a network request, you can see all the request and their responses in this tab.
AsyncStorage management in React NativeIf you want to print or log your AsyncStorage in the console, you can do so easily with the following command:
console.log(showAsyncStorageContentInDev())
This will print or log the AsyncStorage data in the console on React Native Debugger.
Breakpoints can be very helpful when you need to stop your code execution at a certain time.
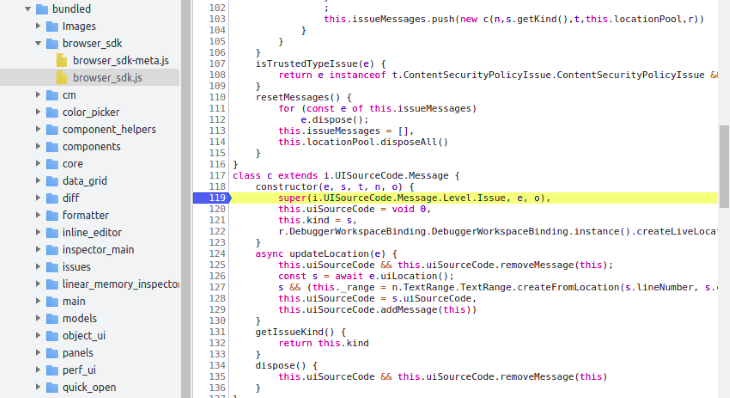
You can also check the code execution flow and see a variable’s value. Put simply, breakpoints help you understand your app’s behavior and spot errors within seconds.
In this tutorial, we covered how to use React Native Debugger to debug React Native apps. We also reviewed some of React Native Debugger’s most important features designed to help accelerate and streamline the development process.
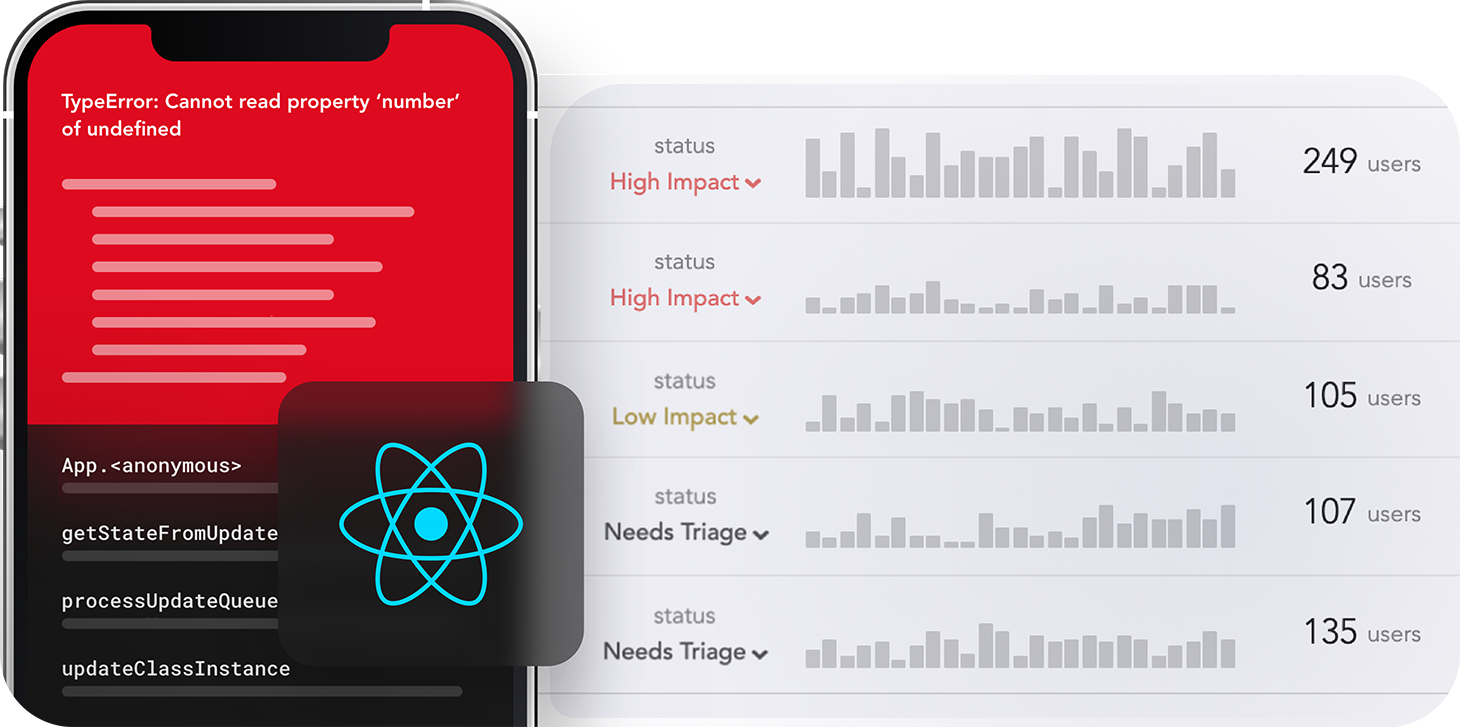
LogRocket's Galileo AI watches sessions for you and and surfaces the technical and usability issues holding back your React Native apps.
LogRocket also helps you increase conversion rates and product usage by showing you exactly how users are interacting with your app. LogRocket's product analytics features surface the reasons why users don't complete a particular flow or don't adopt a new feature.
Start proactively monitoring your React Native apps — try LogRocket for free.
Hey there, want to help make our blog better?
Join LogRocket’s Content Advisory Board. You’ll help inform the type of content we create and get access to exclusive meetups, social accreditation, and swag.
Sign up now
Learn how OpenAPI can automate API client generation to save time, reduce bugs, and streamline how your frontend app talks to backend APIs.

Discover how the Interface Segregation Principle (ISP) keeps your code lean, modular, and maintainable using real-world analogies and practical examples.

<selectedcontent> element improves dropdowns
Learn how to implement an advanced caching layer in a Node.js app using Valkey, a high-performance, Redis-compatible in-memory datastore.


One Reply to "Debugging your app with React Native Debugger"
great tutorial covered all the initial points