React is lightning fast. Often, it’s fast enough to make it hard to re-create performance issues in a sandbox on our machines. Consequently, we might believe that our web app will run smoothly, no matter what we do.

But it’s a trap. Developers usually use strong machines and internet connections to build web apps. However, our high-performance environments might hide from us performance issues that can hurt our users. Unlike developers, many of our users access our web apps using mid-tier mobile smartphones from locations with bad internet connections.
But your app’s speed and performance matter and have a major effect on conversion rates.
If we don’t analyze performance, because of our relatively strong machines and internet connections, we will not know about performance issues that hurt our users and subsequently hurt our conversion rates.
This article will present a sandbox with a performance issue caused by a small React anti-pattern. Then, I’ll show you how it can be detected using the library Why Did You Render and how to resolve the issue.
The Replay is a weekly newsletter for dev and engineering leaders.
Delivered once a week, it's your curated guide to the most important conversations around frontend dev, emerging AI tools, and the state of modern software.
The following app simulates a header that changes its size as the user scrolls. A list with many rows is used to represent a medium-to-large application.
Note: In practice, we would want to make such a long list a virtual list, but in our case, we only use it to simulate an application.
Our app has performance issues with the animation of the header’s height change while scrolling.
Here is the sandbox:
Performance Issue in React
Performance Issue in React by vzaidman using create-react-app, react, react-dom
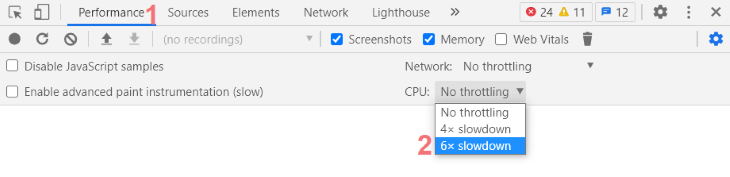
To reproduce the performance issue on powerful machines, I suggest slowing the browser down artificially by throttling the CPU. You can do that in Chrome using the Performance tab.
It’s great practice to use this important tool to run your app this way when working on performance issues to see how things work on slower devices:
Can you detect what causes the performance issue in the code?
The usual way to spot the issue is by using React or Browser dev-tools. Many great articles demonstrate how to debug that in-depth.
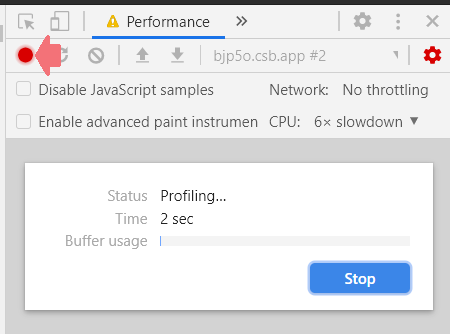
In short, we open the browser dev-tools (in this case, Chrome’s dev-tools, but other modern browsers have similar features) and record a few seconds while reproducing the issue:
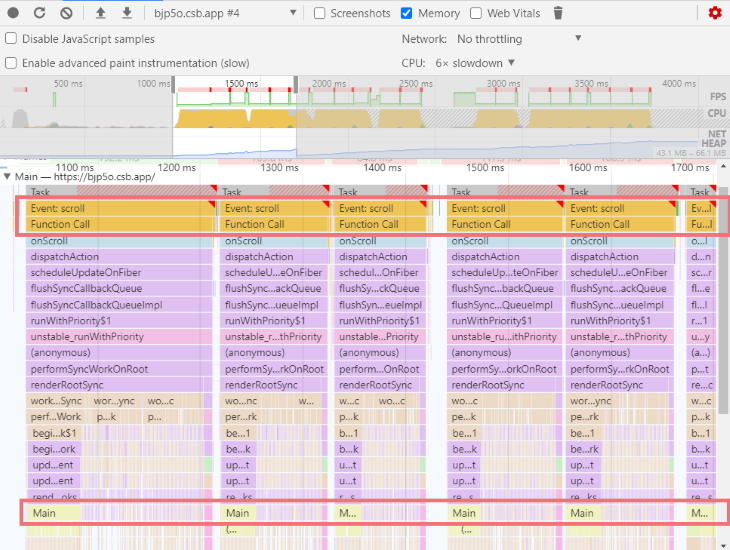
Then we stop the profiler. We can immediately see that the Main component, with its many children, re-renders on every single scroll event, causing janks in the application.
But before we jump to the code and try to understand what’s wrong with Main, let’s try Why Did You Render.
Why Did You Render is a library created by Welldone Software that detects why a component in your app is re-rendering through monkey-patches in React and will notify you about potentially avoidable re-renders.
Note: Make sure not to add the library in production, as it slows React and even might cause it to break in certain edge-cases. Only turn it on when you debug performance issues.
First, we add the library from npm:
npm install @welldone-software/why-did-you-render --save
Next, we add a wdyr.js file to the root of our project:
import React from "react";

// Make sure to only include the library in development
if (process.env.NODE_ENV === "development") {
  const whyDidYouRender = require("@welldone-software/why-did-you-render");
  whyDidYouRender(React, {
    trackAllPureComponents: true
  });
}
And third, we import wdyr.js as the first import of our application in index.js:
import "./wdyr"; // <-- first import

import React from "react";
import ReactDOM from "react-dom";
...
For a detailed installation guide, look at the readme.
Here is a sandbox with the library installed. Now, if you scroll through, you will get the following information in your console:
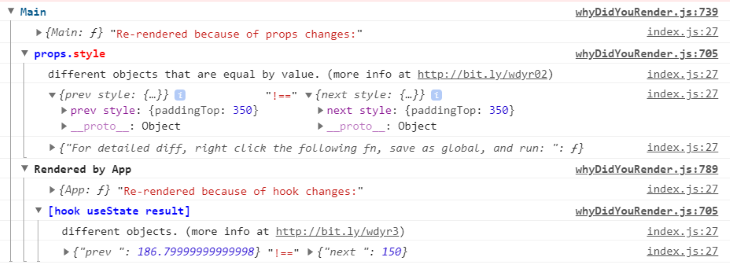
Main was “re-rendered because of props changes”stylestyle has received different objects that are equal by value:{paddingTop: 350} !== {paddingTop: 350}Main is re-rendered by App, and App gets re-rendered because of a trigger of a useState hookAs you can see, we get a very clear picture of why Main got re-rendered. Based on this information, we can infer that the problem is caused by a widespread React anti-pattern when dealing with pure components.
Let’s look at App.js:
export default function App() {
  const headerHeight = useHeaderScroll({
    min: 50,
    max: maxHeaderHeight,
    maxOffset: 3000
  });
  return (
    <div className="App">
      <Header style={{ height: headerHeight }} />
      <Main style={{ paddingTop: maxHeaderHeight }} />
    </div>
  );
}
When a scroll happens, the hook useHeaderScroll causes App to re-render. This re-render causes the Main element to be re-created:
<Main style={{ paddingTop: maxHeaderHeight }} />
Now, because Main is a pure component, it wasn’t supposed to re-render when App re-renders, because seemingly, its props are the same as in the previous render of App. However, in reality, the style prop is a new object on every render:
{ paddingTop: maxHeaderHeight } !== { paddingTop: maxHeaderHeight }
An easy solution to the performance issue would be to pass only the relevant value to Main instead of the style object.
Let’s change:
<Main style={{ paddingTop: maxHeaderHeight }} />
To this:
<Main paddingTop={paddingTop} />
Main will no longer re-render because its only prop is always paddingTop={350}.
Now we just have to make sure that Main is adjusted accordingly to expect paddingTop as a prop instead if style:
const Main = ({ paddingTop } /* instead of {style} */) => {
You can find the corrected application without performance issues in the following sandbox.
Using Why Did You Render can help identify bugs in your React app very effectively, even in places one would not normally look for them. It also reports in great detail so you can know exactly what went wrong. My suggestion is to at least run your initial page load with it to see how can you speed it up in minutes. Thanks for reading.
Install LogRocket via npm or script tag. LogRocket.init() must be called client-side, not
server-side
$ npm i --save logrocket

// Code:

import LogRocket from 'logrocket';
LogRocket.init('app/id');
// Add to your HTML:

<script src="https://cdn.lr-ingest.com/LogRocket.min.js"></script>
<script>window.LogRocket && window.LogRocket.init('app/id');</script>

A real-world debugging session using Claude to solve a tricky Next.js UI bug, exploring how AI helps, where it struggles, and what actually fixed the issue.

CSS wasn’t built for dynamic UIs. Pretext flips the model by measuring text before rendering, enabling accurate layouts, faster performance, and better control in React apps.

Why do real-time frontends break at scale? Learn how event-driven patterns reduce drift, race conditions, and inconsistent UI state.

Test out Auth.js, Clerk, WorkOS, and Better Auth in Next.js 16 to see which auth library fits your app in 2026.
Hey there, want to help make our blog better?
Join LogRocket’s Content Advisory Board. You’ll help inform the type of content we create and get access to exclusive meetups, social accreditation, and swag.
Sign up now