Editor’s note: This post was last updated on 31 October 2022 to include more information about Fabric.js and which React mapping library to use.

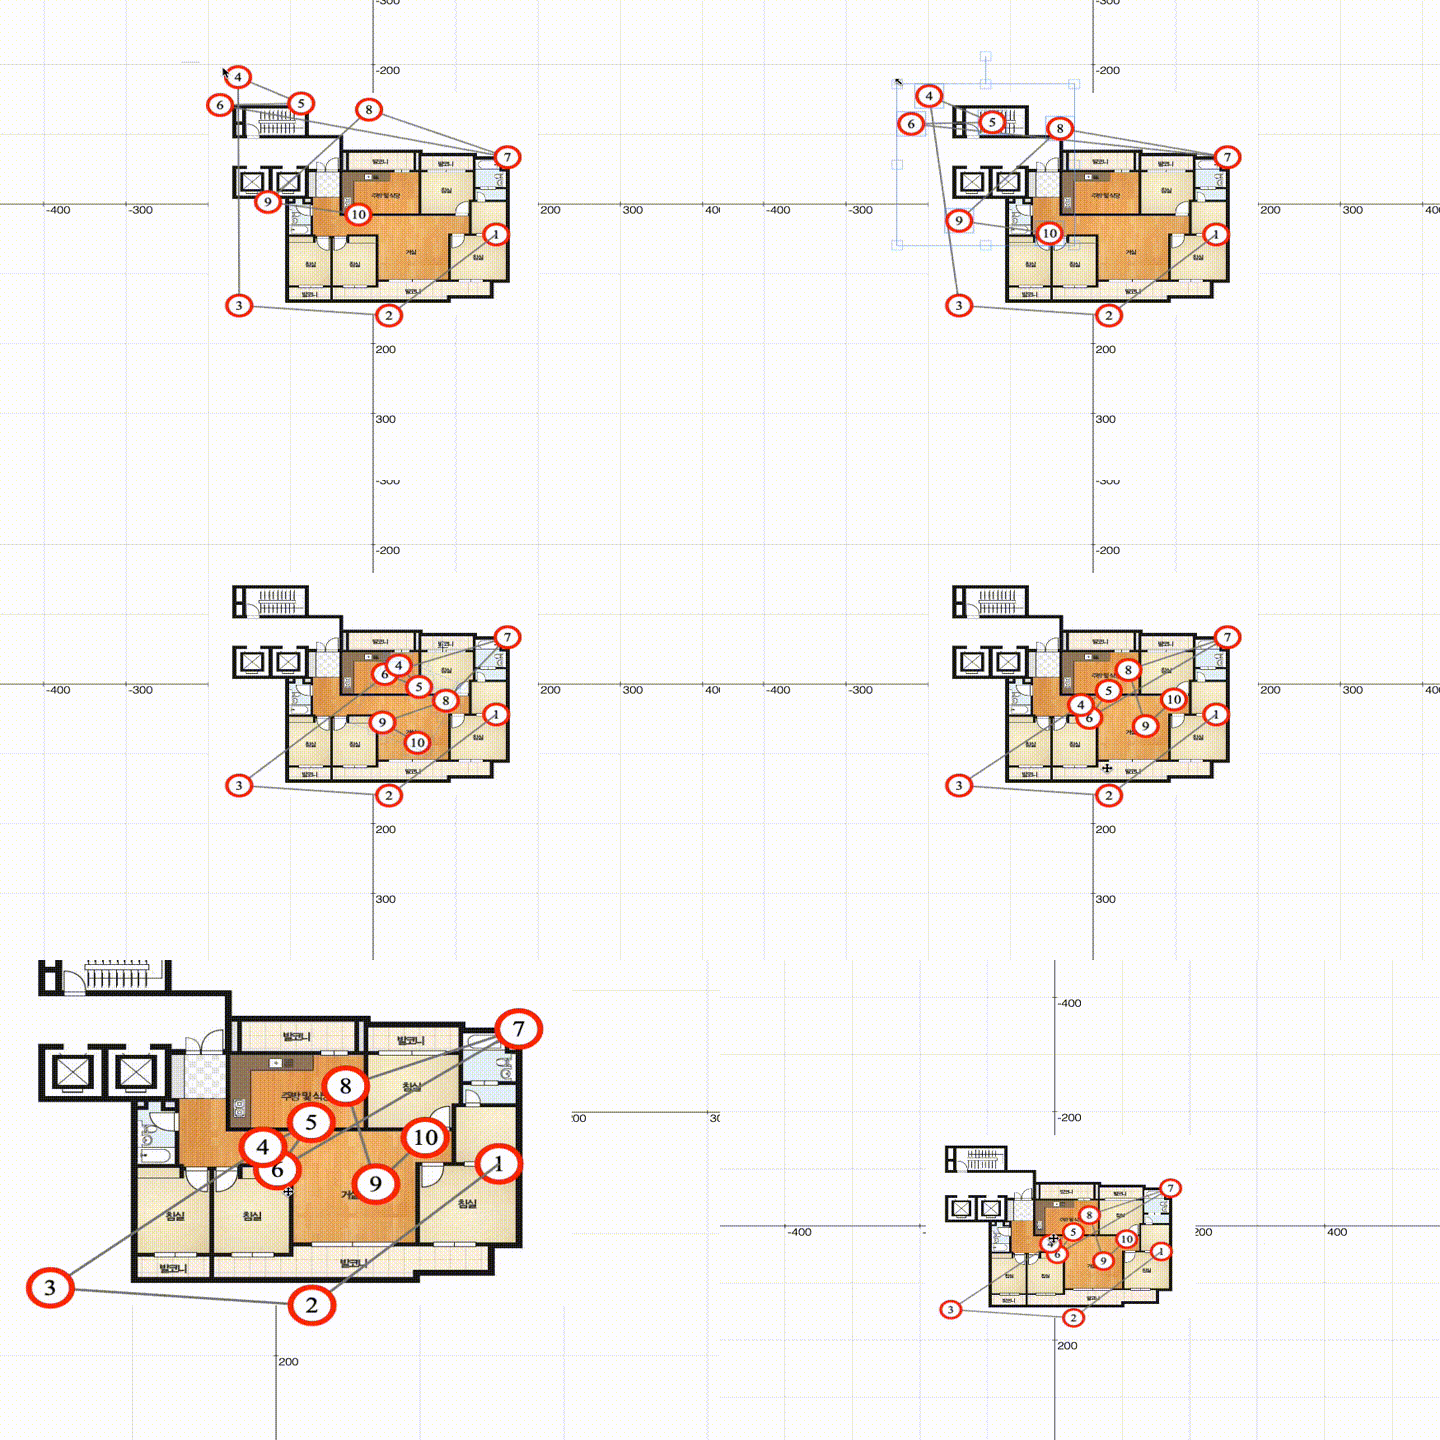
Indoor mapping is a novel concept that uses a digital 2D or 3D map to visualize an indoor venue or geographic data. By displaying places, people, and assets on a digital map, you can recreate indoor locations with navigation functionality, allowing for many business use cases that improve workflows and efficiencies.
For example, indoor mapping can provide deeper insights into visitor behavior, improving managers’ capacity to discover and identify assets quickly and easily. Managers then have the option to use this knowledge to restructure for more efficient operations.
To build indoor maps, developers can use Fabric.js with React to grasp the basic functionalities of the grid system, zooming, panning, and annotations. In this article, we’ll cover how to use Fabric.js inside the component’s render method.
You’ll need basic React, HTML, CSS, and JavaScript knowledge to follow along with this article. You’ll also need a canvas element with an ID and the function that returns the fabric.Canvas object. Finally, you need a basic understanding of how to use npm. You can find the complete code for this project on GitHub.
Let’s get started!

The Replay is a weekly newsletter for dev and engineering leaders.
Delivered once a week, it's your curated guide to the most important conversations around frontend dev, emerging AI tools, and the state of modern software.
Fabric.js is a powerful open source JavaScript canvas library that provides an interactive platform to work with React. Fabric.js allows you to create various objects and shapes on a canvas, ranging from simple geometric shapes to more complex ones. The fabric-covered canvas manages all the fabric objects associated and can be used as a wrapper for the canvas elements. It accepts the element’s IDs and returns a fabric instance.
With Fabric.js, you can work with both images and animations, allowing you to drag, scale, and rotate images. You can also group shapes and objects to be manipulated together. Fabric.js even provides functionality to serialize the canvas to SVG or JSON and reuse it.
As open source software, Fabric.js can be created in a collaborative, public setting. Open source software is a well-known example of this type of collaboration because any competent user can engage in its development online, doubling the number of potential contributors. Public confidence in the software is facilitated by studying the code.
The quickest ways to start a new React project are cloning the existing GitHub project or using Create React App.
First, launch the terminal after installing npm and enter the command npm install --save fabricjs-react fabric react react-dom. This will install Fabric.js, React, and ReactDOM because they are peer dependencies of this module.
Then, install the indoorjs library to build and start the application locally:
npm install indoorjs
npm start
Because this project uses Node.js v16+, an error may occur in Node.js v17+. To avoid this, try to downgrade to Node.js v16. Otherwise, use nvm to switch between Node.js versions, as shown here.
To create objects on the Fabric.js canvas, create the Canvas class before populating the required objects into it. Use the createElement function to upload the canvas into the document and its container. Now, create the different objects that will be populated on the canvas, as shown below. Populate them using the necessary functions:
import Base from '../core/Base';
import { Arrow } from './Arrow';

const Modes = {
  SELECT: 'select',
  DRAWING: 'drawing',
  ARROW: 'arrow',
  TEXT: 'text'
};

export class Canvas extends Base {
  constructor(container, options) {
    super(options);

    this.container = container;

    const canvas = document.createElement('canvas');
    this.container.appendChild(canvas);
    canvas.setAttribute('id', 'indoorjs-canvas');

    canvas.width = this.width || this.container.clientWidth;
    canvas.height = this.height || this.container.clientHeight;

    this.currentColor = this.currentColor || 'black';
    this.fontFamily = this.fontFamily || 'Roboto';

    this.canvas = new fabric.Canvas(canvas, {
      freeDrawingCursor: 'none',
      freeDrawingLineWidth: this.lineWidth
    });
    this.arrows = [];

    this.setLineWidth(this.lineWidth || 10);
    this.addCursor();
    this.addListeners();

    this.setModeAsArrow();
  }

  setModeAsDrawing() {
    this.mode = Modes.DRAWING;
    this.canvas.isDrawingMode = true;
    this.canvas.selection = false;
    this.onModeChanged();
  }

  isDrawingMode() {
    return this.mode === Modes.DRAWING;
  }

 setModeAsSelect() {
    this.mode = Modes.SELECT;
    this.canvas.isDrawingMode = false;
    this.canvas.selection = true;
    this.onModeChanged();
  }

  isSelectMode() {
    return this.mode === Modes.SELECT;
  }

  setModeAsArrow() {
    this.mode = Modes.ARROW;
    this.canvas.isDrawingMode = false;
    this.canvas.selection = false;
    this.onModeChanged();
  }

  isArrowMode() {
    return this.mode === Modes.ARROW;
  }

  setModeAsText() {
    this.mode = Modes.TEXT;
    this.canvas.isDrawingMode = false;
    this.canvas.selection = false;
    this.onModeChanged();
  }
Since the gradient is essential for measuring objects on the canvas, use the measurement class to implement the x- and y-axis. The code below shows how to use the x and y-axis and the onMouseMove function to create the gradient of objects:
import Measurer from './Measurer';

class Measurement {
  constructor(map) {
    this.map = map;
    this.measurer = null;
  }

  onMouseMove(e) {
    const point = {
      x: e.absolutePointer.x,
      y: e.absolutePointer.y,
    };

    if (this.measurer && !this.measurer.completed) {
     this.measurer.setEnd(point);
      this.map.canvas.requestRenderAll();
    }
  }

  onClick(e) {
    const point = {
      x: e.absolutePointer.x,
      y: e.absolutePointer.y,
    };
    if (!this.measurer) {
      this.measurer = new Measurer({
        start: point,
        end: point,
       map: this.map,
      });

      // this.map.canvas.add(this.measurer);
    } else if (!this.measurer.completed) {
      this.measurer.setEnd(point);
      this.measurer.complete();
    }
  }
}

export default Measurement;
Import alpha, grid-style, Axis, and Point from Geometry. Before proceeding to the next step, create a constructor of the canvas inside the Grid class. Use the getCenterCoords function to get the coordinates, width, height, and states of the different shapes.
Reevaluate the lines with the x and y-axis to calculate the options for the renderer and to recalculate their state. Then, get state object with calculated parameters ready for rendering. Finally, calculate the real offset/range:
import alpha from '../lib/color-alpha';
import Base from '../core/Base';
import {
  clamp, almost, len, parseUnit, toPx, isObj
} from '../lib/mumath/index';
import gridStyle from './gridStyle';
import Axis from './Axis';
import { Point } from '../geometry/Point';

// constructor
class Grid extends Base {
  constructor(canvas, opts) {
    super(opts);
    this.canvas = canvas;
    this.context = this.canvas.getContext('2d');
    this.state = {};
    this.setDefaults();
    this.update(opts);
  }

  render() {
    this.draw();
    return this;
  }

  getCenterCoords() {
    let state = this.state.x;
    let [width, height] = state.shape;
    let axisCoords = state.opposite.coordinate.getCoords(
      [state.coordinate.axisOrigin],
      state.opposite
    );
    const y = pt + axisCoords[1] * (height - pt - pb);
    state = this.state.y;
    [width, height] = state.shape;
    [pt, pr, pb, pl] = state.padding;
    axisCoords = state.opposite.coordinate.getCoords([state.coordinate.axisOrigin], state.opposite);
    const x = pl + axisCoords[0] * (width - pr - pl);
    return { x, y };
  }

  setSize(width, height) {
    this.setWidth(width);
    this.setHeight(height);
  }

  setWidth(width) {
    this.canvas.width = width;
  }

  setHeight(height) {
    this.canvas.height = height;
  }

  update(opts) {
    if (!opts) opts = {};
    const shape = [this.canvas.width, this.canvas.height];

    // recalc state
    this.state.x = this.calcCoordinate(this.axisX, shape, this);
    this.state.y = this.calcCoordinate(this.axisY, shape, this);
    this.state.x.opposite = this.state.y;
    this.state.y.opposite = this.state.x;
    this.emit('update', opts);
    return this;
  }

  // re-evaluate lines,
  update2(center) {
    const shape = [this.canvas.width, this.canvas.height];
    Object.assign(this.center, center);
    // recalc state
    this.state.x = this.calcCoordinate(this.axisX, shape, this);
    this.state.y = this.calcCoordinate(this.axisY, shape, this);
    this.state.x.opposite = this.state.y;
    this.state.y.opposite = this.state.x;
    this.emit('update', center);

    this.axisX.offset = center.x;
    this.axisX.zoom = 1 / center.zoom;

    this.axisY.offset = center.y;
    this.axisY.zoom = 1 / center.zoom;
  }

  calcCoordinate(coord, shape) {
    const state = {
      coordinate: coord,
      shape,
      grid: this
    };
    // calculate real offset/range
    state.range = coord.getRange(state);
    state.offset = clamp(
      Math.max(coord.min, -Number.MAX_VALUE + 1),
      Math.min(coord.max, Number.MAX_VALUE) - state.range
    );
Because there are a few zoom features in the previous code, we’ll implement zoom and panning features inside the grid. The stub methods use the visible range parameters, labels, line, and axis parameters to return coordinates for the values redefined by the axes.
Now, declare the Zoom function with important variables like height, width, minimum, and maximum zoom positions. At this point, it’s critical to declare the pan and its features. Finally, to return the screen to default features after zooming and panning, use the reset function as shown below:
setZoom(zoom) {
    const { width, height } = this.canvas;
    this.zoom = clamp(zoom, this.minZoom, this.maxZoom);
    this.dx = 0;
    this.dy = 0;
    this.x = width / 2.0;
    this.y = height / 2.0;
    this.update();
    process.nextTick(() => {
      this.update();
    });
  }
    if (layer.shape.keepOnZoom) {
      const scale = 1.0 / this.zoom;
      layer.shape.set('scaleX', scale);
      layer.shape.set('scaleY', scale);
      layer.shape.setCoords();
      this.emit(`${layer.class}scaling`, layer);
    }
  this.zoom = Math.min(scaleX, scaleY);

    this.canvas.setZoom(this.zoom);

    this.canvas.absolutePan({
      x: this.originX + this.center.x * this.zoom,
      y: this.originY - this.center.y * this.zoom
    });

reset() {
    const { width, height } = this.canvas;
    this.zoom = this._options.zoom || 1;
    this.center = new Point();
    this.originX = -this.canvas.width / 2;
    this.originY = -this.canvas.height / 2;
    this.canvas.absolutePan({
      x: this.originX,
      y: this.originY
    });
 const objects = canvas.getObjects();
    let hasKeepZoom = false;
    for (let i = 0; i < objects.length; i += 1) {
      const object = objects[i];
      if (object.keepOnZoom) {
        object.set('scaleX', 1.0 / this.zoom);
        object.set('scaleY', 1.0 / this.zoom);
        object.setCoords();
        hasKeepZoom = true;
  this.emit(`${object.class}scaling`, object);
      }
    }
    if (hasKeepZoom) canvas.requestRenderAll();
  }

  panzoom(e) {
    // enable interactions
    const { width, height } = this.canvas;

    const prevZoom = 1 / this.zoom;
    let curZoom = prevZoom * (1 - zoom);
    curZoom = clamp(curZoom, this.minZoom, this.maxZoom);

    // pan
    const oX = 0.5;
    const oY = 0.5;
    if (this.isGrabMode() || e.isRight) {
      x -= prevZoom * e.dx;
      y += prevZoom * e.dy;
      this.setCursor('grab');
    } else {
      this.setCursor('pointer');
    }

    if (this.zoomEnabled) {
      x -= width * (curZoom - prevZoom) * tx;
      y -= height * (curZoom - prevZoom) * ty;
    }
    this.center.setX(x);
    this.center.setY(y);
    this.zoom = 1 / curZoom;
    this.dx = e.dx;
    this.dy = e.dy;
    this.x = e.x0;
    this.y = e.y0;
    this.isRight = e.isRight;
    this.update();
  }
To scale the canvas, we begin by initializing the scaleX and scaleY values used to convert the dimensions of the objects relative to the original canvas dimensions. We use a math function to scale and zoom objects and the canvas. The canvas changes size depending on the users’ input and their use of the scroll wheel to zoom in and out on an object. The canvas is zoomed in and out depending on the height and width, allowing the user to view the entire canvas.
Annotation refers to labeling text or images. When the default label options don’t fit our needs, we can use annotation to improve the taxonomy. We’ll first import the image annotation tools into the component to annotate our code. To use a nested array of objects, the labels must start with the coordinates of the labels or annotations.
Finally, we convert the hashmap labels or annotations to lines and colors, making them visible when the application is running:
    let labels;
    if (coord.labels === true) labels = state.lines;
    else if (coord.labels instanceof Function) {
      labels = coord.labels(state);
    } else if (Array.isArray(coord.labels)) {
      labels = coord.labels;
    } else if (isObj(coord.labels)) {
      labels = coord.labels;
    } else {
      labels = Array(state.lines.length).fill(null);
    }
    state.labels = labels;
    // convert hashmap labels to lines
    if (isObj(ticks)) {
      state.ticks = Array(lines.length).fill(0);
    }
    if (isObj(labels)) {
      state.labels = Array(lines.length).fill(null);
    }
    if (isObj(ticks)) {
      // eslint-disable-next-line
      Object.keys(ticks).forEach((value, tick) => {
        state.ticks.push(tick);
       state.lines.push(parseFloat(value));
      state.lineColors.push(null);
       state.labels.push(null);
      });
    }

    if (isObj(labels)) {
      Object.keys(labels).forEach((label, value) => {
        state.labels.push(label);
        state.lines.push(parseFloat(value));
        state.lineColors.push(null);
        state.ticks.push(null);
      });
    }

    return state;
  }
Although we’ve discussed Fabric.js, there are alternatives for mapping. Let’s look at a few.
By pitching and rotating 2D maps, the Maptalks flexible, open source library mixes 2D and 3D maps. Any preferred technology, such as CSS3, Canvas, and WebGL, can enhance Maptalks. Go ahead and create your own; it’s easy and fun. Using Maptalks and plugins, you can render 10,000 geometries with Canvas 2D.
OpenLayers is an open source, high-performance JavaScript framework that can build interactive maps that employ various mapping services. You can choose a tiled layer or a vector layer for the map layer source from a selection of map services.
Because the tool is mobile-ready out of the box, it is appropriate for creating maps across platforms and browsers. With CSS, you can change how your map looks.
A little JavaScript package called Raphaël.js aims to simplify using vector graphics on the web. With the help of this library, you can quickly and easily create your own unique chart or image crop and rotate widget.
Raphaël uses VML and the SVG W3C recommendations to produce graphics. As a result, each visual object you create also becomes a DOM object, enabling you to later attach or change JavaScript event handlers. Raphaël’s mission is to provide an adapter that makes it easier to create vector graphics that are cross-browser compatible.
Kartograph is a framework for creating SVG maps that do not require any additional mapping services. Kartograph.js is a JavaScript library that allows you to create interactive maps using Kartograph SVG maps. It is built on Raphaël and jQuery and gracefully degrades to IE7 and above.
Kartograph lacks a ready-to-use map collection, but it does support any SVG map and comes with a map-creation tool called Kartograph.py. This framework offers a fluid mapping experience. The library documentation and API reference (integrated into a single page) make setting up interactive maps in your projects simple and pleasant. However, Kartograph is not dependency-free; it requires Raphaël.js for drawing and jQuery.
Leaflet is a free, open source JavaScript library for making dynamic, mobile-friendly maps. It’s a compact application that supports all major browsers and operating systems and has a ton of functionality, plugins, and an intuitive API. Here are a few Leaflet examples.
Leaflet is a fantastic option for mobile applications or other circumstances when load time or size is constrained due to its core library’s reasonable size. Additionally, Leaflet has a huge selection of plugins, so you can add nearly any feature that would be available with a more extensive mapping library.
Paper.js is an open source canvas-based programming environment for vector graphics. In addition to providing a robust collection of tools for creating and modifying vector graphics and Bezier curves, it offers a clean, well-designed programming interface. It also provides a Scene Graph/Document Object Model for vector graphics. Paper.js is built on Scriptographer, an environment for scripting Adobe Illustrator.
The metaphor of a software sketchbook served as the foundation for the p5.js library’s comprehensive sketching features. However, this tool does not limit you to a simple sketching surface; instead, imagine your entire browser page as your sketch!
You may interact with HTML5 components, including text, input, video, webcam, and sound, by using the p5.js add-on libraries.
If you’re already familiar with the fundamentals of JavaScript or Processing, then p5.js may be a good option as it is an ongoing development interpretation of both languages.
Compared to the other libraries described above, Fabric.js is the best React mapping library to utilize because its canvas enables us to make some truly incredible images.
Sadly, the majority of the other mapping libraries are very basic. It’s one thing if we just want to quickly sketch some simple shapes on a canvas and move on. However, the scenario drastically changes the moment any interaction, picture alteration, or sketching of more complex shapes is required. Fabric.js aims to solve this problem.
Native canvas techniques only provide straightforward graphic instructions that indiscriminately change the entire canvas bitmap. It resembles a painting on canvas with a brush while applying increasing amounts of oil on top with little control.
Instead of working at such a basic level, Fabric.js offers a straightforward yet effective object model on top of native methods. It handles canvas state and rendering and enables direct interaction with objects.
Finally, Fabric.js is a more potent JavaScript framework that simplifies working with HTML5 canvas despite most React mapping libraries being entirely open-source. A layer of interactivity, a missing object model for canvas, and a vast array of other essential utilities are all provided by fabric.js.
Fabric.js is one of the best drawing libraries on the market at the time of writing. In this article, we learned how to use Fabric.js to wrap a complex library into an uncontrolled component of React. Hopefully, Fabric.js will implement other components as well.
We also reviewed several mapping alternatives to Fabric.js: Maptalks, OpenLayers, Raphaël.js, Kartograph.js, Leaflet, Paper.js, and p5.js. I’ve used Fabric.js with great success in the past, despite it being under development at the time of writing. Thanks for reading!
Install LogRocket via npm or script tag. LogRocket.init() must be called client-side, not
server-side
$ npm i --save logrocket

// Code:

import LogRocket from 'logrocket';
LogRocket.init('app/id');
// Add to your HTML:

<script src="https://cdn.lr-ingest.com/LogRocket.min.js"></script>
<script>window.LogRocket && window.LogRocket.init('app/id');</script>

@container scroll-state: Replace JS scroll listeners nowCSS @container scroll-state lets you build sticky headers, snapping carousels, and scroll indicators without JavaScript. Here’s how to replace scroll listeners with clean, declarative state queries.

Russ Miles, a software development expert and educator, joins the show to unpack why “developer productivity” platforms so often disappoint.

Discover what’s new in The Replay, LogRocket’s newsletter for dev and engineering leaders, in the February 18th issue.

Learn how to recreate Claude Skills–style workflows in GitHub Copilot using custom instruction files and smarter context management.
Would you be interested in joining LogRocket's developer community?
Join LogRocket’s Content Advisory Board. You’ll help inform the type of content we create and get access to exclusive meetups, social accreditation, and swag.
Sign up now