

Every shadcn/ui project you have ever cloned ships the same little file: lib/utils.ts. Inside it is a two-line function called cn(), and it runs on every element, on every render. Nobody profiles it, because it is a utility function, and utility functions are supposed to be free.

They are not. Aiden Bai, the creator of Million.js, shipped a drop-in replacement called cnfast that claims to be 3.8x faster on average, up to 7x on component-heavy code, with byte-identical output. One import change in lib/utils.ts, no other code, and your whole component library’s styling layer gets faster. That sounds like free money.
So I stopped assuming and put it in a real dashboard. I benchmarked the function in isolation, then inside a 500-row data grid, a 1,500-item virtual list, and a server render. The isolated numbers are big, and they swing hard depending on whether you run them in Node or in the browser. The real-app numbers are a shrug either way. This article is the whole story, dead ends and setup errors included.
cn() pattern nobody questionsIf you have used shadcn/ui, you created this file without thinking about it. The docs tell you to. Every Tailwind component tutorial includes import { cn } from "@/lib/utils". It looks like this:
import { clsx, type ClassValue } from "clsx"
import { twMerge } from "tailwind-merge"

export function cn(...inputs: ClassValue[]) {
  return twMerge(clsx(inputs))
}
Two jobs live in that one line. clsx joins your class names and drops the falsy ones, so cn("px-2", isActive && "px-4") becomes a clean string. tailwind-merge then resolves the conflicts, so px-2 px-4 collapses to px-4 and the last utility wins.
Here is the part nobody thinks about. tailwind-merge parses every class string through a regex-based tokenizer, sorts each token into a Tailwind utility group, checks for conflicts across those groups, and resolves them. That work is not free, and it runs every single time React re-renders a component that calls cn(). On a static marketing page, who cares? On a data grid painting hundreds of rows, or a dashboard with live charts, that function fires thousands of times a second.
That is the pitch for cnfast. So let me show you how I tested whether the pitch survives contact with a real app.
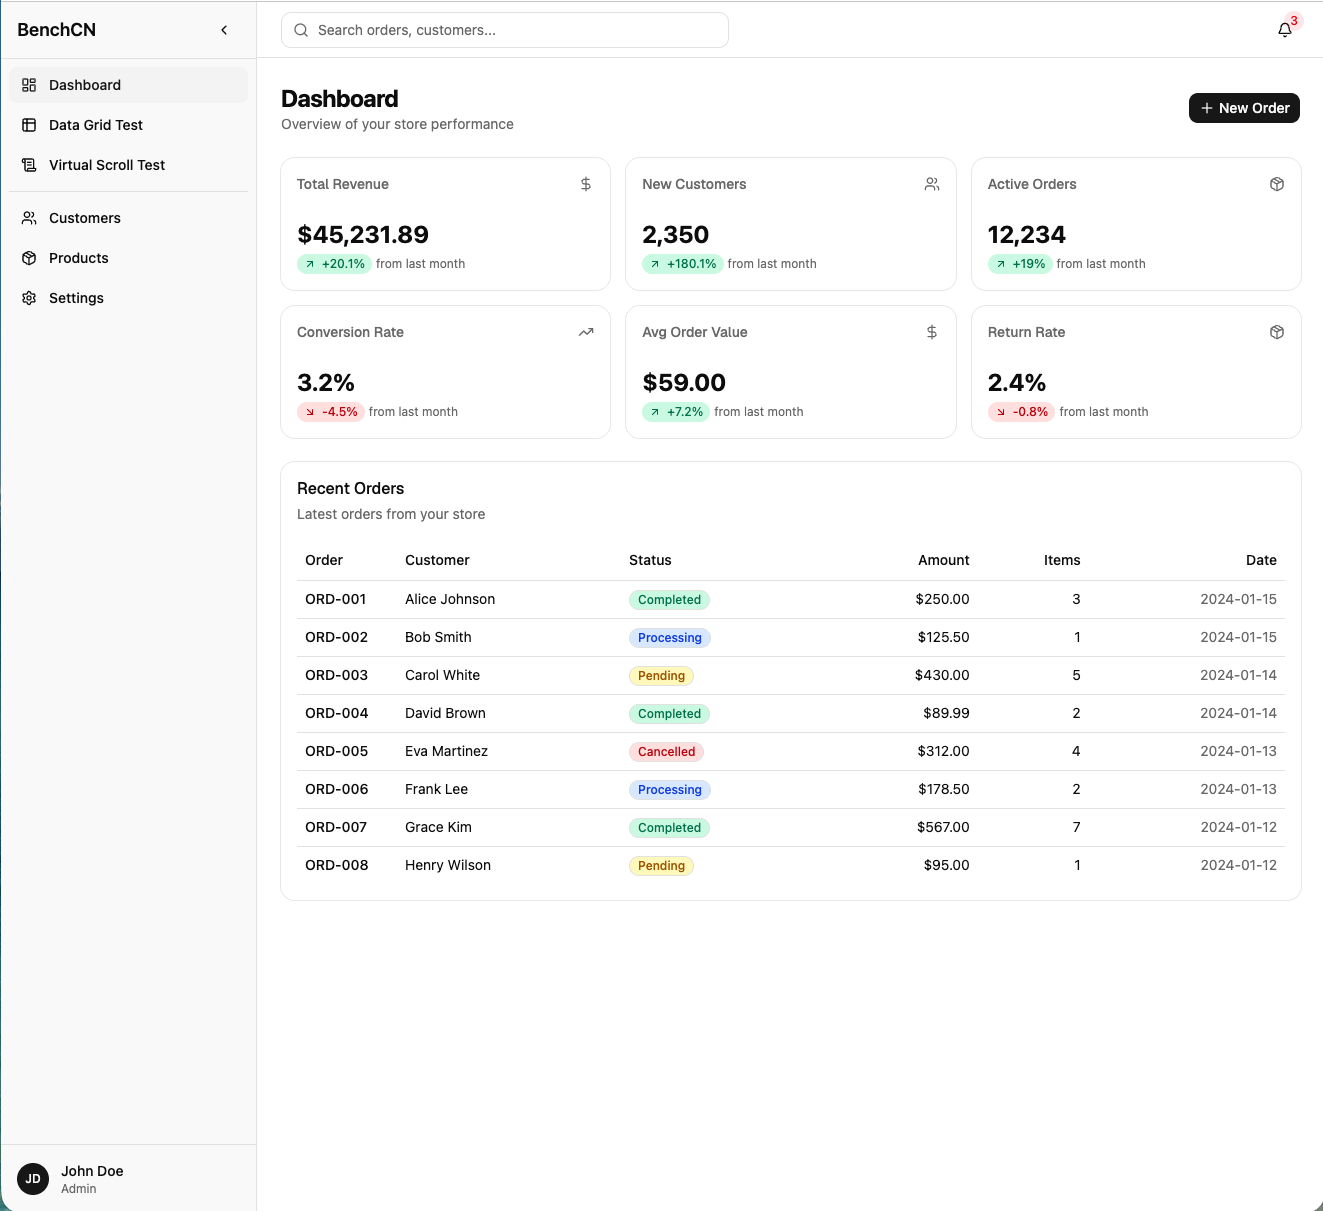
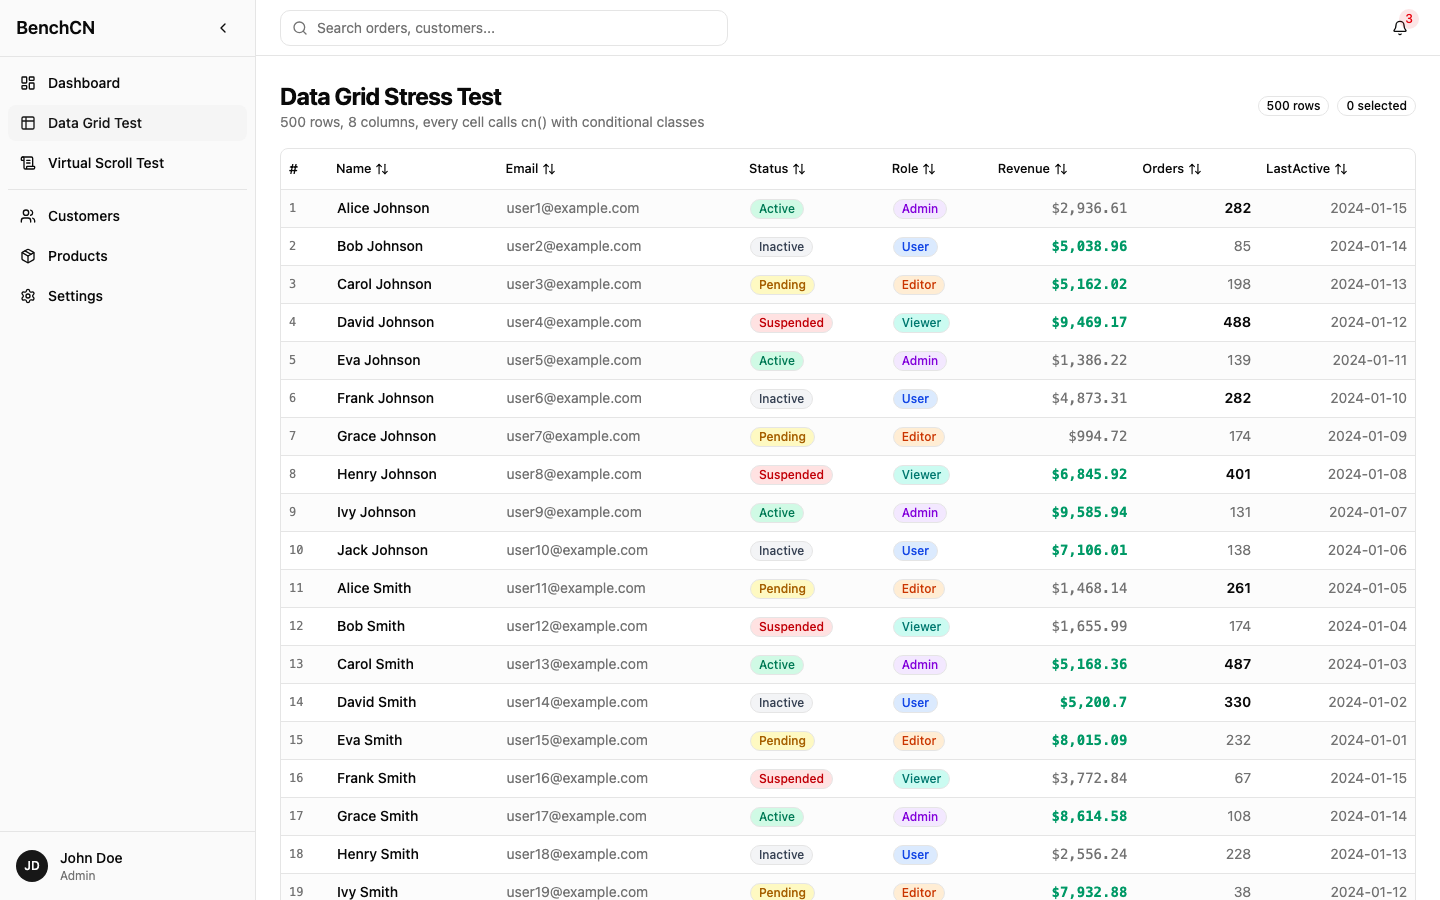
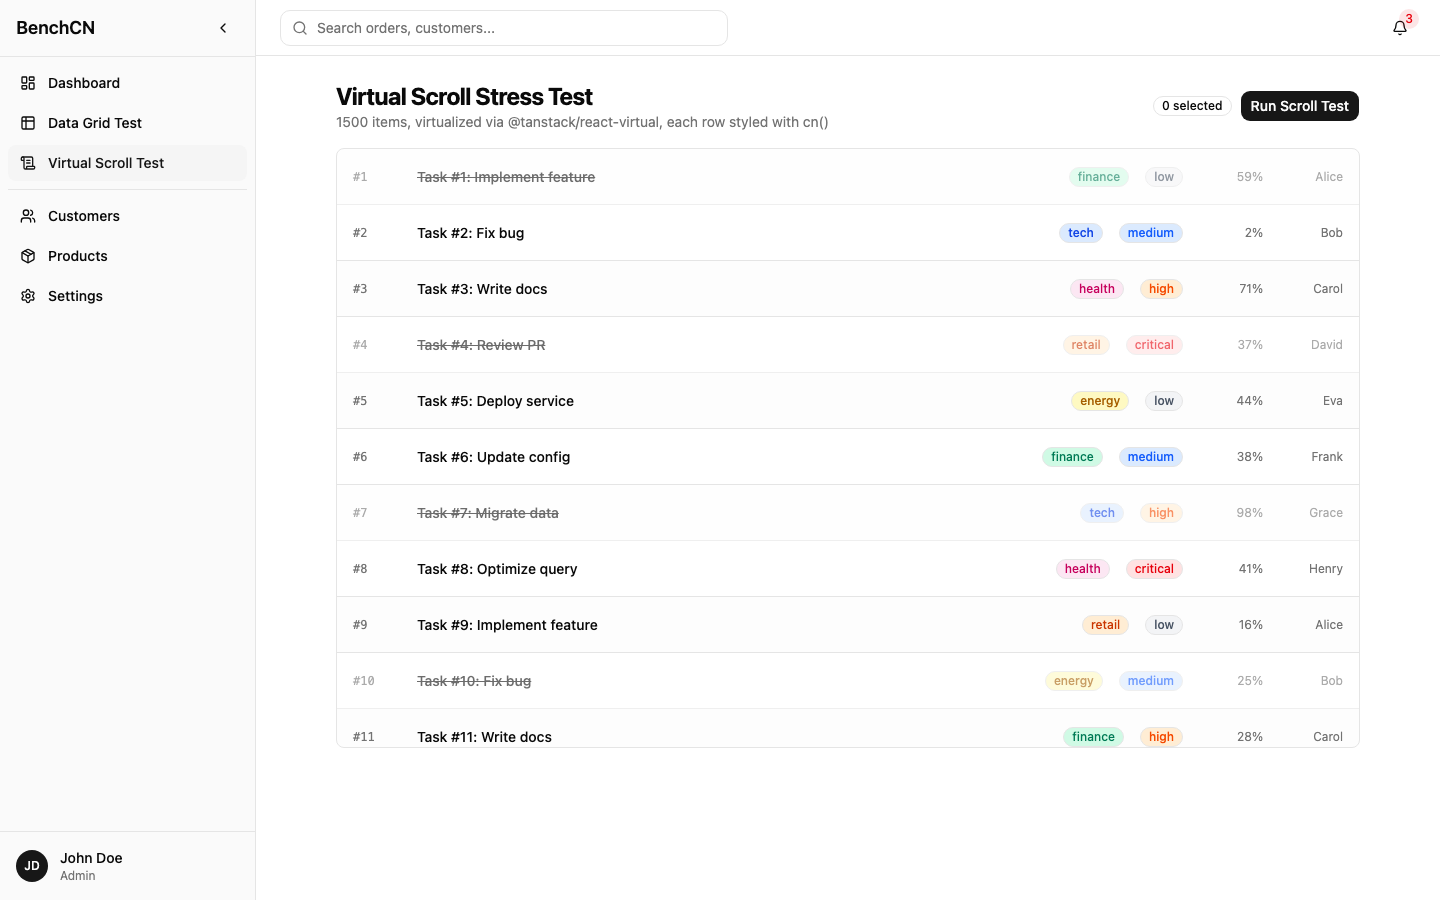
I built a realistic dashboard with Vite, React 18, Tailwind v4, and shadcn/ui. Not a toy: a collapsible sidebar, a top bar with search and a notification badge, six stat cards with trend badges, a recent-orders table with conditional status colors, a create-order modal, and two stress pages. One stress page is a 500-row grid with eight styled columns, selection, and sorting. The other is a 1,500-item list virtualized with @tanstack/react-virtual.
The trick that makes the whole thing fair is that I made cn() swappable. Two files hold the two implementations:
// src/lib/cn-slow.ts  (the standard shadcn cn)
import { clsx, type ClassValue } from "clsx"
import { twMerge } from "tailwind-merge"
export function cn(...inputs: ClassValue[]) {
  return twMerge(clsx(inputs))
}
// src/lib/cn-fast.ts
export { cn } from "cnfast"
A Vite alias picks one based on an env flag, so VITE_CN=fast npm run build bundles only cnfast, and VITE_CN=slow npm run build bundles only clsx plus tailwind-merge. The app code never changes. Only the alias resolution does. Every component, from my stat cards down to the shadcn primitives, pulls cn from the same place, so the two builds are identical except for that one function.
For the record: Apple M4, 16 GB, Node 22.14, Chrome 151 driven by Puppeteer, React 18.3.1, tailwind-merge 3.6.0, cnfast 0.1.0.
It was not all smooth. create-vite shipped React 19, so I had to downgrade to 18 first. shadcn init refused to run until I added baseUrl and paths to the root tsconfig, which is the one it reads for alias validation, not the app tsconfig. And my first slow build blew up with Rolldown failed to resolve import "tailwind-merge" because the shadcn init did not leave the package behind. A quick npm install tailwind-merge clsx fixed it. Small snags, but this is the stuff that eats an afternoon, so I am leaving it in.
cn()?Before any speed talk, the promise is byte-identical output. If cnfast is faster but resolves conflicts differently, it is not a drop-in, it is a bug generator. So I tested that first.
I built a corpus of 351 argument groups. 81 came straight from the real cn() call sites in my dashboard. 108 were deliberate edge cases: conflicting paddings, responsive variants like md:px-4, arbitrary values like bg-[#123456], object syntax like { 'text-red-500': hasError }, arrays, and every falsy value I could think of. The last 162 were mixed permutations of the two. Then I ran both implementations over every group and compared the output strings.
| Metric | Value |
|---|---|
| Total argument groups | 351 |
| Mismatches | 0 |
Zero. Every group produced identical output. cnfast clears the trust bar. It really is a drop-in, at least across everything my dashboard and my paranoia could throw at it. Good. Now we can talk about speed.
I measured the function alone, in a tight loop, using eight representative argument sets from the real components. Each variant warmed up for 1,000 iterations, then ran eight timed samples of about 500ms each, discarding the first. I compared three things: the standard cn(), cnfast’s call form, and cnfast’s tagged-template form, which caches by call-site identity.
| Variant | Median ops/s | Speedup |
|---|---|---|
tailwind-merge cn() |
6,367,481 | 1.00x |
cnfast cn() call form |
36,587,575 | 5.75x |
cnfast cn tagged template |
45,781,656 | 7.19x |
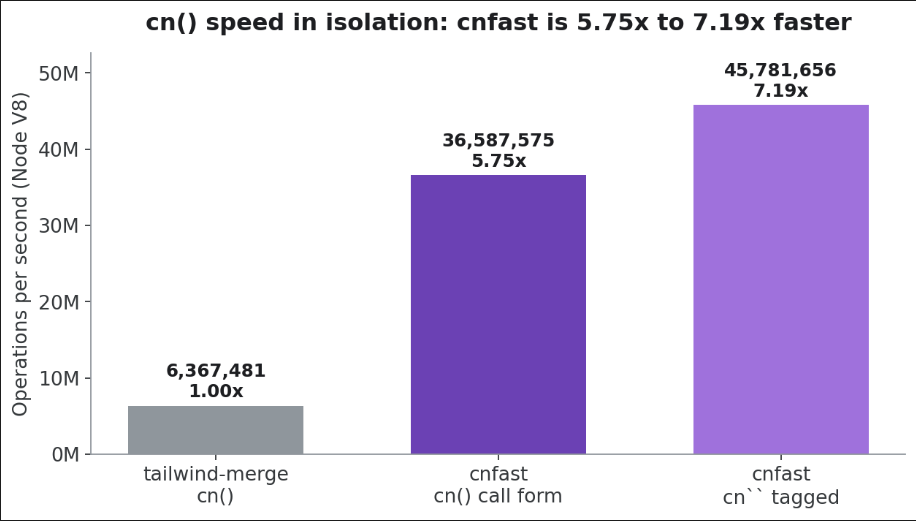
Read that again. In Node, the plain call-form swap was 5.75x faster, which already beats the 3.8x headline, and the tagged template pushed it to 7.19x. Variance was tight, so these are real numbers, not a lucky run.
Then I ran the exact same benchmark in Chrome, which matters because Chrome is where React actually lives. The numbers changed, and not in cnfast’s favor.
| Variant | Median ops/s (Chrome) | Speedup |
|---|---|---|
tailwind-merge cn() |
15,460,192 | 1.00x |
cnfast cn() call form |
32,841,520 | 2.12x |
cnfast cn tagged template |
42,122,784 | 2.72x |
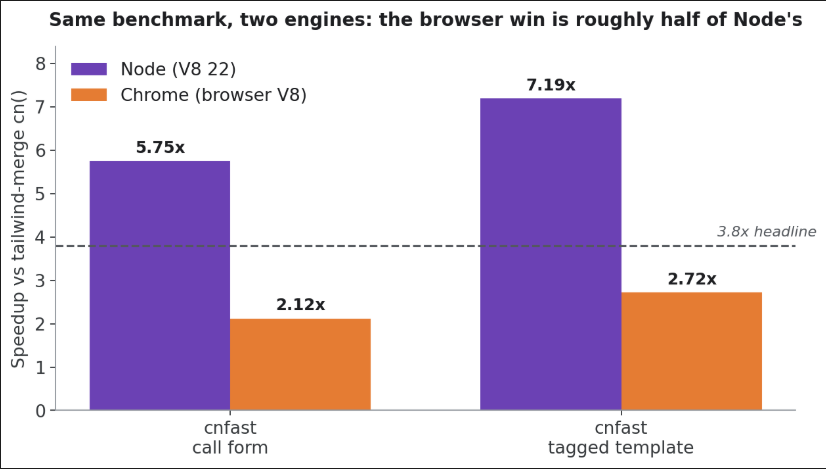
Same code, same argument sets, and the call-form win dropped from 5.75x in Node to 2.12x in the browser. Sit with that for a second. In Chrome, cnfast’s drop-in call form does not even reach the 3.8x number on the box. The tagged template holds up a little better at 2.72x, but it is nowhere near the Node figure either.
The reason is baked into V8. It already caches the arguments of a repeated cn() call, so part of what cnfast hand-optimizes, the engine was quietly doing for you already. Node 22 and Chrome 151 run different V8 builds under different conditions, and the gap between them is the whole point here. The speedup you get is not one number; it is a range that depends heavily on where you measure. And the place that matters most for a React app, the browser, is the place where cnfast looks weakest.
Here is the thing, though. Even that 2.12x is measured in a tight loop, and a tight loop is not your app. In your app, cn() does not run alone. It runs inside a React render, and React has a lot more on its mind than string merging.
This is the part the launch tweets do not show you. I took that function, worth about 2x in the browser and up to 7x in Node, and dropped it into components that hammer it, then measured the full render.
Because React’s Profiler onRender callback does not fire in production builds, I timed renders with a useLayoutEffect plus performance.now() pattern that works in prod. Three independent runs per variant, medians of seven samples each.
The 500-row data grid. Every cell calls cn() with conditional classes, so a single sort re-render fires the function somewhere north of 4,000 times.
| Interaction | Slow (clsx + tw-merge) | Fast (cnfast) | Speedup |
|---|---|---|---|
| Sort re-render | 28.47 ms | 26.37 ms | ~7.4% |
| Row-select re-render | 20.90 ms | 20.50 ms | ~1.9% (noise) |
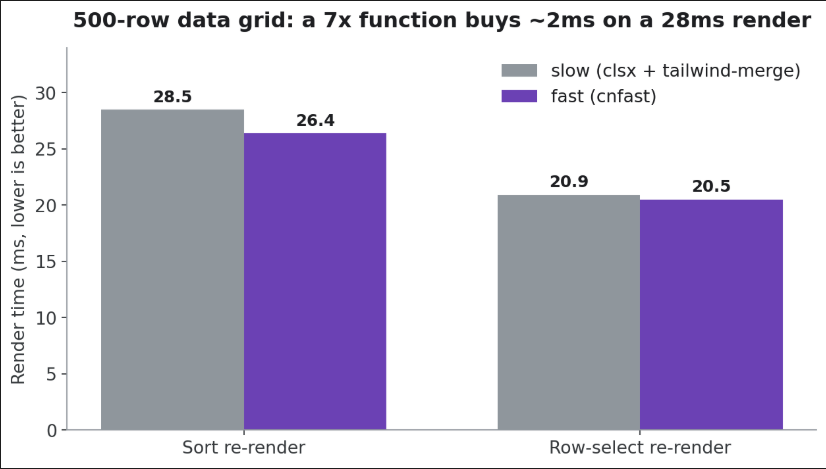
A function several times faster in isolation bought me 2ms on a 28ms render. Consistently faster, yes, across all three runs. But 2ms. The row-select case was inside run-to-run noise.
The 1,500-item virtual scroll. I drove a programmatic scroll for three seconds and counted frames that blew the 16.7ms budget.
| Metric | Slow | Fast |
|---|---|---|
| Dropped frames (avg of ~181) | 92 | 88 |
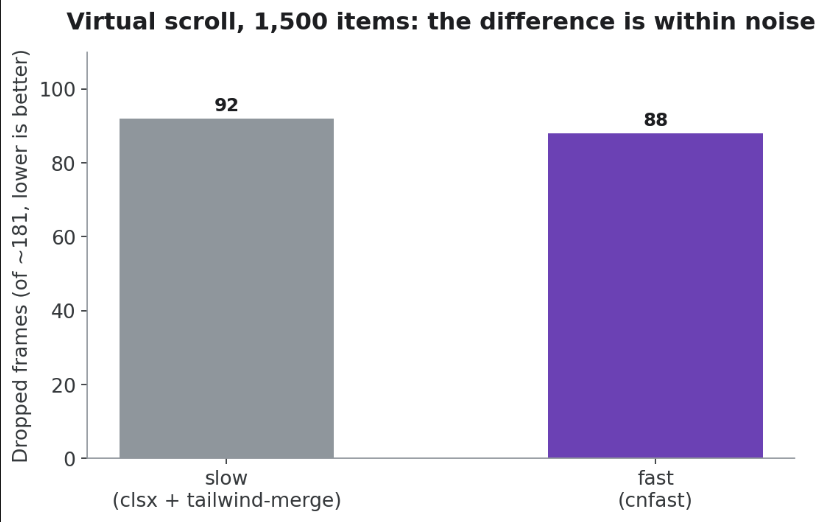
Four fewer dropped frames on average, but the ranges overlap so badly that one fast run (97) was worse than one slow run (86). The honest verdict is that this is noise. cnfast does not measurably help scroll, because scroll cost is layout and paint, not class merging.
Server rendering. A tree of about 3,500 elements through renderToString.
| Variant | Median | Speedup |
|---|---|---|
tailwind-merge cn() |
1.90 ms | 1.00x |
cnfast cn() |
1.65 ms | 1.15x |
A 15% SSR win. Real, but small, and the min/max ranges overlap. renderToString and element creation dominate that number, not cn().
Pull up the React Profiler on that data grid and the point makes itself. One sort commit takes 72ms. The DataGridStress component eats 28.5ms of that, the table body another 41.8ms, and layout effects clock in at under 0.1ms. Now go looking for cn() in the flame graph. It does not even earn its own bar. It is folded invisibly into each component’s render time, a few microseconds at a stretch. You cannot speed up a bar you cannot find.
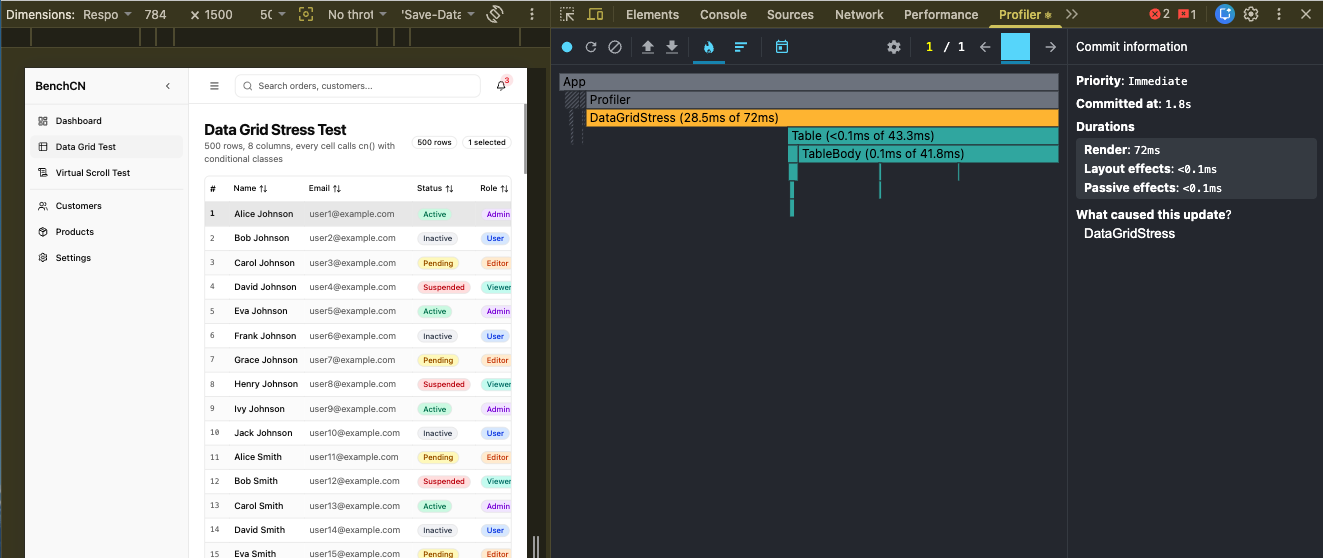
Here is the plain version. cn() is a tiny slice of what a render costs. React spends its real time on reconciliation, creating and diffing elements, mutating the DOM, and letting the browser lay out and paint. Making the class-merge step a few times faster is like making the barista faster at writing your name on the cup. The line still moves at the speed of the espresso machine.
The math is unforgiving. If cn() is, say, 3% of your render, then making it even 7x faster shaves off less than 3% of the total, and in the browser you are working with closer to 2x. That is a rounding error you will never feel, and it is exactly what the numbers above show.
Speed talk usually skips the cost side, so let me put it on the table. Measuring the cn-layer alone, minified and gzipped:
| Variant | Gzipped | Delta |
|---|---|---|
| clsx + tailwind-merge | 8.6 KB | baseline |
| cnfast | 9.7 KB | +~1 KB |
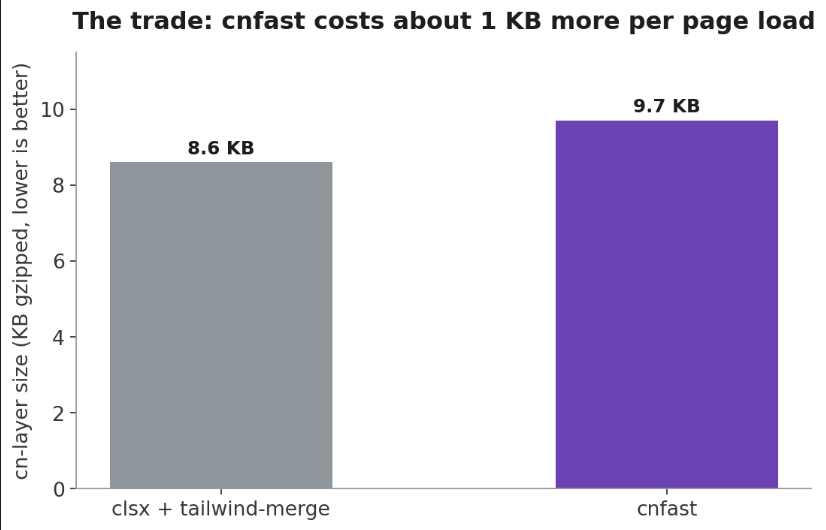
cnfast is about 1 KB larger because it ships its own optimized tailwind-merge fork plus the caching machinery. So you are adding roughly 1 KB to every page load in order to speed up something that was not your bottleneck. That trade only makes sense if the runtime win is real for your app, and for most apps it is not.
The biggest number, 7.19x, came from the tagged-template form, cn`px-2 py-1 ${isActive && 'px-4'}`. It caches by call-site identity, so a stable call site skips the join and the hash on every repeat. That is clever, and it is where cnfast is most impressive.
But reaching it means rewriting every cn() call site into a template literal. For an existing shadcn codebase, that is thousands of edits, and the shadcn primitives themselves use the call form, so you do not even own those call sites. On top of that, V8 already caches the arguments of the plain call form, which is a big reason the template form is only about 25% ahead of the call form in my Node run rather than multiples ahead. So the headline 7x is real, and it is also the least reachable number in a real migration.
There is an open cnfast issue where its ClassValue type clashes with clsx’s ClassDictionary and breaks className-as-render-function usage in Radix and Base UI primitives. I went looking for it. With cnfast 0.1.0 and my shadcn plus Base UI component set, TypeScript stayed green. Object syntax, arrays, and mixed inputs all type-checked; no runtime errors.
That does not mean you are safe. It likely only surfaces with specific primitive patterns, like Slot components that pass className as a render function, which my dashboard did not exercise. If you hit it, the workaround is to cast at the problem call site or keep the old cn for those specific files while using cnfast everywhere else.
Here is my read, from one developer to another.
cn()-heavy hot path, thousands of calls per frame, and you have already profiled your slowdown down to tailwind-merge specifically. That is a narrow, real case, and cnfast will helpcnfast does exactly what it says on the tin. It is a faster cn() with byte-identical output; the microbenchmark numbers are real and impressive, and the correctness is airtight across 351 nasty test cases. I have no complaints about the engineering. It is clean, careful work.
The catch is that cn() was never the bottleneck in a React render, so in a real app the speedup is mostly invisible. It is a beautifully executed optimization of something that was not slowing you down. If you like it and the extra kilobyte does not bother you, install it and move on, because the output is identical and there is no correctness risk. Just install it because it is neat, not because your users will feel it.
My bold prediction: the real value of cnfast might not be the milliseconds at all. It might be that it got a few thousand of us to open a flame graph for the first time in months and finally look at where our renders are actually spending their time. Mine were not spending it in cn(). I would bet yours are not either.
Install LogRocket via npm or script tag. LogRocket.init() must be called client-side, not
server-side
$ npm i --save logrocket

// Code:

import LogRocket from 'logrocket';
LogRocket.init('app/id');
// Add to your HTML:

<script src="https://cdn.lr-ingest.com/LogRocket.min.js"></script>
<script>window.LogRocket && window.LogRocket.init('app/id');</script>

Explore Vercel’s vgpu, a WebGPU library for AI agents. Learn to build a dynamic shader in Next.js and validate rendering output with headless testing in Node.js.

Compare some of the best Node.js unit testing frameworks in 2023, including Mocha, Jest, Supertest, and Webdriver.

Explore the most useful React date and time pickers, such as the Material Design date and time pickers, React DayPicker, and React-Date-Picker.

Explore how looping Transformers reuse layers and compare with traditional GPT models in reasoning tasks.
Hey there, want to help make our blog better?
Join LogRocket’s Content Advisory Board. You’ll help inform the type of content we create and get access to exclusive meetups, social accreditation, and swag.
Sign up now

 Learn more →