Imagine the following scenario: You shipped 15 winning A/B tests, each showing a decent lift. You proudly announced numerous winners, received plenty of compliments from leadership, and high-fived everyone in the following retro.

A couple of months later, you look at company metrics and barely notice any difference.
After 15 winning experiments, you demonstrated nearly zero business impact. Something is off. And one of those things might be the novelty effect.
If this scenario sounds familiar, you’re in the right place. This article unpacks how to catch the novelty effect before it distorts your A/B test results.
Users almost always react to change one way or another.
A new modal? A different checkout button? An updated layout? These grab attention and prompt users to click simply because they’re new.
Attention spikes, clicks go up, but then the attention fades. Users already “tested that new thing,” and it’s not new anymore. The heightened impact of the change starts to slowly decay.
Sometimes it’ll baseline on a higher number than before. You’ll have a winner, just not as big as you expected. Other times, it might go back to the previous baseline, leading to no long-lasting impact altogether.
However, many PMs don’t see that moment because they’re already three experiments ahead. In these cases, your data didn’t lie to you — you just used it wrong.
This gets especially ugly when you’re running experiments at scale.
At one point, we ran two to three experiments a week. It was a well-run program by any reasonable standard. Individual experiments kept winning, but the company metrics didn’t budge.
Here’s what was happening: each win was partly (sometimes mostly) novelty-driven. By the time we shipped our 13th experiment, the 3rd experiment lift had already decayed back to the baseline. We were filling a leaky bucket, with each new experiment giving us a nice boost in metrics that lasted for a couple of days.
The more proficient you are at rapid experimentation, the harder it is to reliably move business metrics up.
Now that we’ve identified the problem, let’s take a look at how to manage it. There are three main things you should do to reliably understand the long-term impact of your experiments.
After declaring a winner, it’s worth keeping some percentage of your users in the old experience for a couple more weeks. Even one to two percent of traffic gives you a long-term comparison. Instead of comparing control versus challenger in week one after making the change, compare them in week five when the novelty is no longer there.
A/B tests are most reliable when exposed to new users. They don’t know the product, don’t know the difference, and aren’t biased. The novelty doesn’t hit there.
Of course, you can’t just focus on new users and ignore the impact on your current users. But if the total impact of your experiment is 10 percent, while the impact on new users is a three percent lift, then odds are the total result will decay over time and stabilize at around a three percent lift.
It’s easy to declare a winner, call it a day, and focus on the new experiment. But are you in the business of winning experiments or creating long-term impact?
Track the key metrics your experiment impacted over time, including their year-over-year differences. The goal of your experiments is to make and maintain an impact — not to just win in a two-week timeframe.
Track your winning metric for four to eight weeks after launch. Genuine improvement holds flat or even strengthens as more users adopt the behavior.
A novelty-driven win has a clear shape: sharp lift in week one, slow decline toward baseline by week four. Once you start plotting these curves, you’ll be uncomfortable with how many of your “wins” have that shape.
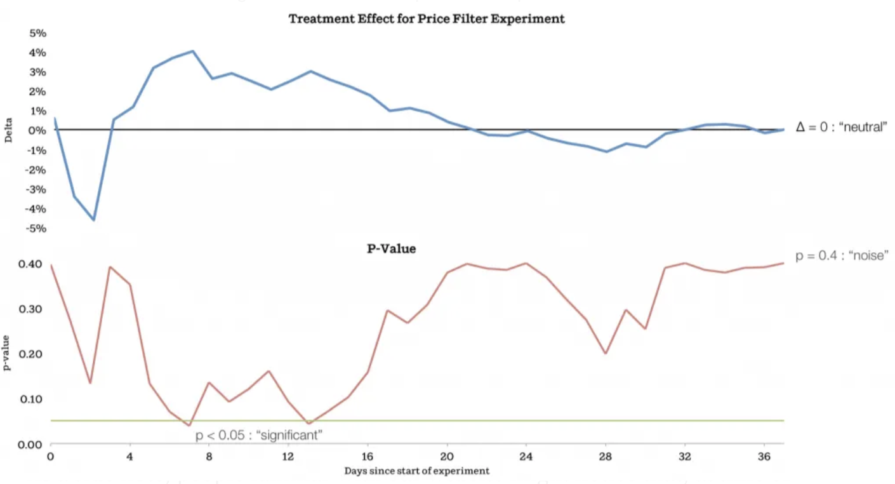
As we’ve already established, most teams call it a day way too early, often when they reach statistical significance. The truth is, statistical significance tells you the probability of your results being noise versus a result of your change, but it doesn’t tell you whether the results (or the significance itself) will persist over time.
The Airbnb price filter experiment is a great example. The results were “significant” at day seven and day 14. Normally, teams would stop the test and call it a winner.
But Airbnb kept it running to accommodate the novelty effect. It turned out that even though the A/B test was statistically significant at first, it was just noise with no real long-term impact:
It’s not a joking matter. At one company I worked at, we dramatically changed our monetization model, which increased friction. Our revenue went up by 30 percent, and engagement didn’t budge.
We normalized. Long story short, six months later, we realized it killed our business — users were annoyed after a couple of weeks but it took us half a year to learn it.
It doesn’t mean you need to wait for six months every time. Based on my experience, I’d split the post-experiment analysis into three main groups.
New features, user journey tweaks, UI, and layout changes. These usually give results quickly — users get excited at first and easily move on.
My recommendation would be to keep the experiment live for at least two business cycles (usually two weeks), and then maintain a holdout for another two to four cycles to monitor decay.
Although, you might want to keep more business cycles for more drastic redesigns. I remember the amount of complaining and anger every time Facebook/Meta had a major redesign. I was one of them. Today, I don’t even think about going back to the old rough version of Facebook.
Pricing and monetization changes take longer to show their effect. Pricing changes almost always have a positive novelty effect — attracting hesitant users when you decrease the price, or motivating anxious users to buy, fearing another price increase.
On top of that, some users take longer to react. We don’t usually cancel our subscription on day one when the price or packaging changes, but we might after we notice a higher charge on our card.
Here’s my rule of thumb: run those for a month as a minimum, and maintain a holdout group for another one to two months.
Pricing is where a small tweak can lead to a major impact, both positive and negative, so don’t rush.
Changes that impact the whole experience dramatically include:
It takes months for users to truly experience the new model and figure out if they love or hate it. Of course, you can’t wait that long for decisions.
My recommendation is to refrain from making any decisions for at least a month, and then maintain a significant control variant (around five percent of traffic) for the next couple of months, including both new and old users.
Even if you make a strategic decision and there’s no coming back, monitoring the long-term difference will give you more insights regarding what works and what doesn’t, and how to further optimize the new model.
Don’t focus on win rate and A/B test results. Focus on long-term impact.
Build expanded holdout groups for the tests you run and monitor key metrics even after you declare a winner. This’ll tell you which types of changes make an actual long-term improvement and which ones are just noise.
You’ll learn that a lot of your experiments have much lower impact than you initially expected. Painful as it is, the best way to build great products is to be brutally honest with yourself and ask about facts and key metrics.
At the end of the day, A/B test results without long-term tracking are just a vanity metric.
Featured image source: IconScout
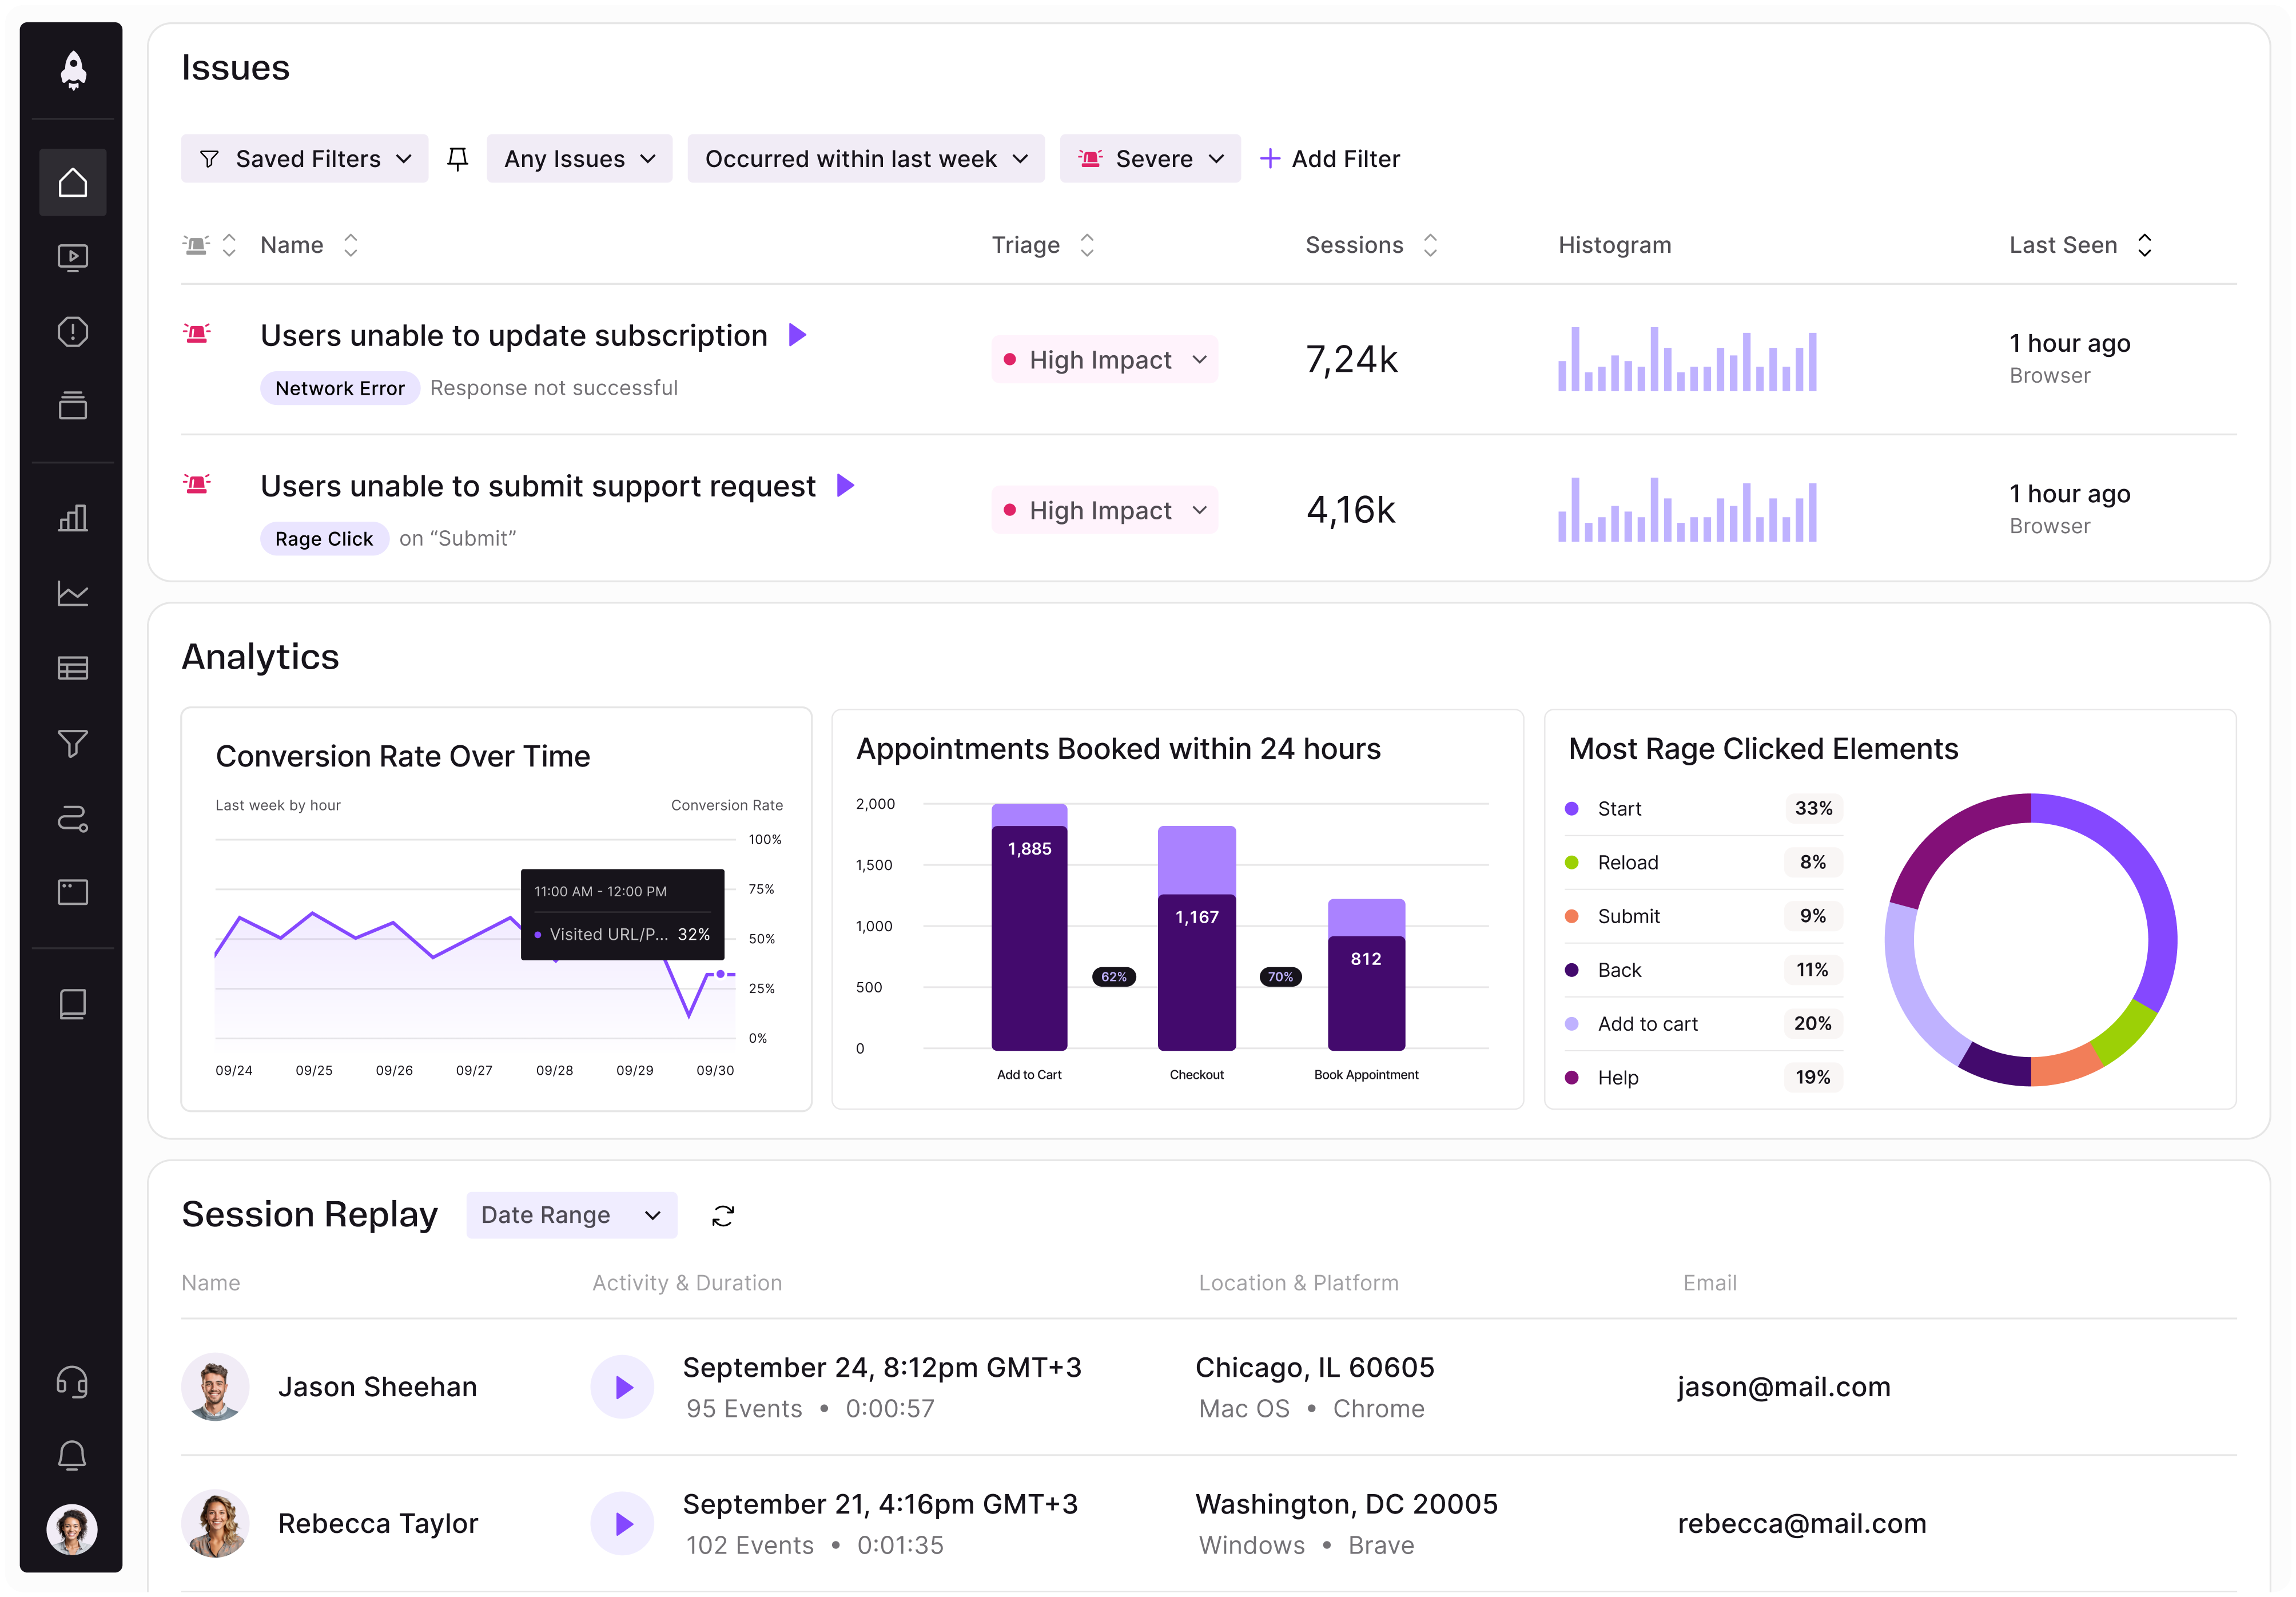
LogRocket identifies friction points in the user experience so you can make informed decisions about product and design changes that must happen to hit your goals.
With LogRocket, you can understand the scope of the issues affecting your product and prioritize the changes that need to be made. LogRocket simplifies workflows by allowing Engineering, Product, UX, and Design teams to work from the same data as you, eliminating any confusion about what needs to be done.
Get your teams on the same page — try LogRocket today.

Learn when streaks improve retention, when they create fragile engagement, and how PMs can design healthier systems around user progress.
A technical debt register brings transparency and clarity as to what type and how much debt you have and can be used to monitor and review your debt ratio.

Memos don’t have to be complicated. Just keep them clear, concise, and focused on actionable items. More on that in this blog.

Learn how tech PMs can take over inherited products, gather context, clean up backlogs, find quick wins, and make smarter decisions.


