Data science and visualization tutorials often begin by referencing an existing dataset. However, it’s often the case that we need or want to create our own dataset. So let’s take a few steps back and think about how we can create one using Python and a few of its popular packages!

import requests
import lxml.html
import pandas as pd
Let’s begin with a quick tour of the packages themselves:
Requests, a simple HTTP library, and one of the most downloaded Python packages in existencelxml, a feature-rich library for processing XML and HTMLpandas, a powerful data manipulation library with useful structuresNone of these packages are esoteric, difficult to use, or difficult to get access to. It’s safe to say that learning about them is a worthwhile investment.
So, let’s bring these tools together and automate the creation of a movie dataset based on the current IMDb Top 1000.
Here’s the data from the IMDb Top 1000 list.
By default, we’re presented with 50 movies per page that have been ordered by (ascending) popularity.
With some modifications to our request, we can change it to 200 movies per page that have been ordered by (descending) user rating.
If we visit the page and inspect the source of the movie items, we can see they each appear within div elements with the classes lister-item and mode-advanced.
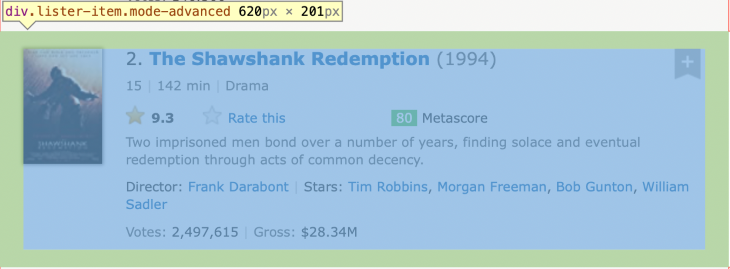
The XPath to locate these nodes is //div[contains(@class, 'lister-item mode-advanced')].
Using our web inspector, let’s get the XPath for movie features of interest. The idea here is to find points of reference for navigating the HTML document that allow us to extract the data we need. Relative to each movies node above, these are:
.//h3[@class="lister-item-header"]//a/@href.//h3[@class="lister-item-header"]//a/text().//div[@class="lister-item-image float-left"]//a//img/@loadlate.//div[@class="inline-block ratings-imdb-rating"]//strong/text().//span[@class="genre"]//text().//p[@class="sort-num_votes-visible"]//span[last()]/text()Let’s put our preparation into practice and get the data for the second-place movie, The Shawshank Redemption, into a few variables.
First, we’ll use the requests package to retrieve the HTML source for the first page of 200 movies.
url = "https://www.imdb.com/search/title/?groups=top_1000&sort=user_rating,desc&count=200"
response = requests.get(url)
content = response.content
With that, we’ve retrieved a response to our GET request and stored the content in our content variable. We could check if our response was successful by looking at the response code, where a response code of 200 means everything went OK.
print(response.status_code)
200
Looking good! Next, we’ll parse our HTML content with lxml so that we can start processing it.
html = lxml.html.fromstring(content)
We can start using our XPath expressions from earlier to select nodes. Let’s select every parent div element that we know stores the data for our movies.
items = html.xpath("//div[contains(@class, 'lister-item mode-advanced')]")
We should expect 200 movies per page, so let’s double-check if that corresponds to the length of the list we just selected:
print(len(items))
200
Great! Now let’s select the div that contains all of the data for The Shawshank Redemption. We know it placed second in the IMDb Top 1000, so we’ll try indexing the second item.
item = items[1]
Finally, let’s extract the data for every feature we prepared for earlier.
name = item.xpath('.//h3[@class="lister-item-header"]//a/text()')[0]
thumbnail = item.xpath('.//div[@class="lister-item-image float-left"]//a//img/@loadlate')[0]
rating = item.xpath('.//div[@class="inline-block ratings-imdb-rating"]//strong/text()')[0]
genre = item.xpath('.//span[@class="genre"]//text()')[0].strip()
gross = item.xpath('.//p[@class="sort-num_votes-visible"]//span[last()]/text()')[0].strip()
gross = gross if "$" in gross else "N/A"
url = "https://www.imdb.com" + item.xpath('.//h3[@class="lister-item-header"]//a/@href')[0]
To clean the data, some additional wrangling for the features is required:
url: the paths were relative, so they have been prefixed with the protocol and domain name, https://www.imdb.comgenre and gross had unwanted whitespace before/after the desired string, so these were stripped out with Python’s .strip()gross was not always present, but when it was, it was always in dollars. So, we’ll check for the presence of the $ character and list the gross as not available if it’s missingLet’s print all these out to see how we did!
print(f"{name=}")
print(f"{thumbnail=}")
print(f"{rating=}")
print(f"{genre=}")
print(f"{gross=}")
print(f"{url=}")

name='The Shawshank Redemption'
thumbnail='https://m.media-amazon.com/images/M/MV5BMDFkYTc0MGEtZmNhMC00ZDIzLWFmNTEtODM1ZmRlYWMwMWFmXkEyXkFqcGdeQXVyMTMxODk2OTU@._V1_UX67_CR0,0,67,98_AL_.jpg'
rating='9.3'
genre='Drama'
gross='$28.34M'
url='https://www.imdb.com/title/tt0111161/'
Perfect! We’ve also taken this opportunity to highlight a useful feature of Python f-strings, which allows us to print the expression, the equals sign, and then the evaluated expression!
We’ve done everything once for a single movie, so let’s move on to automating things for all 1000 of them.
When visiting the IMDB Top 1000 pages above and clicking the Next button, we are taken to this page.
We can see the key difference here is the inclusion of a start parameter, which is set to start at 201. This will be the key to automating the retrieval of all 1000 movies, so we will parameterize this in our upcoming loop.
items = []
for start in range(1,1000,200):
    url = f"https://www.imdb.com/search/title/?groups=top_1000&sort=user_rating,desc&count=200&start={start}&ref_=adv_nxt"
    response = requests.get(url)
    content = response.content
    html = lxml.html.fromstring(content)
    items += html.xpath("//div[contains(@class, 'lister-item mode-advanced')]")
Here, we’ve updated the same code from earlier by placing it in a loop that goes from 1 to 1000 in intervals of 200. This value is fed into the start parameter that we’ve just discovered, and we’ve appended the movies to our items list 200 at a time. Let’s check the length of the list to be sure.
print(len(items))
1000
We’re nearly there! Now for our DataFrame. Let’s start by creating an empty DataFrame with our desired columns.
data = pd.DataFrame(columns=['name', 'thumbnail', 'rating', 'genre', 'gross', 'thumbnail', 'url'])
All that’s left now is to loop through our retrieved movie items and append our data to our DataFrame.
for item in items:
    name = item.xpath('.//h3[@class="lister-item-header"]//a/text()')[0]
    thumbnail = item.xpath('.//div[@class="lister-item-image float-left"]//a//img/@loadlate')[0]
    rating = item.xpath('.//div[@class="inline-block ratings-imdb-rating"]//strong/text()')[0]
    genre = item.xpath('.//span[@class="genre"]//text()')[0].strip()
    gross = item.xpath('.//p[@class="sort-num_votes-visible"]//span[last()]/text()')[0].strip()
    gross = gross if "$" in gross else "N/A"
    url = "https://www.imdb.com" + item.xpath('.//h3[@class="lister-item-header"]//a/@href')[0]


    data = data.append({'name': name, 'thumbnail': thumbnail, 'rating': rating, 'genre': genre, 'gross': gross, 'url': url}, ignore_index=True)
We can see a sample of our newly generated dataset by displaying the first 10 rows.
data.head(10)
| “` |
name |
thumbnail |
rating |
genre |
gross |
thumbnail |
url |
| 0 | Jai Bhim | https://m.media-amazon.com/images/M/MV5BY2Y5ZW… | 9.5 | Crime, Drama | N/A | https://m.media-amazon.com/images/M/MV5BY2Y5ZW… | https://www.imdb.com/title/tt15097216/ |
| 1 | The Shawshank Redemption | https://m.media-amazon.com/images/M/MV5BMDFkYT… | 9.3 | Drama | $28.34M | https://m.media-amazon.com/images/M/MV5BMDFkYT… | https://www.imdb.com/title/tt0111161/ |
| 2 | The Godfather | https://m.media-amazon.com/images/M/MV5BM2MyNj… | 9.2 | Crime, Drama | $134.97M | https://m.media-amazon.com/images/M/MV5BM2MyNj… | https://www.imdb.com/title/tt0068646/ |
| 3 | Soorarai Pottru | https://m.media-amazon.com/images/M/MV5BOGVjYm… | 9.1 | Drama | N/A | https://m.media-amazon.com/images/M/MV5BOGVjYm… | https://www.imdb.com/title/tt10189514/ |
| 4 | The Dark Knight | https://m.media-amazon.com/images/M/MV5BMTMxNT… | 9.0 | Action, Crime, Drama | $534.86M | https://m.media-amazon.com/images/M/MV5BMTMxNT… | https://www.imdb.com/title/tt0468569/ |
| 5 | The Godfather: Part II | https://m.media-amazon.com/images/M/MV5BMWMwMG… | 9.0 | Crime, Drama | $57.30M | https://m.media-amazon.com/images/M/MV5BMWMwMG… | https://www.imdb.com/title/tt0071562/ |
| 6 | 12 Angry Men | https://m.media-amazon.com/images/M/MV5BMWU4N2… | 9.0 | Crime, Drama | $4.36M | https://m.media-amazon.com/images/M/MV5BMWU4N2… | https://www.imdb.com/title/tt0050083/ |
| 7 | Sardar Udham | https://m.media-amazon.com/images/M/MV5BZGFhNT… | 8.9 | Biography, Crime, Drama | N/A | https://m.media-amazon.com/images/M/MV5BZGFhNT… | https://www.imdb.com/title/tt10280296/ |
| 8 | The Lord of the Rings: The Return of the King | https://m.media-amazon.com/images/M/MV5BNzA5ZD… | 8.9 | Action, Adventure, Drama | $377.85M | https://m.media-amazon.com/images/M/MV5BNzA5ZD… | https://www.imdb.com/title/tt0167260/ |
| 9 | Pulp Fiction | https://m.media-amazon.com/images/M/MV5BNGNhMD… | 8.9 | Crime, Drama | $107.93M | https://m.media-amazon.com/images/M/MV5BNGNhMD… | https://www.imdb.com/title/tt0110912/ |
All done! It may be useful to save this to a CSV file at this point.
data.to_csv('data.csv')
Let’s interrogate our data a little bit. We’ll start with a histogram of the ratings.
data.rating.hist()
<AxesSubplot:>
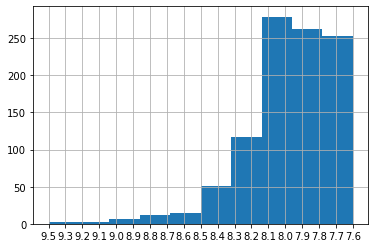
We could also check out some summary statistics.
data.rating.astype(float).describe()

count    1000.000000
mean        7.968300
std         0.280292
min         7.600000
25%         7.700000
50%         7.900000
75%         8.100000
max         9.500000
Name: rating, dtype: float64
As a bonus, we have some interesting data in the Genre column, which we could use to build a co-occurrence matrix.
We’ll use the itertools package to give us some extra functions for dealing with iterators.
import itertools
Now, let’s wrangle our genres! First, split the genres into lists.
data['genre'] = data['genre'].str.split(",")
Then, clean the data of any whitespace.
for index, row in data.iterrows():
    genre = [x.strip(' ') for x in row.genre]
    row.genre = genre
We’ll build a list of each unique genre and sort them alphabetically:
genres = [st for row in data.genre for st in row]
genres = set(genres)
genres = sorted(genres)
Then, we construct our co-occurrence matrix.
matrix = pd.DataFrame(0, columns=genres, index=genres)

for index, row in data.iterrows():
    if len(row.genre) == 1:
        matrix[row.genre[0]][row.genre[0]] += 1
    else:
        for genre in list(itertools.combinations(row.genre, 2)):
            matrix[genre[0]][genre[1]] += 1
            matrix[genre[1]][genre[0]] += 1
Which, if we’re curious, looks like the following.
matrix
| “` |
Action |
Adventure |
Animation |
Biography |
Comedy |
Crime |
Drama |
Family |
Fantasy |
Film-Noir |
… |
Horror |
Music |
Musical |
Mystery |
Romance |
Sci-Fi |
Sport |
Thriller |
War |
Western |
| Action | 0 | 85 | 19 | 10 | 22 | 51 | 84 | 1 | 8 | 0 | … | 3 | 0 | 0 | 9 | 3 | 30 | 2 | 24 | 7 | 3 |
| Adventure | 85 | 0 | 55 | 9 | 56 | 4 | 59 | 15 | 21 | 1 | … | 2 | 0 | 0 | 5 | 3 | 30 | 0 | 10 | 6 | 7 |
| Animation | 19 | 55 | 0 | 3 | 34 | 4 | 23 | 15 | 10 | 0 | … | 0 | 0 | 0 | 1 | 1 | 2 | 0 | 0 | 1 | 0 |
| Biography | 10 | 9 | 3 | 0 | 9 | 20 | 100 | 4 | 0 | 0 | … | 0 | 7 | 0 | 0 | 1 | 0 | 8 | 3 | 1 | 0 |
| Comedy | 22 | 56 | 34 | 9 | 13 | 31 | 121 | 11 | 13 | 1 | … | 4 | 8 | 4 | 3 | 48 | 4 | 1 | 4 | 8 | 1 |
| Crime | 51 | 4 | 4 | 20 | 31 | 0 | 157 | 0 | 2 | 10 | … | 2 | 1 | 1 | 35 | 5 | 1 | 1 | 42 | 0 | 0 |
| Drama | 84 | 59 | 23 | 100 | 121 | 157 | 88 | 24 | 31 | 15 | … | 15 | 33 | 11 | 66 | 109 | 29 | 18 | 78 | 45 | 13 |
| Family | 1 | 15 | 15 | 4 | 11 | 0 | 24 | 0 | 14 | 0 | … | 0 | 0 | 4 | 0 | 0 | 1 | 2 | 0 | 0 | 0 |
| Fantasy | 8 | 21 | 10 | 0 | 13 | 2 | 31 | 14 | 0 | 0 | … | 2 | 2 | 1 | 4 | 8 | 1 | 0 | 0 | 1 | 0 |
| Film-Noir | 0 | 1 | 0 | 0 | 1 | 10 | 15 | 0 | 0 | 0 | … | 0 | 0 | 0 | 5 | 2 | 0 | 0 | 3 | 0 | 0 |
| History | 3 | 5 | 0 | 25 | 0 | 2 | 49 | 0 | 0 | 0 | … | 0 | 1 | 0 | 1 | 2 | 0 | 0 | 4 | 6 | 0 |
| Horror | 3 | 2 | 0 | 0 | 4 | 2 | 15 | 0 | 2 | 0 | … | 2 | 0 | 0 | 7 | 0 | 7 | 0 | 13 | 0 | 0 |
| Music | 0 | 0 | 0 | 7 | 8 | 1 | 33 | 0 | 2 | 0 | … | 0 | 0 | 3 | 1 | 9 | 0 | 0 | 0 | 0 | 0 |
| Musical | 0 | 0 | 0 | 0 | 4 | 1 | 11 | 4 | 1 | 0 | … | 0 | 3 | 0 | 0 | 2 | 0 | 1 | 0 | 0 | 0 |
| Mystery | 9 | 5 | 1 | 0 | 3 | 35 | 66 | 0 | 4 | 5 | … | 7 | 1 | 0 | 0 | 9 | 8 | 0 | 31 | 2 | 0 |
| Romance | 3 | 3 | 1 | 1 | 48 | 5 | 109 | 0 | 8 | 2 | … | 0 | 9 | 2 | 9 | 0 | 2 | 0 | 3 | 5 | 0 |
| Sci-Fi | 30 | 30 | 2 | 0 | 4 | 1 | 29 | 1 | 1 | 0 | … | 7 | 0 | 0 | 8 | 2 | 0 | 0 | 5 | 0 | 0 |
| Sport | 2 | 0 | 0 | 8 | 1 | 1 | 18 | 2 | 0 | 0 | … | 0 | 0 | 1 | 0 | 0 | 0 | 0 | 0 | 0 | 0 |
| Thriller | 24 | 10 | 0 | 3 | 4 | 42 | 78 | 0 | 0 | 3 | … | 13 | 0 | 0 | 31 | 3 | 5 | 0 | 1 | 3 | 1 |
| War | 7 | 6 | 1 | 1 | 8 | 0 | 45 | 0 | 1 | 0 | … | 0 | 0 | 0 | 2 | 5 | 0 | 0 | 3 | 0 | 1 |
| Western | 3 | 7 | 0 | 0 | 1 | 0 | 13 | 0 | 0 | 0 | … | 0 | 0 | 0 | 0 | 0 | 0 | 0 | 1 | 1 | 4 |
Notice the size: 21 rows × 21 columns
Finally, we will use Plotapi to create an interactive Chord diagram with our data!
from plotapi import Chord

Chord.set_license("your username", "your license key")

Chord(matrix.values.tolist(), genres, colors="movies").show()
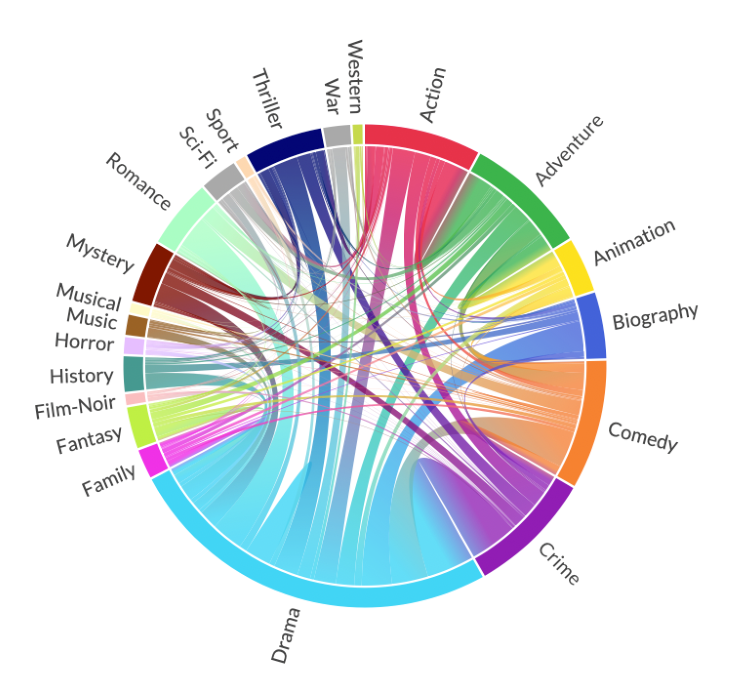
There you have it! In this article, we have gone through the journey of dataset creation to visualization. We completed all these steps using Python, and relied entirely on popular and well-maintained packages, lxml and pandas.
Knowing how to create our own dataset from existing sources is exceptionally useful, and it’s sometimes the only option when an API or data dump has not been made available.
From here, we could grow our IMDb dataset by including the actors that starred in each movie, or visit another data source and practice our new data retrieval, processing, and visualization skills there. Here are some examples that use the same techniques: Co-occurrence of Pokemon Types, Co-occurrence of Animal Crossing Villager Species and Personality, and Retrieving JSON with the requests package.
Install LogRocket via npm or script tag. LogRocket.init() must be called client-side, not
server-side
$ npm i --save logrocket

// Code:

import LogRocket from 'logrocket';
LogRocket.init('app/id');
// Add to your HTML:

<script src="https://cdn.lr-ingest.com/LogRocket.min.js"></script>
<script>window.LogRocket && window.LogRocket.init('app/id');</script>

Discover how React Fiber works under the hood. Learn how React builds the DOM, handles concurrent rendering, and works alongside React 19 features and the new React Compiler.

Learn how to use Skybridge, an open-source React framework, to build and deploy cross-platform AI apps and interactive UI widgets for ChatGPT, Claude, and MCP clients from a single codebase.

Learn how to set up Meilisearch, index documents, and build keyword, semantic, and hybrid search with AI-powered retrieval.
Compare pnpm and npm across security defaults, disk usage, dependency strictness, and workspace policy to decide which package manager fits your project.
Would you be interested in joining LogRocket's developer community?
Join LogRocket’s Content Advisory Board. You’ll help inform the type of content we create and get access to exclusive meetups, social accreditation, and swag.
Sign up now