A chart is a graphical representation of data that is used to make a dataset more easily readable, and its parts more easily distinguished. While most users are used to seeing charts that appear concise and formalized, some users prefer charts that appear hand drawn or sketched. That’s where roughViz comes in.
roughViz is a JavaScript library built on top of D3.js and Rough.js. The library is designed to help build charts that appear to be sketched or hand drawn, like in the example below.
In this guide, you will learn how to display sketch-like charts in your Vue.js applications using vue-roughviz, and how to configure a Vue application using vue-cli.
This tutorial assumes the following prerequisites:
If you do not have vue-cli installed already, run the following command to install the latest version.
npm install -g @vue/cli
# OR
yarn global add @vue/cli
Now, create a new vue application:
vue create my-app
Note: This process might take a couple of minutes. Once it’s done, we can move into our new application root directory:
cd my-app
The process detailed above creates a new Vue.js application. To be sure everything is well set up, run npm run serve. You should see the “Welcome to Your Vue.js app page” displayed in your browser when you visit http://localhost:8080.
vue-roughviz is a Vue.js wrapper for roughViz.js. This makes the library accessible as components, which allows for seamless reusability in a Vue.js based project.
To include vue-roughviz in our project, run:
npm install vue-roughviz
vue-roughviz provides components for all of roughViz’s chart styles, which include:
roughBar– roughViz bar-chart componentroughBarH– roughViz horizontal bar-chart componentroughDonut– roughViz donut chart componentroughPie– roughViz pie chartroughLine– roughViz line chart componentroughScatter– roughViz scattered chart componentroughStackedBar– roughViz stacked bar chart componentOnce you have added vue-roughviz to your project, the next step is to open the project folder in your preferred text editor.
When you open up the src/App.vue file, the initial content should be similar to the image below:
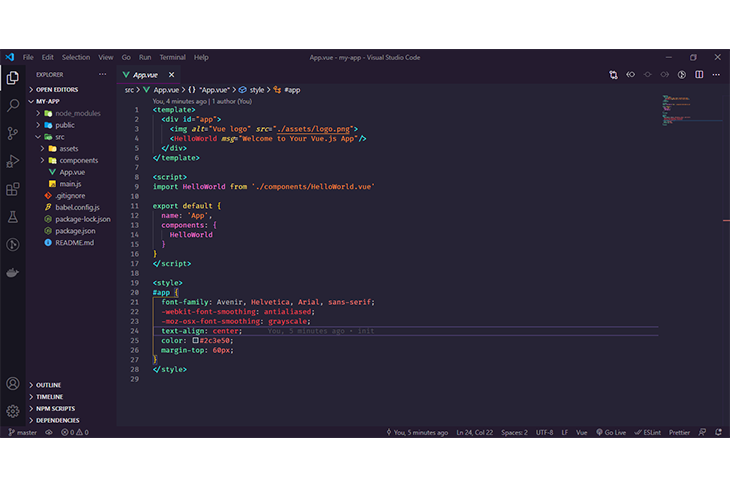
If your view looks like the above, go ahead and delete all of its contents and replace with the following code:
<template>
  <div id="app">
    <rough-bar
      :data="{
        labels: ['North', 'South', 'East', 'West'],
        values: [10, 5, 8, 3],
      }"
      title="Regions"
      roughness="8"
      :colors="['red', 'orange', 'blue', 'skyblue']"
      stroke="black"
      stroke-width="3"
      fill-style="cross-hatch"
      fill-weight="3.5"
      class="d-inline"
    />
  </div>
</template>

<script>
import { RoughBar } from "vue-roughviz";
export default {
  name: "App",
  components: {
    RoughBar,
  },
};
</script>
import ... – this line is to import roughBar components from the vue-roughviz we installed earlier.export default {} – this block is to make the former imported component (roughBar) available for use in our app.<rough-bar :data="[...]" /> – here is where we are invoking the external roughBar component. The attributes specified in these components are the required props. If you are not familiar with single file components, you might want to check out this guide.The only required props is data, which refers to the data with which to construct charts. This can either be a string or an object.
If you choose an object, the object must contain labels and values keys. If you use a string instead, the string must be a url to either a csv or tsv file. Within this file, you must also specify the labels and values as separate attributes that represent each column.
Other useful props includes:
title – to specify the chart titleroughness – roughness level of chartstroke – color of the bar strokestroke-width – size of bar strokefill-weight – to specify the weight of inner path color.fill-style – bar-fill style, which can be one of the following:
dashedsolidzigzag-linecross-hatchhachurezigzagVisit here for list of all supported props.
To preview our app, run npm run serve. If you have followed the steps above correctly, visiting http://localhost:8080 should allow you to see the charts displayed in your browser.
Let’s run a little experiment where we display the price history of bitcoin for the past 10 days in our chart instead. For this experiment, we will be making use of Coingecko API.
Why Coingecko? Unlike other cryptocurrency API, Coingecko is free and requires no API key to get started, which is ideal for our experiment.
Go ahead and replace src/App.vue with the code below
<template>
  <div id="app">
    <div class="d-inline-block">
      <rough-bar
        v-if="chartValue.length > 0"
        :data="{
          labels: chartLabel,
          values: chartValue,
        }"
        title="BTC - 10 Days"
        roughness="3"
        color="#ccc"
        stroke="black"
        stroke-width="1"
        fill-style="zig-zag"
        fill-weight="2"
      />
    </div>
  </div>
</template>

<script>
import { RoughBar } from "vue-roughviz";
export default {
  name: "App",
  components: {
    RoughBar,
  },
  data() {
    return {
      chartLabel: [],
      chartValue: [],
    };
  },
  methods: {
    async loadData() {
      await fetch(
        "https://api.coingecko.com/api/v3/coins/bitcoin/market_chart?vs_currency=usd&days=10&interval=daily"
      )
        .then((res) => res.json())
        .then((rawData) => {
          console.table(rawData.prices);
          rawData.prices.map((data) => {
            let date = new Date(data[0]).toDateString();
            let rPrice = data[1];
            console.log(`Price of 1btc on ${date} is ${rPrice}`);
            this.chartLabel.push(date);
            this.chartValue.push(rPrice);
          });
        })
        .catch((err) => console.error("Fetch error -> ", err));
    },
  },
  beforeMount() {
    this.loadData();
  },
};
</script>
The new changes made is – we created an asynchronous method loadData() which fetches bitcoin price history from coingecko API and looping through the returned data, we separated the date from the price, using the returned date as our chart label and the price as our chart value. And beforeMount() i.e before our app is mounted into view, we invoked the loadData() function we created earlier.
Running our app should, you should see the new changes made to our chart as below:
This article has explained charts and their uses, walked you through the process of creating a Vue app using vue-cli, and showed how to display sketch-like charts in your Vue.js applications using vue-roughviz.
If you are interested in learning more about or contributing to roughViz, visit the roughViz or vue-roughviz projects on GitHub. This tutorial source code is also available on GitHub here.
Debugging Vue.js applications can be difficult, especially when users experience issues that are difficult to reproduce. If you’re interested in monitoring and tracking Vue mutations and actions for all of your users in production, try LogRocket.
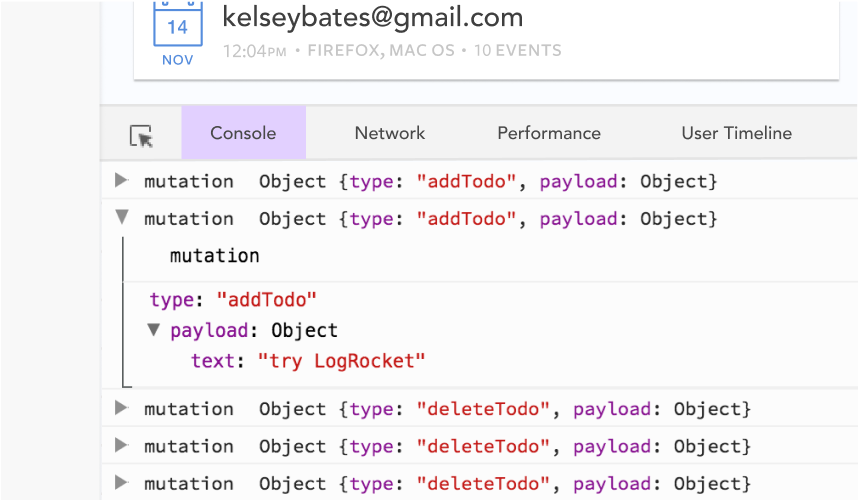
LogRocket lets you replay user sessions, eliminating guesswork by showing exactly what users experienced. It captures console logs, errors, network requests, and pixel-perfect DOM recordings — compatible with all frameworks.
With Galileo AI, you can instantly identify and explain user struggles with automated monitoring of your entire product experience.
Modernize how you debug your Vue apps — start monitoring for free.
Debug RSC hydration mismatches in production with Next.js instrumentation, Suspense isolation, HTML diffing, and CI smoke tests.
Explore why npm dependencies are a major supply chain security risk and how to protect JavaScript apps from compromised packages and transitive threats.

Enabled React Compiler v1.0 on a production Next.js app. Here’s every warning, breakage, and silent opt-out I documented — and what actually worked.

We built the same app in TanStack Start RSC and Next.js RSC. TanStack shipped 40% less JS and built 4x faster — but Next.js is still the safer production bet.
Would you be interested in joining LogRocket's developer community?
Join LogRocket’s Content Advisory Board. You’ll help inform the type of content we create and get access to exclusive meetups, social accreditation, and swag.
Sign up now