
Not long ago, I led a research project where we interviewed around 6–12 users and ran a small survey. People described similar frustrations, so we synthesized the findings and presented them to stakeholders.

“We can’t make business decisions from talking to just 6 or 12 people.”
The follow-up request was to interview 150 users. Before deciding whether to recruit more, we needed to clarify the decision. Did the team need to understand what was going wrong, estimate how often it happened, or determine whether a proposed change would help?
Key Takeaways
Editor’s note: We updated this guide in November 2026 to clarify the evidence behind the five-user usability estimate and the 6–12 interview finding. The revision adds a decision table for usability tests, interviews, surveys, and experiments, along with guidance on assessing saturation and covering distinct user groups, accessibility needs, rare failures, and high-risk tasks.
A small study can uncover a blocker and explain how it happens. A decision about how broadly to roll out a fix may also require an estimate of how often users encounter it. Both questions are useful, and they call for different evidence.
Start with the decision, the people it affects, and the cost of being wrong. A reversible prototype change can often move ahead after a focused round. A decision that affects access to a critical workflow needs wider coverage and stronger evidence.
The familiar five-user estimate comes from a model by Nielsen and Landauer for discovering usability problems. In Nielsen’s illustration, if each participant independently has a 31% chance of encountering a particular problem, five participants have about an 84% chance of encountering it at least once. The model illustrates why small formative rounds can surface common problems. The estimate changes with the users, tasks, and likelihood of seeing each issue. In Faulkner’s study, different groups of five uncovered markedly different shares of the problems found in the full study.
Interviews have a separate evidence base. Guest, Bunce, and Johnson analyzed 60 interviews with female sex workers in West Africa. In that dataset, roughly 70% of the eventual themes appeared in the first six interviews and 92% by the twelfth, as summarized in Guest, Namey, and Chen’s follow-up paper. A broader question or a more varied population can require more interviews, and a new participant can change your understanding of a theme even when the label is familiar.
When using inductive thematic analysis, record what each batch adds. Note new themes, contradictions, changes in interpretation, and gaps by segment. Define the initial batch, the number of interviews in each follow-up batch, and the threshold for new information. Document why you stopped and which groups or questions remain underexplored.
Tell stakeholders what the round covered, what you observed, and what remains uncertain. For example, you might have enough evidence to fix a confusing label in a prototype while still needing production data to estimate how often the label causes abandonment.
Use a short quote, task observation, or clip to show how the issue appeared. Report counts with their denominator and context. If 9 of 12 participants in a purposively recruited study struggled with onboarding, that describes those sessions. It does not establish that 75% of all customers will struggle.
If stakeholders need more confidence, agree on the gap first. Recruit an overlooked segment, test a revised design in another round, or plan a survey or experiment around the decision. Each option answers a different question.
Ask what additional evidence would justify acting. Agree on the scope, the stopping rule, and how the team will handle inconclusive findings before adding more sessions.
I asked UX practitioners how they scope studies and respond when stakeholders ask for more participants. Their experiences illustrate how recruitment choices depend on the question and the team’s decision.
“Patterns emerge early, more interviews don’t always mean more insight.”
— Chloe O’Keeffe, UX Consultant at Google
O’Keeffe described using seven to ten participants in her own work and discussing a separate quantitative study when stakeholders need quantitative evidence.
“Sometimes you go slightly larger not for insight, but for trust.”
— Okoro Lynda Chibugo, Senior Product Designer
“I try not to go too large because the majority of the time, you get repetitive answers. But depending on the team, I may use a slightly larger sample size to help them feel more confident in the research.”
Chibugo described using eight to fifteen participants in some studies and splitting larger requests into research cycles. These are examples of how two practitioners work, rather than sample-size targets for every study.
| Method | Research goal | What drives the sample size? | When to expand or stop |
|---|---|---|---|
| Formative usability testing | Find and diagnose barriers in a task. | Task coverage, distinct user groups, and consequences of failure. | Review after each round. Fix and retest recurring barriers, and add sessions for uncovered tasks or groups. |
| Interviews | Understand experiences, motivations, and workarounds. | Scope of the question, diversity of experiences, and how much new information each batch adds. | Continue while new sessions add decision-relevant insight or important perspectives remain missing. |
| Survey | Estimate a proportion or compare groups. | Target population, sampling design, desired precision, and subgroup needs. | Plan for usable responses overall and within each group you intend to report. |
| Randomized experiment | Estimate the effect of a change. | Baseline, smallest meaningful effect, significance level, power, and allocation. | Set the sample size and stopping rule before launch. Use a planned sequential design if you need to monitor results as they come in. |
For one narrow workflow and a reasonably similar group of users, five participants can be a practical starting round. Observe realistic tasks, log each issue with its severity and context, then fix and retest. If you need a task success rate with a stated level of precision, plan a separate measurement study.
When planning user interviews, recruit in batches and analyze as you go. For example, start with six interviews for a focused question, then review the next batch for new themes or competing explanations. Extend recruitment if the latest interviews still change the decision or if a relevant segment is missing. Record how you assessed coverage and saturation.
Choose the population, confidence level, and margin of error before estimating sample size. For a simple random sample from a large population, an estimated proportion near 50% needs about 385 completed responses for a 95% confidence interval with a margin of error of approximately ±5 percentage points. Adjust planning for the sampling design, nonresponse, and subgroup reporting. A large convenience sample can still be biased. NIST’s sample-size guidance explains the calculation.
Pick a primary metric and estimate its baseline or variability. Specify the smallest effect worth acting on, the significance level, the desired power, and how participants will be allocated. Use these inputs to calculate the sample per variant before launch. For example, a team with a 10% conversion baseline should decide whether a rise to 11% is worth detecting before calculating how much traffic it needs. Randomize at the appropriate unit and account for repeated observations or clustering where applicable.
For observational analytics, define the eligible population, time window, event instrumentation, and denominator. Check for missing events and differences in coverage across devices or segments. Analytics can estimate how often an instrumented event occurs in the observed population. A randomized experiment addresses whether a change caused a difference.
Plan coverage around differences that can change the result. Five desktop users repeating the same checkout problem tell you little about a mobile shopper navigating checkout with a screen reader. Recruit people who use relevant assistive technologies and test with their actual tools where possible. Track coverage by workflow, device, and user group.
For a rare failure, deliberately test the conditions that trigger it and use production evidence to estimate frequency when available. Under a simple independent model, an issue with a 5% chance of appearing in a session has only about a 23% chance of appearing at least once in five sessions. For high-risk tasks, test failure and recovery paths explicitly, review severe issues even if seen once, and set a higher evidence bar before release.
Choose the sample size by working backward from the decision. Use focused rounds to diagnose problems, purposeful recruitment to cover relevant experiences, survey precision to size estimates, and power calculations to plan experiments. When you report the result, say which people and tasks the evidence covers, what uncertainty remains, and what would justify another round.
Five can be a useful first round when you’re testing a narrow workflow with a similar group of users. Add sessions or run another round if you’ve missed important tasks or groups, or if you need to investigate rare or serious failures.
Start with a batch sized to your research question and recruit across the groups that matter to the decision. After each batch, review new themes, contradictions, and gaps in coverage. Keep recruiting when another round could change what you recommend.
Define what counts as new information and review it across batches. For a focused thematic analysis, you may be ready to stop when recent interviews add little that matters to the decision and you’ve covered the groups you planned to study. Document the evidence and any remaining gaps.
Size a survey for the precision you need in an estimate, such as a margin of error for a proportion. Size an A/B test for the power to detect the smallest effect worth acting on, given the baseline, significance level, and allocation across variants.
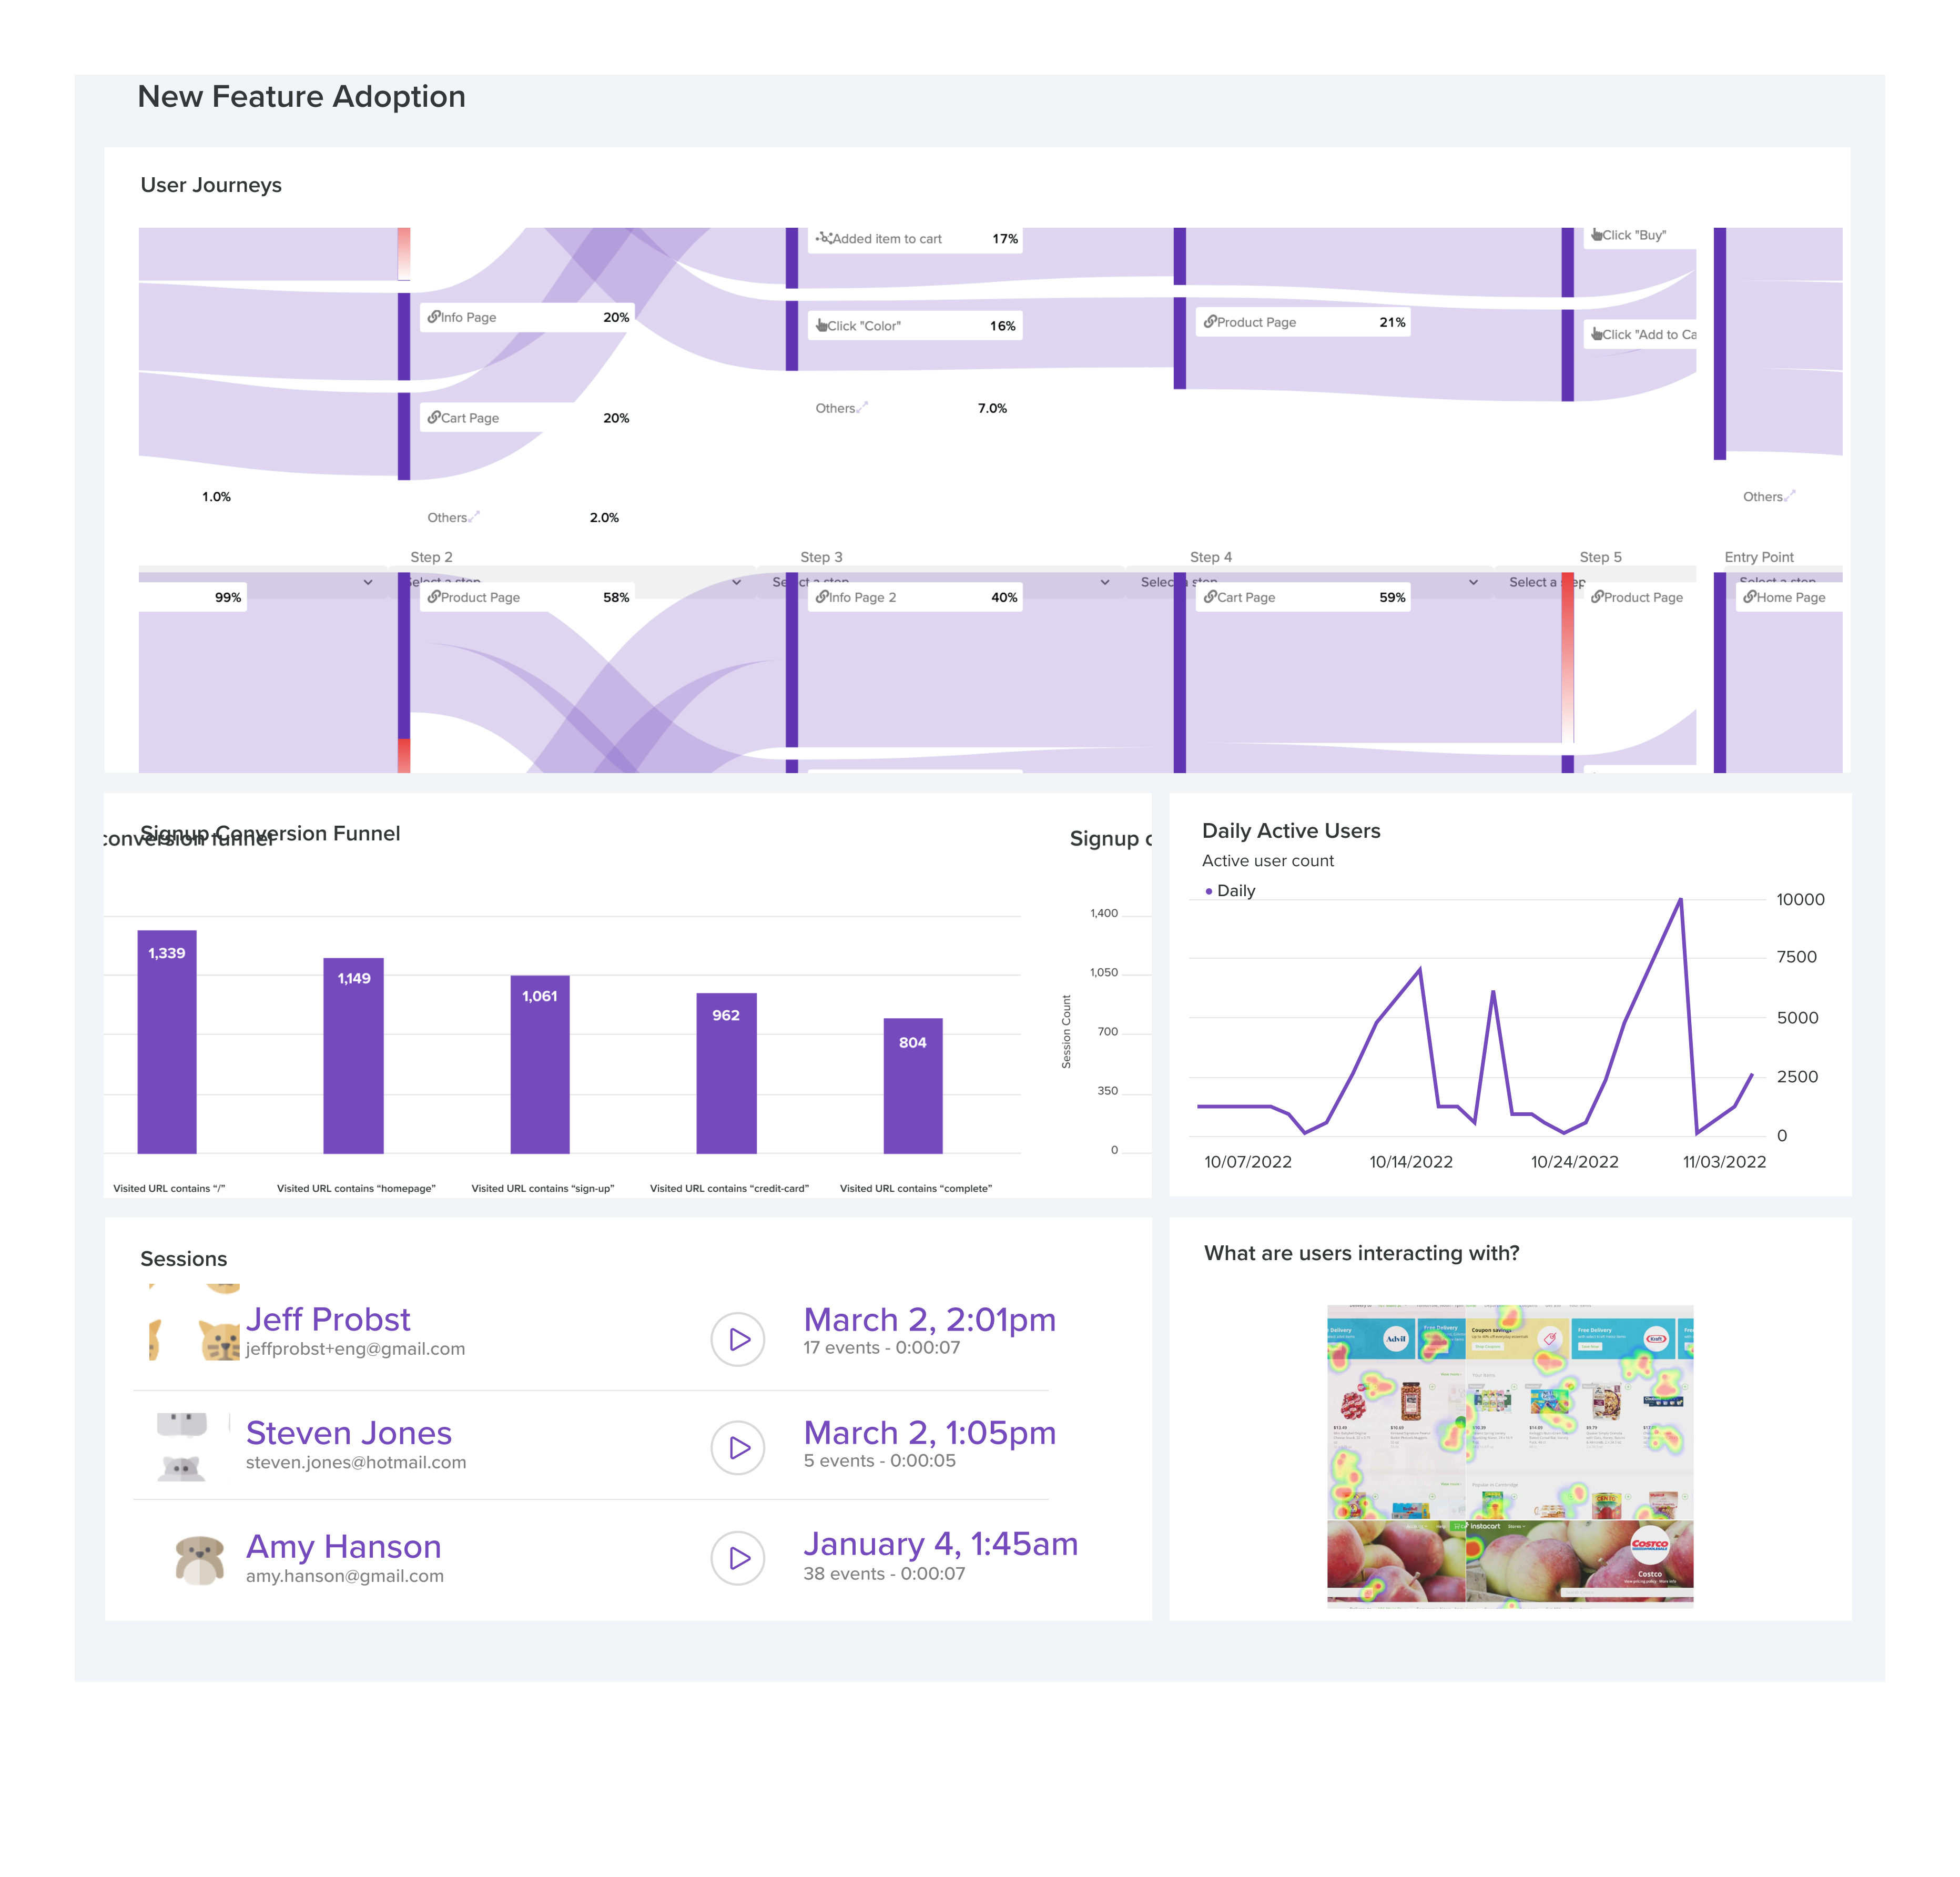
LogRocket's Galileo AI watches sessions and understands user feedback for you, automating the most time-intensive parts of your job and giving you more time to focus on great design.
See how design choices, interactions, and issues affect your users — get a demo of LogRocket today.

AI-generated prototypes can drift from the product you intended to build. Learn how to detect missing requirements, anchor prompts to your design system, and combine AI generation with careful review and manual refinement.

How four Figma AI plugins fit into a UX workflow, from ideation and wireframing to UX writing and design critique. Compare free limits, account requirements, and data handling.
Design critiques help teams predict outcomes. UX postmortems connect those predictions with what happened after launch. Learn a six-step framework for reviewing assumptions, combining evidence, identifying surprises, and sharing lessons without adding a heavy process.

Learn how to crop shapes and images in Figma with square and circle crops, frame clipping, boolean subtraction, vector masks, and AI cutouts, with practical examples and troubleshooting tips.

 Learn more →