A user experience map documents the user’s needs, wants, thoughts, and feelings, possibly at the different stages of their experience depending on what type of user experience map it is. Creating UX maps is the bread and butter of experienced UX designers. There are five main types:
While some may be quick to draw solutions based on assumptions of user problems, experienced UX designers advocate for conducting user research first, which often culminates in the creation of user experience maps. Let’s go through the steps for creating a UX map, starting with gathering data through research to create a user persona.
Editor’s note: This article was updated by Daniel Schwarz on 31 March 2025 to streamline the language, introduce clearer definitions for each UX mapping method, and provide a comparison table to help you quickly identify when and why to use each one. There is also a new section on recommended UX mapping tools.
In order to construct a user experience map, we first need to understand the user’s persona. User personas are the foundation of UX research — their purpose is to understand the user on a foundational level. You’ll need to include the following attributes:
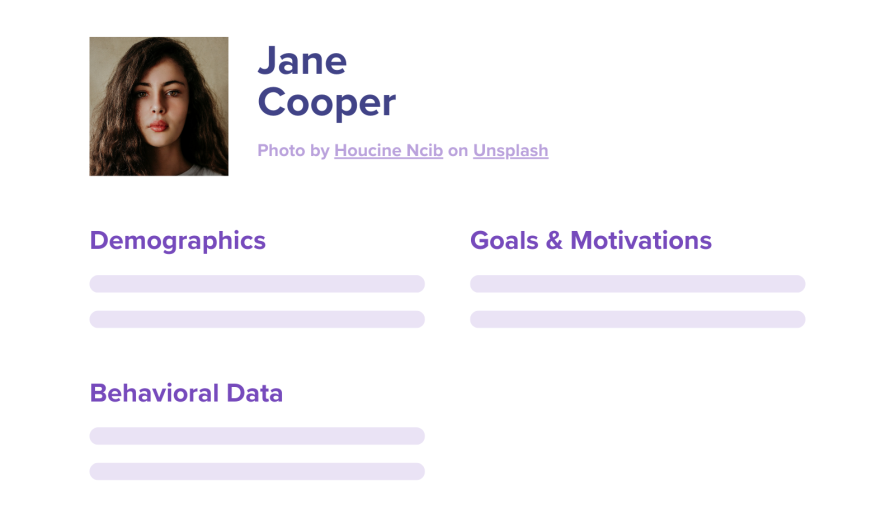
The primary method of collecting data for user personas is surveying (which is the cheapest option), but user interviews and focus groups are viable options too (more expensive, but more in-depth).
Once we have a user persona, we need to decide what kind of user experience map we need. This depends on the scope of the project (i.e., is the goal to solve a user problem holistically, a singular user journey within a product, or a singular moment within a singular user journey?).
The most common user experience maps are empathy maps and user journey maps:
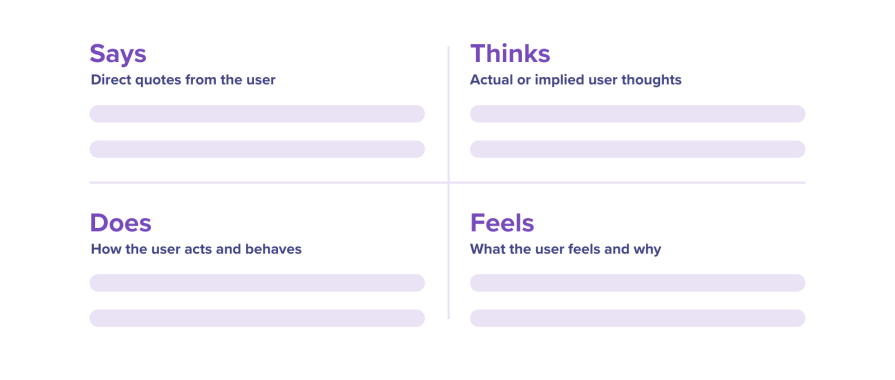
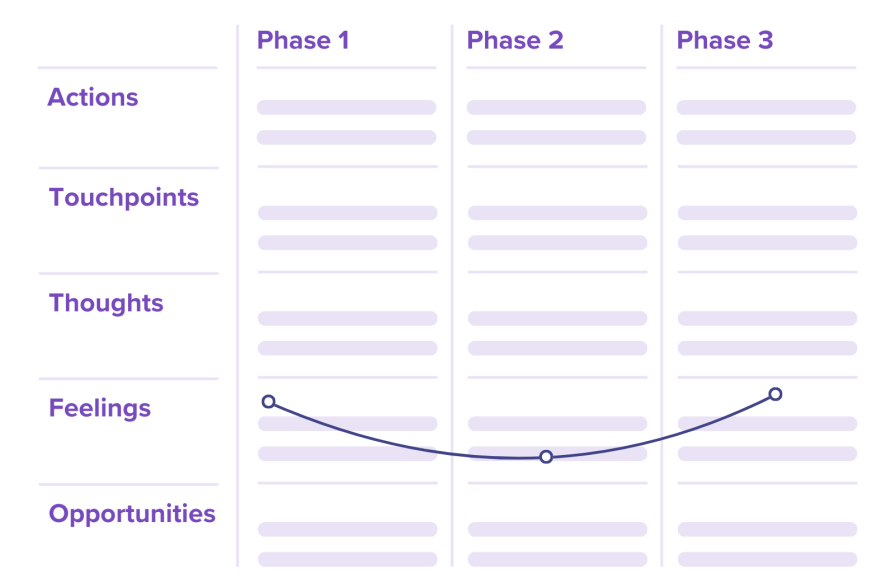
Beyond those two main types of UX maps, you might also create and use:
| UX map type | Purpose | Stage | Optional/required |
|---|---|---|---|
| Empathy map | To empathize with the user on a deeper level; to bolster the user persona | Any; while creating user personas | Optional, but useful for any UX process |
| User journey map | To visualize the user’s journey and understand the user throughout it | When starting a UX project | Required |
| Customer journey map | To visualize the customer’s journey | When starting a UX project | Required for B2B products where the customer isn’t the user |
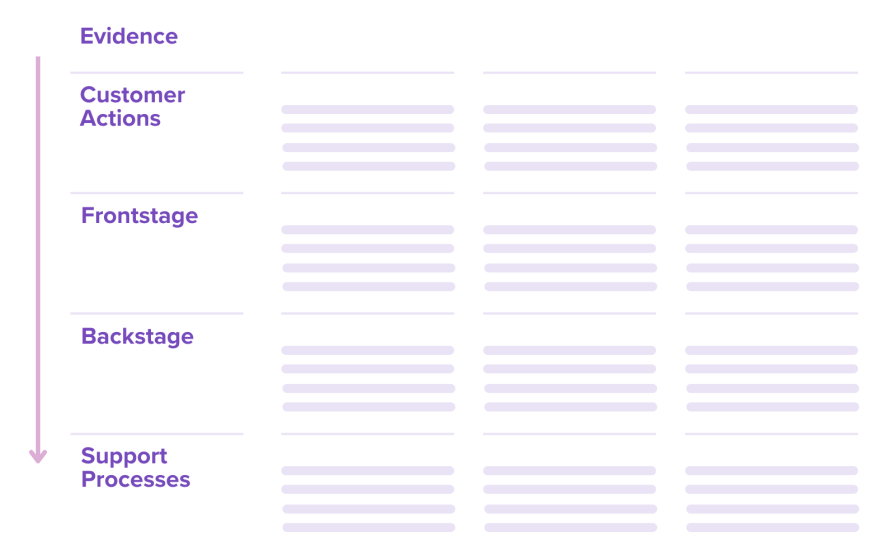
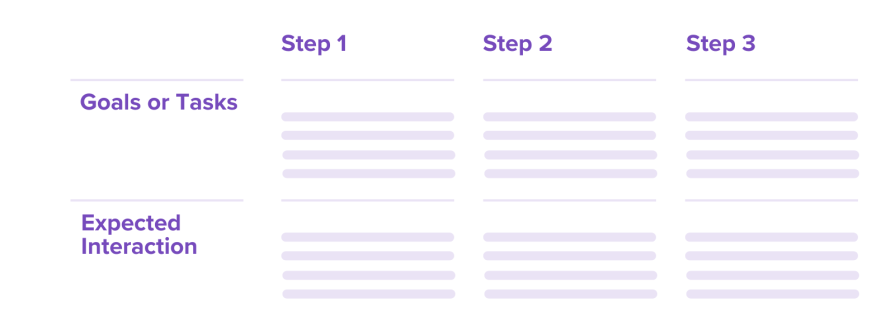
| Service blueprint | To visualize the entire service; to build upon the user/customer journey maps | After user/customer journey mapping | Optional, but useful for complex products |
| Mental model diagram | To compare the user’s expectations to the user’s experience | While mapping/blueprinting | Optional, but useful for mapping/blueprinting |
| Value proposition map | To articulate and contextualize the product’s value | While mapping/blueprinting | Optional, but useful for mapping/blueprinting |
At this point, we’ve created a user persona, narrowed down the project’s scope, and decided which UX maps we’ll need to create.
The next step is to leverage those data collection methods that I mentioned earlier (surveys, user interviews, and focus groups) in addition to app/web analytics, and then synthesize that data into insights. The app/web analytics are for mapping the various touchpoints of the user’s/customer’s journey — remember, we need contextual insight into every part of the experience if we are to improve it (and know which parts to improve).
All in all, the objective of this step is to document the thoughts, feelings, and behaviours of users and/or customers at every touchpoint of their journey.
However, we humans are complex beings and sometimes the findings may be contradictory in nature. When this happens, let these contradictions exist and allow the resulting data to breathe life into additional maps (or additional flows within a singular map) representing additional user/customer segments.
Here are some questions you can ask participants at various stages of their user/customer journey:
Don’t forget to refer to your user personas — are certain segments of people saying or doing the same thing? What patterns are you seeing? Utilize those app/web analytics too — for example, how long does it take for users/customers to make it through each touchpoint? That information is in your analytics data, and can be displayed on your user experience maps.
Regardless of the type of user experience map we’re creating, there are some considerations to keep in mind:
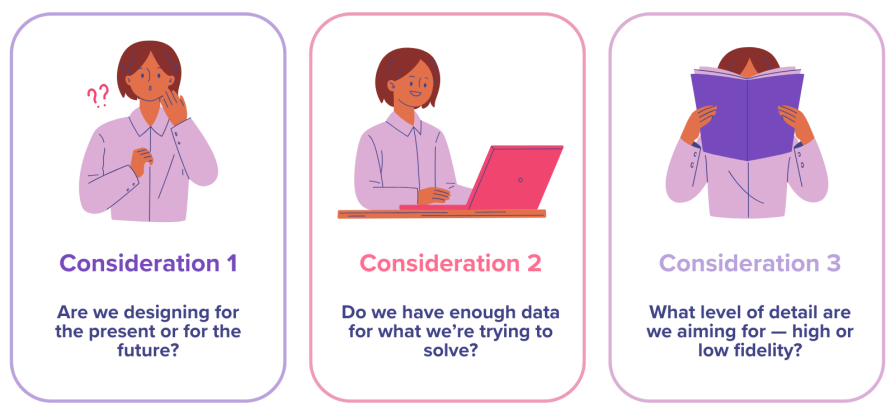
Per the Nielsen Norman Group, the first consideration is whether we’re designing for the present or for the future. If we’re designing for the present, then we simply identify the state of affairs today and outline our map based on existing pain points and other insights. However, if we’re mapping for the future, then we propose a future state that we would like our product or service to be in.
The second consideration is the richness of the data we have. Do we have enough data on the user/customer/problem we’re trying to solve? If there is sufficient data, then we can build a high-fidelity map with concrete, map-centric data. Until then, we must investigate and iterate until we have enough data to create a user experience map that truly represents our users, customers, product, and business.
The third consideration is the level of detail that we’re aiming for. Low-fidelity maps are rough overviews of the problems, perhaps consisting of notes in an unrefined manner, and are most commonly used in a collaborative setting. However, high-fidelity maps are the preferred outputs when designing/refining “final” solutions. High-fidelity maps have detailed user/customer journey data and can be multi-dimensional.
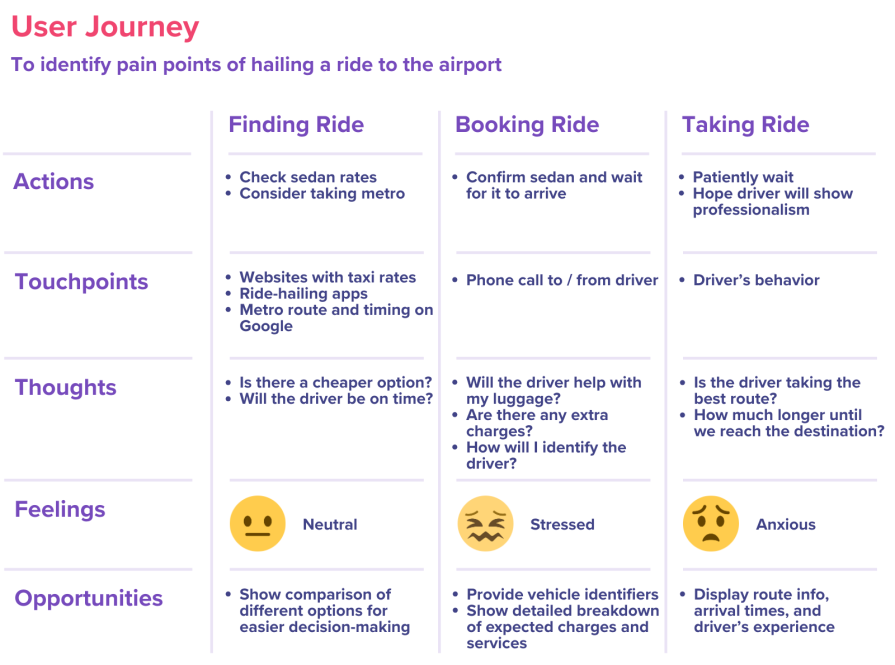
The following is a mid-fidelity example of a user journey map depicting a ride to the airport:
To create user experience maps, you’ll want a collaborative whiteboard tool. This’ll enable you to create UX maps in whatever format you prefer. After all, UX maps aren’t user-facing — they’re purely for you and your teammates, to provide insights and context, and ultimately help you make good UX decisions.
If you just want to put the data into tables, a whiteboard tool can facilitate exactly that. However, if you’d prefer to create elaborate customer/user flows, a whiteboard tool can facilitate that too.
According to the 2023 Design Tools Survey, the best user experience mapping tools (i.e., digital whiteboarding tools) ordered by rating are:
To create a great user experience map, we have to ask, listen, empathize, research, and challenge assumptions. We can gather user/customer data to constantly iterate and refine our maps. If we do this successfully, the map can proudly live as a design artifact for all stakeholders to utilize, ready for driving smart design decisions.
Header image source: Flaticon
LogRocket's Galileo AI watches sessions and understands user feedback for you, automating the most time-intensive parts of your job and giving you more time to focus on great design.
See how design choices, interactions, and issues affect your users — get a demo of LogRocket today.

2FA has evolved far beyond simple SMS codes. This guide explores authentication methods, UX flows, recovery strategies, and how to design secure, frictionless two-factor systems.
Designing for background jobs means designing for uncertainty. Learn how to expose job states, communicate progress meaningfully, handle mixed outcomes, and test async workflows under real-world conditions.
There’s no universally “best” design language. This section breaks down when Linear-style design works well, how to build beyond it (or start from Radix UI), why it felt overused in SaaS marketing, and why conversion claims still need real testing.

Minimal doesn’t always mean usable. This comparison shows how Linear-style UI keeps contrast, affordances, and structure intact, unlike brutalism’s extremes or neumorphism’s low-clarity depth effects.