A monetization model is a critical aspect of every product endeavor. A robust monetization model answers four fundamental questions:
In this article, we’ll cover the first part — how to define what to charge for — and demonstrate how to use a packaging strategy matrix to answer that question.
In simple terms, packaging defines which sets of features we charge for together.
For example, if you have a subscription model, packaging defines which features are bundled in which subscription plans and which ones you offer for free or as add-ons.
Two occasions force PMs to revisit packaging strategy.
The first is when the existing packaging becomes obsolete. For example, if you heavily improved an existing feature, you might consider moving it to a higher-paid tier, or you might decide to make some features free if they became a market standard for customers.
The other occasion is whenever you add a new feature to the product. Every time you add something new, you have to decide in which plan it should be available and whether you should even charge for it.
At a high level, there are five main steps to creating a product packaging strategy:
Start with understanding how your users perceive the value of the solutions you offer.
There are various approaches to this challenge. The three most common ones are:
In most cases, max-diff surveys offer the best tradeoff between precision and effort, so let’s focus on that.
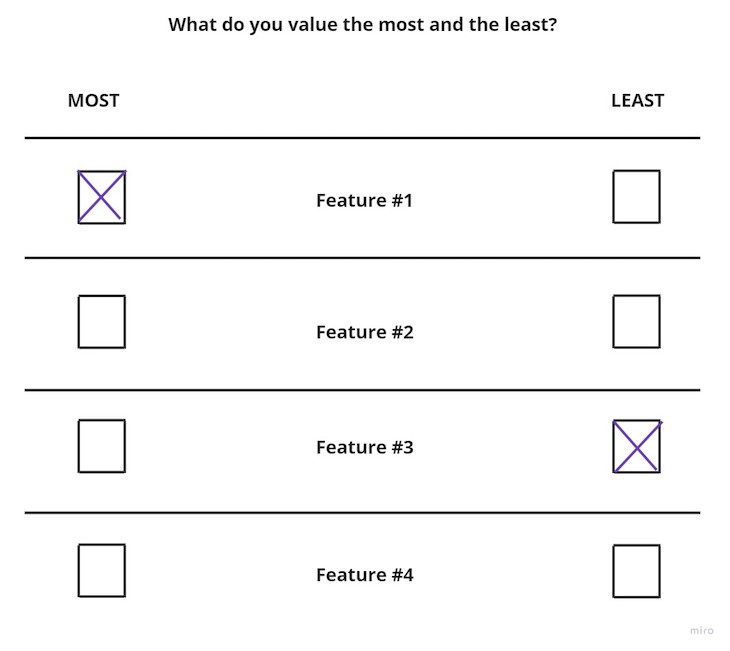
Start by listing all the features your product offers, then survey your users by asking them to choose one most valuable and least valuable feature:
You can then use these data to calculate the max-diff score using the following formula:
Max-diff score = (# of people who found the factor most valuable – # of people who found the factor least valuable) / # of surveyed people
For example, if you surveyed 10 people, where:
Then the max-diff score for feature No. 3 would be 0.1:
(3-2)/10 = 0.1
Although not mandatory, you can visualize the results with a max-diff chart:
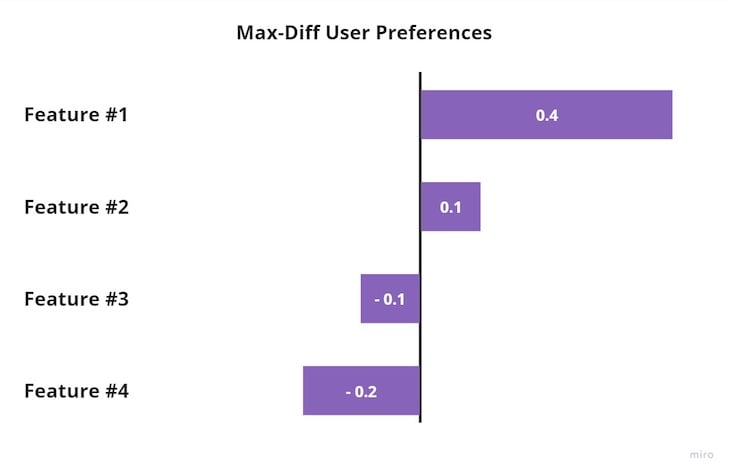
The max-diff chart gives you a visual representation of which features are most valuable to users and which ones are least valuable. The higher the score, the higher the perceived value of the feature.
The next step is to understand how much users are willing to pay for the features you offer.
Again, there are various approaches to testing that, such as:
The most common approach for identifying users’ willingness to pay is Van Westendorp’s price sensitivity meter, so let’s use this one.
Survey your users, and for every feature, ask them four questions
Then map the answers on a cumulative frequencies chart. As a result, you’ll develop a chart with four crossing points:
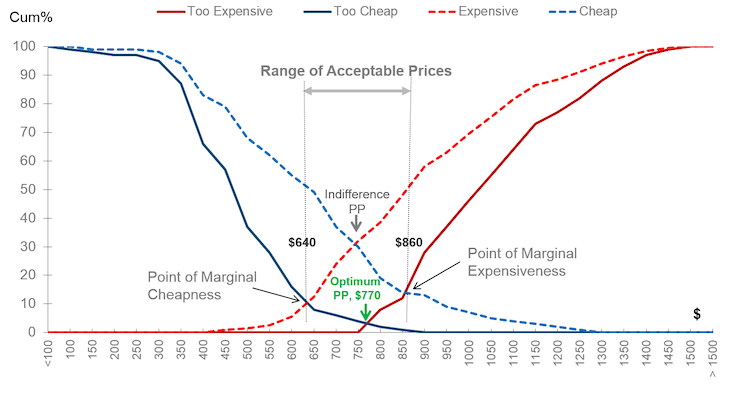
Without going too deep into the price sensitivity meter itself, what we care about is the point where the “too expensive” and “too cheap” lines cross. It’s called an “optimal price point,” and in theory, it’s the most optimal price you should charge to maximize revenue.
Plot the chart and identify the optimal price point for every major feature your product offer.
Now that you understand the willingness to pay for each feature (defined as the optimal price point in Van Westendorp’s price sensitivity meter), you need to calculate each feature’s %deviation from the median willingness to pay.
It will show you which features your users are willing to pay for more and less.
Start with calculating the median willingness to pay, and then just calculate how each feature stacks against the average:
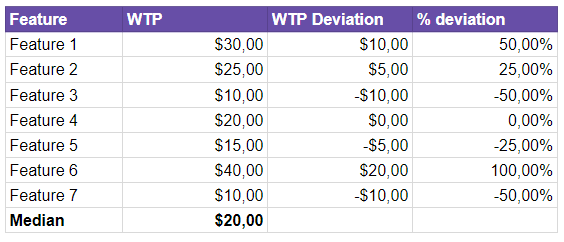
In essence, users’ overall willingness to pay for your product is driven primarily by features with high positive deviation.
By understanding our two key metrics — that is:
…we can map how the features stack against each other using a 2×2 matrix:
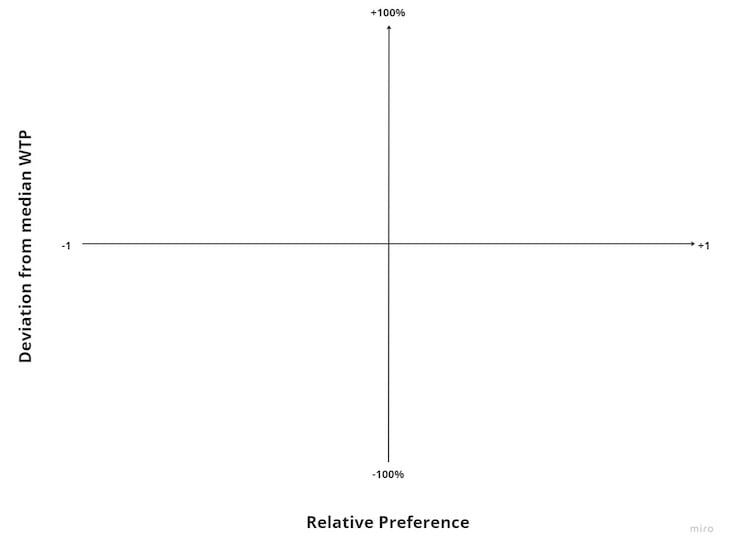
On the horizontal axis, map the perceived value of features on a scale of -1 and 1 (assuming you used max-diff analysis for that).
On the vertical axis, map the %deviation from the median willingness to pay on a scale of -100 percent to 100 percent.
As a result, you should get a matrix that looks more or less like the one below:
The packaging strategy matrix puts features into four buckets:
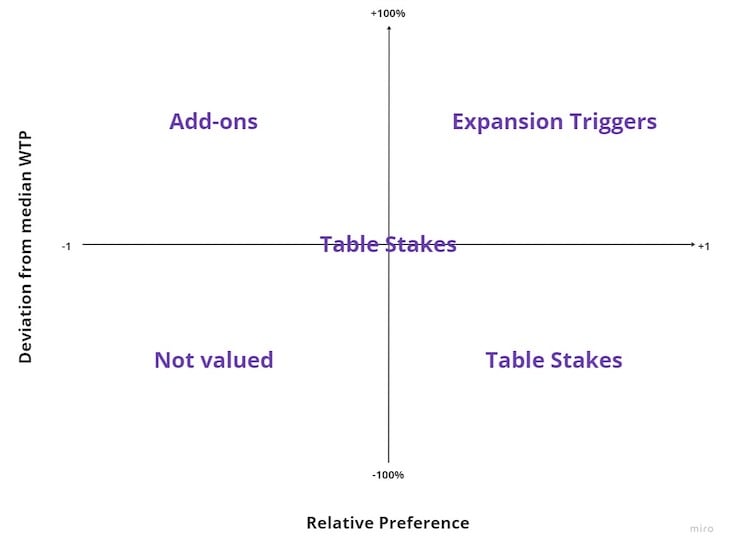
Features that are highly valuable for users, yet have a low willingness to pay, are table stakes.
These features are “must-haves” from users’ perspective, yet they are unwilling to pay for them. This happens for many reasons, but the most common one is user conditioning.
Take digital maps, for example. The ability to check your location and navigate to desired places is highly valuable for most people. Yet, the fact that Google Maps and Apple Maps have been free for years conditioned users to expect that a digital map itself is a free product, and most users won’t be willing to pay for the map service alone with so many unpaid alternatives.
As a rule of thumb, features that are close to the middle of the matrix should also be treated as table stakes.
Features that have both low willingness to pay and low perceived value build a “not valued” quadrant. You should reconsider whether you even need them.
There are two main justifications to keep these features in your product:
If neither is true, consider retiring these features.
If a feature has a high willingness to pay but a low perceived value, it’s a desired feature but only by a minority of users. It doesn’t make much sense to put it into your standard product offering (due to low overall perceived value), but giving them away for free would waste their revenue potential.
Given all of that, these features are great candidates for add-ons — features paid for separately, outside of the standard plan mix.
If the feature is highly valuable for the majority of users and these users are willing to pay for them, it’s an expansion trigger.
These are the best drivers to encourage users to buy your product, upgrade their subscription tier, etc., and should be the core of your packaging strategy and upsell flows.
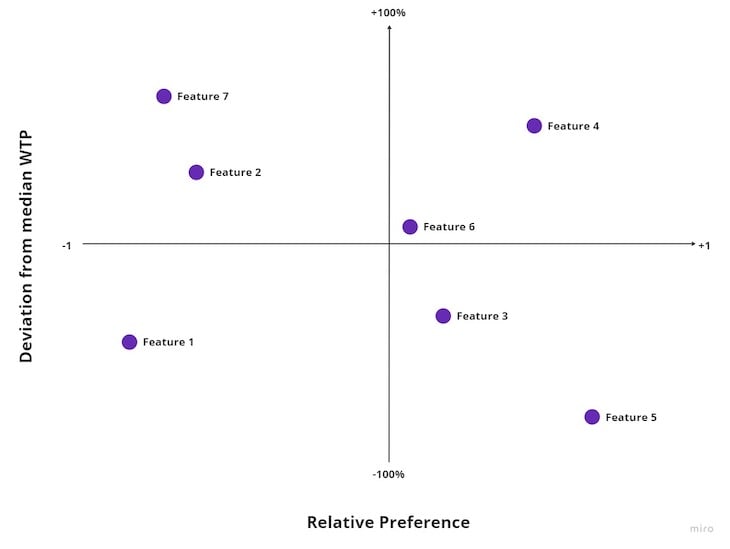
Let’s now look at what an optimal packaging strategy would look like based on the matrix we just created:
If I were to define packaging just by looking at the chart, it would be structured as follows:
Features No. 3, 5, and 6 are the table stakes, so they should be part of the basic offering.
If you have a freemium model, these should be offered for free. If you have a paid product, include these features in the least expensive tier.
I’d investigate whether feature No. 1 is even needed in the product, and if it is, it most likely also should be part of the basic tier.
It makes sense to offer a higher tier that includes feature No. 4.
For freemium products, feature No. 4 will be a subscription driver. For fully paid products, I’d recommend selling a more expensive tier with that feature.
Features No. 2 and 7 make for good add-on candidates. Although valued only by a minority of users, that minority is willing to pay quite a lot for them.
I’d sell them separately regardless of the chosen plan.
Packaging is often an underappreciated activity, and many companies do it once and then set and forget it.
However, suboptimal packaging has dire consequences for the business. You might:
Although creating a packaging strategy matrix is a complex and time-consuming endeavor, small improvements in your packaging strategy can make a significant impact on your product performance and bottom line. Thus, it’s worth revisiting it regularly.
Featured image source: IconScout

LogRocket identifies friction points in the user experience so you can make informed decisions about product and design changes that must happen to hit your goals.
With LogRocket, you can understand the scope of the issues affecting your product and prioritize the changes that need to be made. LogRocket simplifies workflows by allowing Engineering, Product, UX, and Design teams to work from the same data as you, eliminating any confusion about what needs to be done.
Get your teams on the same page — try LogRocket today.

Great product managers spot change early. Discover how to pivot your product strategy before it’s too late.

Thach Nguyen, Senior Director of Product Management — STEPS at Stewart Title, emphasizes candid moments and human error in the age of AI.

Guard your focus, not just your time. Learn tactics to protect attention, cut noise, and do deep work that actually moves the roadmap.

Rumana Hafesjee talks about the evolving role of the product executive in today’s “great hesitation,” explores reinventing yourself as a leader, the benefits of fractional leadership, and more.


