Sarah Carusona is an ecommerce and digital marketing leader who was most recently Director of Ecommerce at OluKai, a Hawaiian-inspired footwear company. She began her career in digital media and worked at various agencies, serving as Director of Media Buying at Tier 11 before transitioning to ecommerce growth at Common Thread Collective. At OluKai, she oversaw the operations of an eight-figure media budget and increased digital channel engagement by 40 percent.
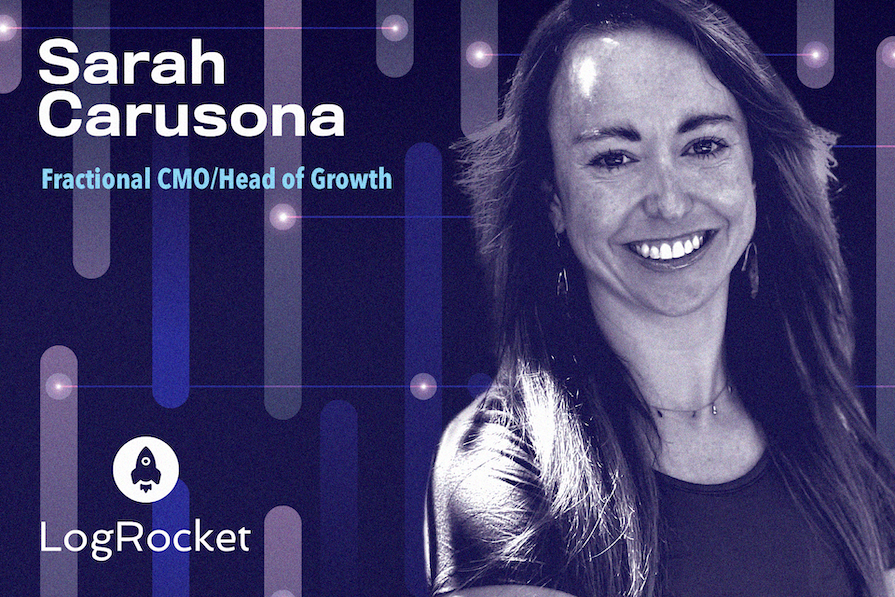
In our conversation, Sarah talks about her creative testing framework and how she broke down goals for each team member for their Meta account. She shares the importance of remembering to be a consumer first when going through your own product experience, and also discusses her methodology for understanding new and repeat customer behavior.
The number one component is having a good product that the consumer enjoys and, ideally, wants to come back and purchase more of. No matter how savvy you are with spreadsheets, data, and attribution windows, if you don’t have that, you can’t succeed. Understanding the product’s story and the value it drives to the consumer is the most important thing to focus on. As a consultant, I choose to work with brands that have a product that is either at that point or is on its way to getting there.
In terms of being able to scale operations, understanding key metrics of success is vital. You also have to be able to communicate those metrics clearly not only to leadership but down the many levels of the organization.
Some companies are focused on growth and want to acquire as many customers as they can as quickly as possible. Nowadays, however, companies typically care more about contribution margin and the bottom line. If you have both top-line and bottom-line goals, make the whole company aware of those. The different teams managing all of these components should have clear KPIs that help communicate how they contribute to those goals.
Yes — as a brand, vendors would ask, “What do you want more, scale or profitability?” My answer would always be both because the answer you hear from any founder or executive is exactly that. They do not want to sacrifice one for the other.
The issue is that we sometimes do that with our employees and teams. We say, “We want you to scale as well as be profitable,” but that doesn’t set the teams up for success. There are going to be times when you have to make a choice, so I believe a better question to ask is, “How much profitability are you willing to sacrifice for scale?”
This was when I was working with a brand that needed increased engagement on Meta. Click-through rate (CTR) is not the ultimate success metric. CPA and CAC are more important, but when I was working with this brand, I found the relationship between CTR, CVR, and CPA became confusing when working with the creative teams. I wanted to try to simplify things so we had clear focus.
I told my creative teams that their goal was to get customers to the website. Once they achieved that, I’d work with my web team, whose goal was to convert those customers. These two teams were going to have to work together, but I wanted to separate the goals to make each group’s tasks more explicit. I spent time providing goal benchmarks and showing the teams examples of ads that had really good CTRs compared to ads that didn’t.
This exercise opened up conversations around why we thought certain ads had better click-through rates. We also considered different iterations to improve this metric. We started identifying a pattern of similar formats or formulas that would result in a good CTR; it was often simple things such as showing close-up details of the product next to a lifestyle image. As we identified formulas that worked, we began to leverage them.
I also took these iterations to my web team to optimize conversion. For iterations with a high CTR but low conversion rate, we’d look for opportunities to increase conversion through similar messaging/imagery on the landing page. By reviewing creative on a weekly basis and breaking down the metrics, we could connect everything so it made sense. This led us to our ultimate goal of high CTRs matched with high CVRs.
For sure, but in different ways. For example, when working on TikTok, we knew the platform is designed to keep you on it. Its goal is for people to continue to scroll. So, if we saw our videos had a high attention span and view rate, we would continue to run them with confidence that it was leading to conversions (just not on a last-click basis).
Let’s say that we had a 30-second video and over 50 percent of viewers watched it to the 20-second mark or more. If it was a high-quality video that talked about our product, the brand, etc., I’d have high confidence that the person who watched for 20 seconds would walk away remembering us.
I could then do a cost-per-20-second-view analysis based on the cost of that campaign. We would look at things like that to say, “OK, I know this might not be getting clicks to the site or getting traffic, but let’s keep a small amount of spend there. We have a high confidence that it’s doing something positive for the brand.”
It comes down to understanding your KPIs and how you can improve them. And for the site, you should be tracking metrics based on different parts of the funnel, such as your homepage, key category pages, etc. Once you have a good idea of those metrics, it’s crucial to go through the user experience and understand which elements are good and which aren’t.
For example, we’d test the timing of an email signup pop-up. Is it worth having that come up right away? I can’t tell you the number of sites I go to where an email signup pop-up takes up the entire screen and the option to exit is barely visible. Remember to be a consumer first and go through your own experience as one.
The homepage, for example, is prime real estate. I don’t believe there’s a perfect formula for it, but we had a lot of interesting conversations about the goal of the homepage. Is it to educate the consumer? Is it to get them to a product page as quickly as possible? Is it to get them to sign up for an email or SMS? Is it all of the above?
We ultimately landed on a mixture of educating folks about the brand and getting them to a product page. Then, we started measuring click through rate to a product or category page from the homepage so we could further improve it.
Typically, we’d either have a product launch or a collection launch. As that launch approached, we’d create a campaign brief about the overall message and audience. From there, we would highlight certain taglines, and there was always one that our internal teams were most excited about.
Next, we’d launch ads that would vary in terms of the imagery/format. For some of them, we would maintain that favorite tagline or a close version of it. We’d then evaluate which ad had the highest CTR and then measure conversion.
In some cases, we’d see that the lifestyle image performed better than the one with the tagline, for example, but the conversion rate would be a little lower. We’d ask, “What copy did we use with this lifestyle image?” For instance, say we talked more about the quality of the materials or the story behind it. We’d brainstorm content based on the best performing topic, come up with a few different taglines and start testing those. We’d find the best-performing variation and then change the landing page to whatever was working best.
I find that new customer revenue forecasting and management is easier than that of repeat customers. This is because it’s easier to understand and take action on. With that said, repeat customers can still be predictable in a sense, but they are harder to act on in a real-time scenario.
If I see that my new revenue is down, there are many levers I can pull. But, if repeat revenue is down, there’s a longer tail for figuring out what went wrong and why people aren’t coming back at the rate that you had thought they would.
I think about this in a couple of ways. First, understand your repeat customer behavior. Cohort modeling — which is the standard for understanding repeat forecasts — is helpful for this. Second, it’s important to understand the second purchase timeframe. I think of this a lot in terms of the second purchase because the first-to-second purchase pipeline is one of the most critical that I’ve seen in most businesses. If you don’t get that second purchase, and especially if you don’t get that second purchase within a specific period of time, you’re very unlikely to get that customer back again.
It depends on the business, but the 30-90 days after pressing the purchase button are usually the most critical. It’s kind of like dating. In that initial period when you transition to being in a relationship with someone, you want to be sending flowers and going all out without being annoying. Similarly, in ecommerce, you want to surprise and delight a new customer with personal touches, but not bother them.
This is a critical time when you need to think about everything from shipping, returns, and exchanges to the unboxing experience, the email and SMS flows, and how frequently you’re sending communications to these people. You also need to consider what kind of information you’re giving them in terms of the product that they received, as well as other products that they might be interested in — all without seeming overly pushy or salesy.
I can’t tell you the number of brands that I buy from where, in the 30 days following my purchase, I get emails encouraging me to make another purchase. But, I rarely get emails that follow up on the product to say, “Hey, here’s more information about your product and something that you might like about it.” Or, “Do you have any questions for us about your product?”
There are a lot of possibilities for specific personalizations on Meta, TikTok, YouTube, Google, etc., to truly customize the experience for the consumer. Even on streaming platforms, for example, you can remarket to your existing customers — or people who purchase within a specific period of time — with a specific commercial. Perhaps that’s to reiterate how the brand is doing new cool, interesting things that the consumer would be interested in, but it’s also a way to keep things front of mind. A lot of these personalization efforts should be more about relationship building and storytelling versus the urgency for them to buy another product.
I’ve had to do a lot of learning in this area over the past couple of years. I used to manage teams of media buyers, and they would ask me how to explain or convince their clients about the benefits of certain strategies they wanted to go after. I used to say, “dazzle them with data.” Give them as much data as you possibly can.
Looking back, I actually regret that. As I’ve moved up in my career, I’ve realized that the amount of data executives receive is insanely high. The faster you can get somebody to remember something, the faster you’re going to get them to do what you want them to do.
I like to think of this as cocktail hour facts. These are snippets of information that, if you’re at a cocktail hour, you can say quickly and will be easy to remember. For example, you could say, “Hey, we raised revenue by 60 percent,” or, “40 percent of our customers come back after purchasing this type of product.”
I try to communicate data using those types of facts. If you can find that sentence that people can hone in on, remember, and walk away from without having to write it down, you’ve got a win. You also want to have all the data to back it up and ensure that you have evidence in place, of course, because some people will want to dig into the details. Being able to start with that one-sentence fact that people can walk away with and remember is so important.
LogRocket identifies friction points in the user experience so you can make informed decisions about product and design changes that must happen to hit your goals.
With LogRocket, you can understand the scope of the issues affecting your product and prioritize the changes that need to be made. LogRocket simplifies workflows by allowing Engineering, Product, UX, and Design teams to work from the same data as you, eliminating any confusion about what needs to be done.
Get your teams on the same page — try LogRocket today.
Want to get sent new PM Leadership Spotlights when they come out?

AI governance is now a product feature. Learn how to embed trust, transparency, and compliance into your build cycles.
Rachel Bentley shares the importance of companies remaining transparent about reviews and where they’re sourced from to foster user trust.
Michal Ochnicki talks about the importance of ensuring that the ecommerce side of a business is complementary to the whole organization.
Christina Valls shares how her teams have transformed digital experiences at Cedars-Sinai, including building a digital scheduling platform.