Insights tend to appear out of nowhere. You’ve probably experienced a situation where you do a customer interview, review a company dashboard, or even just walk in the park and have a breakthrough.

These moments are incredible, but an experienced product manager shouldn’t rely on random strikes of inspiration. PMs need a systematic process for consistently generating new insights.
Expanding the number of insights you work with is the easiest way to fast-track your product and career growth. The more insights you have, the better decisions you can make.
In this article, you’ll learn what a data-driven insight generation loop is, how to create it, and ways to implement one within your product team.
A data-driven insight generation loop is a process that maximizes your chances of finding relevant insights from data.
While there’s no magic, 100 percent guaranteed formula for generating actionable and highly-valuable insights, proper processes and routines increase the chances of capturing these insights.
The insight generation loop relies on consciously defining, capturing, triangulating, and analyzing data regularly to come to new understandings.
A data-driven insight generation loop consists of five steps:
When fishing for insights, the first thing that you need to do is define a hypothesis. At this stage, it doesn’t need to be evidence-backed. After all, you are exploring insights, not validating specific hypotheses.
A good approach would be to define a metric you want to improve and set a broad hypothesis on how it can be achieved.
A specific metric allows you to focus your exploration around a concrete outcome, while a broad hypothesis lets you expand your thinking. If you set an overly specific hypothesis, you’ll get stuck answering the “yes or no” statement, which is validation, not insight generation.
Although it may be tempting to jump straight into analysis, save some time to plan your approach.
Randomly clicking through dashboards without investing time to think through the approach results in wasted time.
There are various analyses you can perform. Some examples include:
Start with the simplest and most straightforward analysis. It’ll give you early signals if you are heading in the right direction before investing too much time in a more detailed analysis.
You can always plan a second loop later.
The next step is to actually perform the analysis. Understanding your product from a data perspective is pivotal for building a successful product. The process of analysis involves extracting, cleaning, visualizing, and interpreting the data that you have.
Before your analysis, build off your planning sessions and clearly define your objectives and how you will measure your KPIs. This will ensure that you have stakeholder alignment prior to diving in.
To perform the analysis, you can use one of the testing strategies listed above, or you can utilize LogRocket and take the guesswork out of it. LogRocket combines session replay, error tracking, and product analytics all in one cohesive dashboard that enables you to make informed decisions about your product.
The most common mistake people make is not pressure-testing their findings.
Your initial analysis can be flawed, especially when you start with a broad and straightforward analysis. The time you selected, the segments you decided to analyze, and the criteria you chose all impact the outcomes of your analysis.
A robust insight holds true across multiple analyses from different angles.
Pressure test by finding an answer to these three questions:
You might discover that doubling feature X usage can triple your revenue. A 200 percent boost to income might sound tempting, but what if feature X targets only 5 percent of your user base? And what if it’s the cheapest feature you have?
This 200 percent boost in a specific feature revenue might translate to a mere 1 percent boost for the total revenue.
Always look at the big picture.
There might be other factors influencing your analysis that you didn’t consider.
For example, you might discover that people using a feature X tend to retain three times better, but that alone doesn’t prove that the features cause retention.
There might be another variable that impacts both the usage of feature X and retention. Be wary of correlation and make sure that you look at all the factors at play.
Try to think if there are other ways you can solidify your confidence.
For example, if you run the analysis for a 14-day period, you could check if it still holds true for 21 or 28 days. Or you could check different random samples of 14 days in the previous quarter.
The bigger the insight seems to be, the more pressure testing it deserves. After all, you don’t want to pivot your business model based on flawed insight.
The last step is deciding whether to exploit the insight further or to explore new insights.
If you feel the insight is promising and you can further test it, consider looping again. Otherwise, it might be more beneficial to start a new looping process.
As a rule of thumb, you should explore other areas if you:
Now, let’s take a look at a hypothetical example of a data-driven insight generation loop.
You are a product manager working on Kindle, an e-book reader developed by Amazon, and are tasked with improving the retention of people using the built-in digital store. You define a retained user as someone making at least one purchase a month. The steps are as follows:
Since highlighting text is one of the core advantages of e-books, you want to take a look at it. That might sound like a random thought, but you don’t need a super-specific hypothesis to start looping.
You plan the analysis and decide to:
You run the analysis and get the following result:
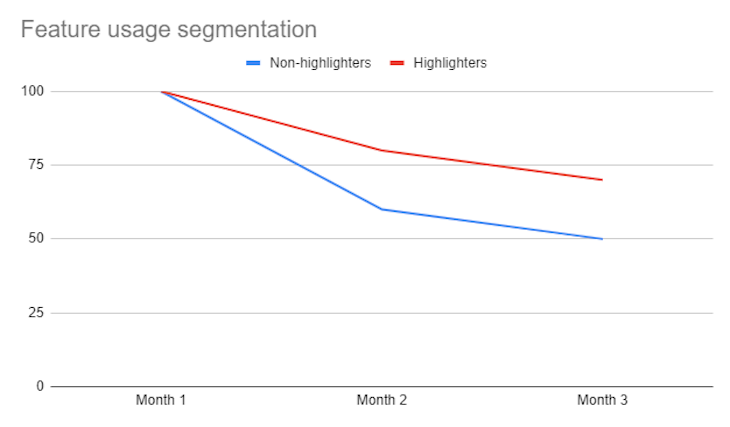
You then pressure test it by:
It turns out the highlighters build 50 percent of the user base, which allows you to conclude that the insight is relevant and want to explore it further.
You want to understand the differences between both segments a bit deeper. You also remember that you introduced an onboarding feature only on some Kindle models. You believe that it might impact the usage of the highlighting feature.
You decide to run another segmentation analysis, this time analyzing how the number of highlights changed depending on whether the user received onboarding or not:
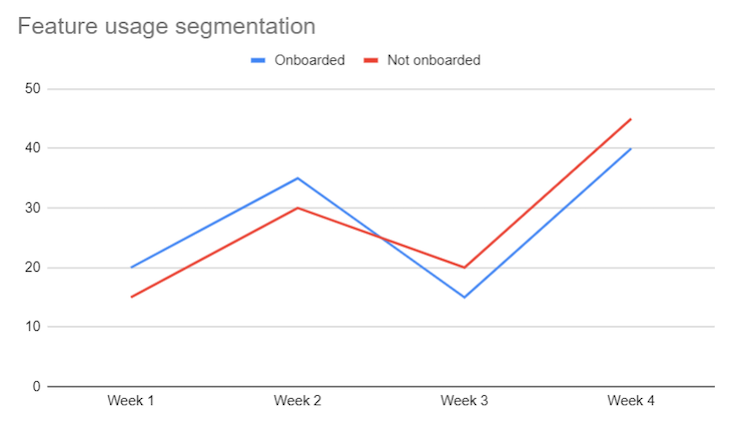
The result turned out neutral. You pressure-tested it by testing different Kindle models and periods; the results were similar.
You decide to reject the hypothesis and start a brand new loop.
This time, you decided to test a different theory — that the amount of highlights differs on genre by genre basis.
You run a similar segmentation analysis as during the second loop:
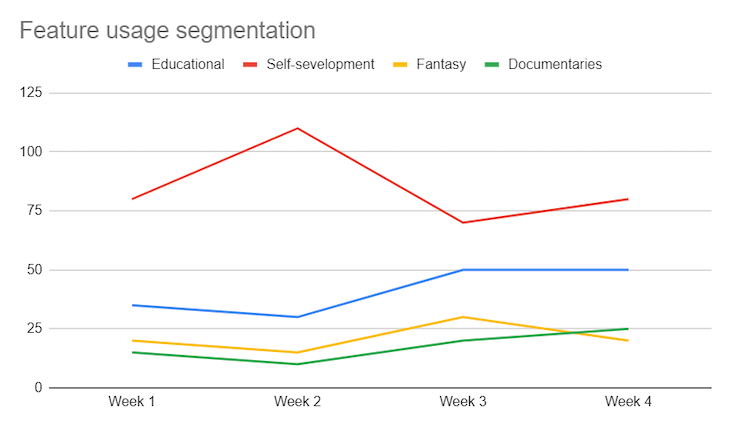
It turns out that people reading self-development and educational books highlight more often.
Although the insight itself doesn’t seem super actionable — it seems like a natural phenomenon that people highlight more in self-development than fantasy books — it inspires yet another theory to explore.
The first loop proved that highlighters retain better.
The third loop proved that self-development books tend to be highlighted the most.
Now you want to gather more evidence and see if self-development book readers retain better, so you run yet another segmentation analysis. This time you compare the retention of self-development book readers with other genres:
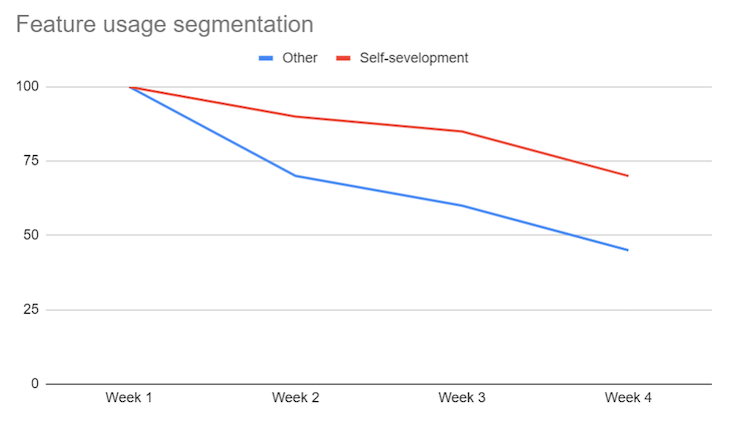
The analysis suggests that self-development book readers retain better.
You pressure test by:
At this point, you have to decide what to do next. There are a few options:
A single insight can change the trajectory of your product dramatically. Because of this, Improving the insight generation process is one of the highest ROI activities a product manager can do.
To maximize the chance of getting valuable insights from data, follow this five-step loop:
Don’t leave your career to chance, and start fishing for these insights ASAP.

LogRocket identifies friction points in the user experience so you can make informed decisions about product and design changes that must happen to hit your goals.
With LogRocket, you can understand the scope of the issues affecting your product and prioritize the changes that need to be made. LogRocket simplifies workflows by allowing Engineering, Product, UX, and Design teams to work from the same data as you, eliminating any confusion about what needs to be done.
Get your teams on the same page — try LogRocket today.

Michal Ochnicki talks about the importance of ensuring that the ecommerce side of a business is complementary to the whole organization.

Christina Valls shares how her teams have transformed digital experiences at Cedars-Sinai, including building a digital scheduling platform.

Red-teaming reveals how AI fails at scale. Learn to embed adversarial testing into your sprints before your product becomes a headline.

Cory Bishop talks about the role of human-centered design and empathy in Bubble’s no-code AI development product.


