Proper project planning and execution requires organizational tools that allow you to understand where you are in a project and identify any gaps that may exist. To this end, network diagrams are an indispensable visual tool for project managers to facilitate effective communication and deliver results.

Network diagrams help you catch potential bottlenecks, locate opportunities for improvement, and make informed decisions about your product.
In this article, you will learn what a network diagram is, how they’re used, the different types and how to create and implement them within your role as a project manager.
A network diagram is a visual tool that allows you to evaluate your tasks and understand their relationship to one another. By doing so, you can create a critical path to follow.
Network diagrams help you visualize how each task interacts and supplies you with the exact end date of your project. You can think of them as a fancy visual workflow to help you keep track of your project.
There are two types of network diagrams: precedence diagram method (PDM) and arrow diagram method (ADM). Both types are fairly similar, but the main difference is how they present tasks and milestones. Let’s dive into each method a bit further:
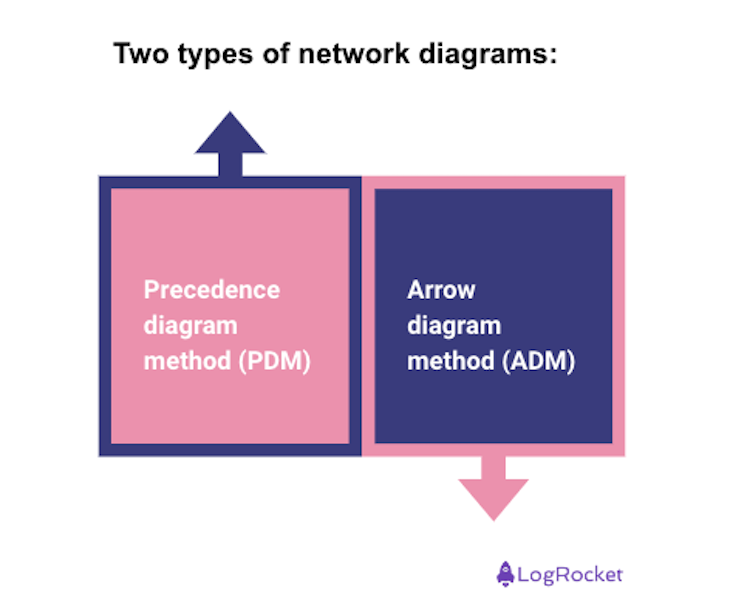
The ADM is less common because of its limitations, but it’s good to know it so you can understand the difference from the PDM.
True to its name, the ADM uses arrows in its diagram. The arrows represent a task or an activity, while the boxes are considered milestones of the start and end of the activity. Sometimes the length of the arrow demonstrates the length of time it will take to complete that activity.
The problem with the ADM is that it only shows one dependency going from A to B. Meanwhile, the PDM can show four dependencies, which allows for more intricate and accurate diagrams compared to the ADM. Because of this, a majority of project scheduling tools use the PDM for their software.
The PDM has far more dependencies compared to the ADM because it organizes tasks and relationships differently to reveal additional options. When looking at a PDM, it’s important to remember these elements:
The PDM elements reveal more possibilities for how tasks are completed and their impact on each other. The four dependencies in the PDM include:
An additional bonus of using the PDM is you can also factor in lead times and lag times. These can give you a better grasp of your timeline and the end dates of your tasks and projects. Overall, the PDM can efficiently help product managers identify tasks and relationships and create a realistic project schedule.
As a PM, you can use network diagrams to do the following:
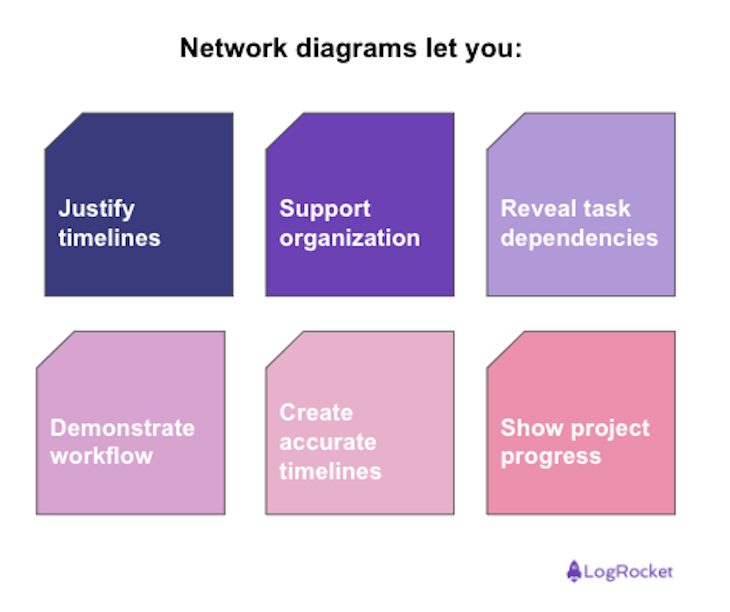
Every product manager has to talk to stakeholders and convince them to be on the same plan. Network diagrams efficiently show how tasks are interrelated in an easy-to-understand format. This makes your presentation to stakeholders easier since they can see why your timeline is necessary.
There are a lot of activities to keep track of when running a project. A network diagram ensures no task is forgotten and every activity is considered during the planning and execution process.
You may not realize Task A and Task C can start at the same time even though Task B isn’t finished yet. By creating a network diagram, you can find how tasks are dependent on each other (and how they aren’t). This helps you create a more efficient and accurate timeline for your project.
Communicating what needs to happen next for employees is easier once you’ve created a network diagram. A team can understand the scope of the project and how activities will affect each other.
When all of your tasks are arranged and dependencies established, product managers will have a better understanding of their team’s work schedule. If something gets delayed, you can view what other tasks will get delayed and make accommodations for it.
Stakeholders need assurances the project is progressing, and network diagrams are a great way to show what your team has completed within a timeframe.
Creating a network diagram for your product team doesn’t have to be an intimidating experience. There are four steps to create a network diagram:
Network diagrams are easy to understand, but they can quickly become confusing if you don’t follow best practices. To close out, keep the following in mind:
Featured image source: IconScout
LogRocket identifies friction points in the user experience so you can make informed decisions about product and design changes that must happen to hit your goals.
With LogRocket, you can understand the scope of the issues affecting your product and prioritize the changes that need to be made. LogRocket simplifies workflows by allowing Engineering, Product, UX, and Design teams to work from the same data as you, eliminating any confusion about what needs to be done.
Get your teams on the same page — try LogRocket today.

Learn how to choose and adapt product management frameworks based on your product stage, constraints, problem type, and business context.

Learn when streaks improve retention, when they create fragile engagement, and how PMs can design healthier systems around user progress.

A technical debt register brings transparency and clarity as to what type and how much debt you have and can be used to monitor and review your debt ratio.

Memos don’t have to be complicated. Just keep them clear, concise, and focused on actionable items. More on that in this blog.


