We Rustaceans like our code to be CRaP. That is, correct, readable, and performant. The exact phrasing varies; some use interchangeable terms, such as concurrent, clear, rigorous, reusable, productive, parallel, etc. — you get the idea. No matter what you call it, the principle is crucial to building fast, efficient Rust code, and it can help boost your productivity to boot.

In this tutorial, we’ll outline a sequence of steps to help you arrive at CRaP code for your next Rust project.
In the past year, the Rust compiler has sped up considerably and analysis passes have become more powerful. Yet developers still complain about long compile times, and rightfully so. Long compile times extend the turnaround time and thus hinder productivity.
Code is more often read than written, so it pays to invest in readability. You’ll work a little harder while writing it, but you’ll thank yourself later. Plus, code often needs to be changed, so coding in a way that leaves room for future modifications pays back with interest.
Finally, you always want your code to be safe and sound. When working in Rust, this takes on another meaning: you want as little unsafe as possible, and none of it should be unsound, otherwise programs will fare no better than those of our peers using C/C++.
Of course, you also want your code to run reasonably fast and within resource constraints. For many, bringing those requirements together is their main motivation for using Rust in the first place.
While you’re writing your code, pay attention to the naming of your variables and document why you’re doing everything. Commenting your public interface at an early stage, preferably with doc tests, is also advisable to ensure that your interface is actually usable.
Don’t make things generic until you have at least two use cases that need it. Your compile times will be your reward, and you’ll find that it’s still easy to change afterward.
For example, I recently needed to convert a slice of &[i32]s to a Vec<f64>.
/// I could have done this, but didn't:
fn to_f64s<I: Into<f64>>(is: &[I]) -> Vec<f64> { .. }

// instead I did this:
fn to_f64s(is: &[i32]) -> Vec<f64> { .. }
Sure, I may need to extend this in the future, but for now, it’s totally clear what the types are, I don’t incur any compile-time for type inference, my IDE will insert the correct types for me without problems, and extending the method to work with other types is still simple, so I lost nothing.
In the same vein, avoid introducing concurrency at this stage unless the design won’t work without it. In most cases, Rust makes this painless enough to do later, and adding it before you know the code is correct will make debugging much harder if it isn’t.
The same applies to unsafe — avoid it unless it would be impossible to implement some function without it. In a way, unsafe code is even worse than concurrent code; it may work for a long time before failing, or it may work on most machine/operating system/compiler version combinations. And despite tools like miri, it is exceedingly difficult to track down undefined behavior.
Declare your data so that it will be easy to work with. Good data design leads to straightforward code. Avoid fancy algorithms at this stage unless you are confident they’ll improve performance by an order of magnitude and you cannot easily swap them in later (in the latter case, add a // TODO note).
This is beneficial because:
Try to avoid needless allocation at this stage, or at least make a // TODO note so you won’t forget to fix it later. Keeping track of the allocations is harder than keeping track on the CPU cycles spent, so it makes sense to monitor it early on. Yes, there are some awesome tools available to help you find where memory is spent, but even those take some time to set up, run, and interpret the results. Reducing allocations can often lead to quick wins.
// this `collect here is unnecessary unless `wolverine` has side effects that
// may not be reordered with following operations, for example thread starts
let intermediate = inputs
    .iter()
    .map(|i| wolverine(i))
    .collect::<Vec<_>>();
return intermediate
    .iter()
    .filter_map(|f| deadpool(f))
    .collect();

/// just reduce it to one run:
return inputs
    .iter()
    .map(|i| wolverine(i))
    .filter_map(|f| deadpool(f))
    .collect();
If you use traits, you should use dynamic dispatch at this stage. There’s some overhead, but not too much, and you can change it to static dispatch with monomorphization later when profiling reveals that it makes a difference. This will keep the code lean, compile times short, and instruction caches free for the hottest code.
/// Avoid this for now: This function will be monomorphized
fn monomorphic<I: std::io::Read>(input: &mut I) -> Config { .. }

/// Use a `&dyn` or `&mut dyn` reference instead
fn dynamic(input: &mut dyn std::io::Read) -> Config { .. }
If you’ve successfully compiled and have some cycles to spare, run Clippy and peruse its output. It may show a few false positives, but most lints are in good shape, and the messages will sometimes lead to nice improvements.
Now that you have code that works, it’s time to put it to the test. If you can, write doctests for all public methods. #![warn(missing_doc_code_examples)] is your friend here.
This is simplified by the fact that we haven’t added any unnecessary abstraction. Don’t change this to make your code “testable.” If needed, you can have test helper methods that are only compiled with #[cfg(test)] so they can be shared among tests.
Larger, more complex usage tests can be put in the examples/ directory.
Now is also a good time for a README.md, if you haven’t already written one.
Extend your testing toolbox with quickcheck or proptest. These tools enable you to automatically generate random test cases and reduce the test cases once an error is found.
For a more directed, coverage-maximizing approach, the Rust Fuzz Book shows how to use afl or cargo-fuzz to find failing test inputs. This can often uncover problems that quickcheck or proptest fail to see because they only generate random inputs regardless of the code paths taken.
Apart from tests, you can often use the type system to catch classes of possible errors at compile time. For example, if you have a u8 that should only ever be 1, 2 or 3, consider using an enum instead. This tactic is often called “make illegal states unrepresentable,” and Rust’s powerful type system is extraordinarily apt for it.
For an extreme example, my compact-arena crate uses types and lifetimes to disallow misuse of the indices at compile time.
Finally, give your code a read. Can you find things that stand out? What’s good about the code? What could be improved? While looking over the code, also keep performance pitfalls in mind.
I personally prefer to work as part of a team best. If you share this trait, make it known. Add a CONTRIBUTING.md to your project, invite others to join, and be welcoming to those who do. Keep a list of easy, mentored issues and follow up on them. You can even post them to This Week in Rust’s Call for Participation list. This often takes a bit of patience upfront but pays back once you’ve attracted loyal and capable co-maintainers to help reduce your workload.
Now that your program is lean, well-tested, and readable, give it a test run. If it’s fast enough to suit your needs, you’re done. Congratulations! You can skip the rest of this section. Otherwise, read on.
Before you set out to optimize, your first task is to learn what needs optimizing. Humans are famously bad at reasoning about where a program will spend its time.
Learn and work with the tools your system offers. For sampling profilers, the inferno docs have very nice directions to get a flamegraph for your code (Kudos to Jon Gjengset). If your application has any sort of concurrency, you may also want to give coz a try.
If you can run it, DHAT can provide a solid overview of where memory is used. The good thing about excessive memory use is it is often low-hanging fruit for optimization. The bad thing is that you’re unlikely to find them, since you’ve (hopefully) already gotten rid of most of them early on.
Once you understand the hot spots of your code, look for algorithmic improvements first (your TODOs might now come in handy). Getting bogged down in the low-level details will be counterproductive if you change the whole thing later. However, be aware that your program will very rarely exhibit asymptotic complexity (in layman’s terms, run on very large inputs), so be aware of that when choosing an algorithm.
If you’ve maxed out your algorithmic options and still need more speed, look into the data layout. Does your HashMap have fewer than 50 entries most of the time? Use a Vec<(key, value)> instead, especially if you can sort_by_key and binary_search_by_key it for lookup. If your Vecs have mostly one or two elements, perhaps try a SmallVec (or tinyvec if it gives you the same perf).
At this stage, even the order of the data may make a difference, so if you see certain reads of a struct’s field in your profile, try prepending #[repr(C)] to the struct definition and reordering the fields to see if it gains you some performance.
If you’re particularly astute, you will have noticed that we’ve yet to talk about concurrency. This was intentional. It’s often unnecessary to make your program run in parallel, and the wins can be underwhelming, especially if you introduce concurrency without a clear idea of where it would be effective.
Amdahl’s Law states that any speedup (s) of a part of your code that will take a percentage (p) of the total runtime will benefit the total program by the inverse of the sum of 1 – p and p/s. So if you speed up a program that takes 30 percent of the runtime by a factor of two, you’ll speed up the whole program by 15 percent.
So now you have hot code that could run on multiple cores. Often that will be loops, so make the outermost parallelizable loop you can find parallel using rayon. It’s not optimal in all cases, but it offers acceptable overhead for a very easy change to try out if parallel computation really wins.
A word of caution: be wary about the workloads you test. Creating a benchmark that will correctly measure a certain effect on performance is a subtle art. This is outside the scope of this article, but I have wrongly attributed an effect that was, in reality, due to a confounding factor enough times to make me very careful about benchmark design. And that’s no guarantee that I’ll be right with my next benchmark. In any event, the Criterion benchmark harness can help you follow best practices.
Optimizing code for performance is often a fun game, but it’s easy to get lost in it. Keep in mind that every optimization comes with increased complexity, loss of readability and maintainability, and an expanded attack surface for bugs, not to mention a strain on your time. So set clear a performance goal and stop once you reach it.
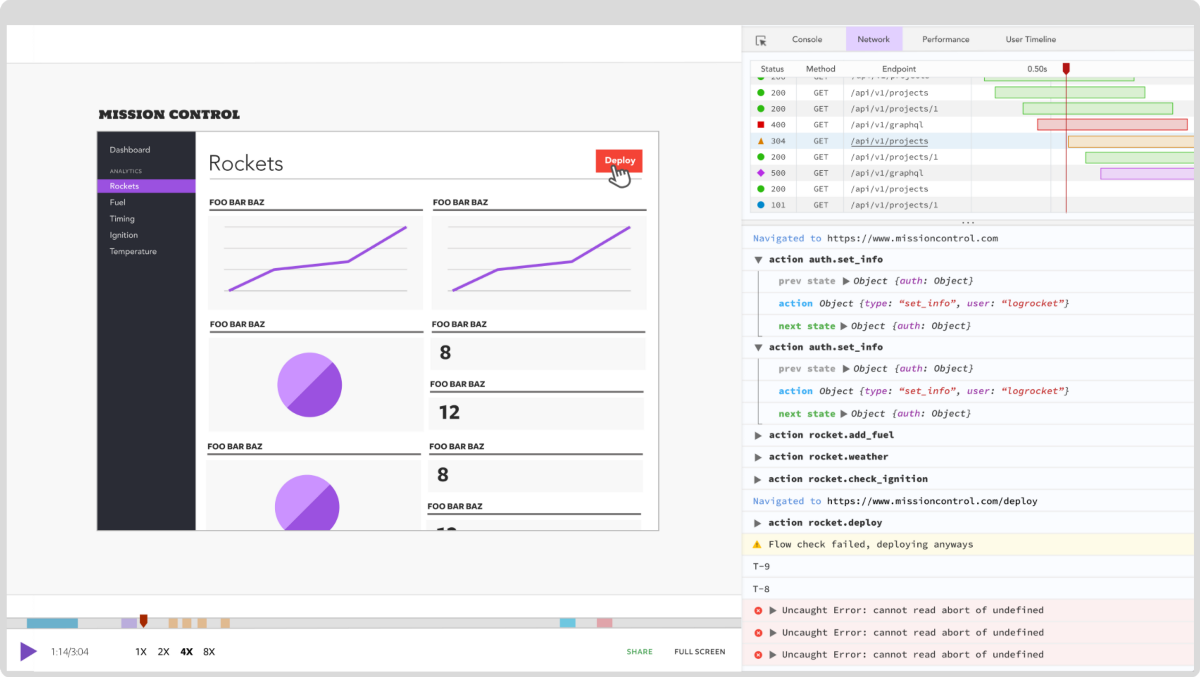
Debugging Rust applications can be difficult, especially when users experience issues that are hard to reproduce. If you’re interested in monitoring and tracking the performance of your Rust apps, automatically surfacing errors, and tracking slow network requests and load time, try LogRocket.
LogRocket lets you replay user sessions, eliminating guesswork around why bugs happen by showing exactly what users experienced. It captures console logs, errors, network requests, and pixel-perfect DOM recordings — compatible with all frameworks.
LogRocket's Galileo AI watches sessions for you, instantly identifying and explaining user struggles with automated monitoring of your entire product experience.

Modernize how you debug your Rust apps — start monitoring for free.
Hey there, want to help make our blog better?
Join LogRocket’s Content Advisory Board. You’ll help inform the type of content we create and get access to exclusive meetups, social accreditation, and swag.
Sign up now
Not sure if low-code is right for your next project? This guide breaks down when to use it, when to avoid it, and how to make the right call.

Compare Firebase Studio, Lovable, and Replit for AI-powered app building. Find the best tool for your project needs.

Discover how to use Gemini CLI, Google’s new open-source AI agent that brings Gemini directly to your terminal.

This article explores several proven patterns for writing safer, cleaner, and more readable code in React and TypeScript.