React Native applications, like any software, can encounter crashes during development and production. These crashes may arise for various reasons, such as the use of incompatible dependencies, incorrect data handling, programming errors, or hardware failure. If not promptly identified and fixed, the crashes can lead to a frustrating user experience, which will result in poor reviews on app stores.

In React Native, application crashes may result from issues in either JavaScript or native components. In this article, we’ll focus on crashes that originate from the underlying native components and discuss how to diagnose these crashes with Logcat.
To follow along with this article, you should:
Jump ahead:
The Replay is a weekly newsletter for dev and engineering leaders.
Delivered once a week, it's your curated guide to the most important conversations around frontend dev, emerging AI tools, and the state of modern software.
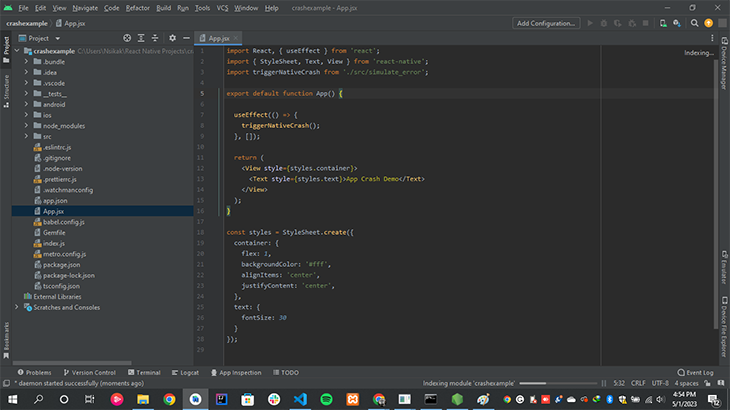
To simulate a crash in our demo application, we’ll use the react-native-crash-tester package to force the application to crash on startup.
To follow along, clone the demo application from GitHub using the command below:
git clone https://github.com/emmanuelhashy/debug-react-native-crash-example.git
Logcat is a command-line tool that outputs log messages generated by system processes, hardware components, and user applications in a mobile device. The Logcat window is also a part of the Android SDK, which means you need to have the SDK on your machine to use it.
With Logcat, we can view, filter, and analyze logs generated by our application while it is running. It’s useful for debugging React Native applications in two ways:
Log messages are classified into six levels according to their level of importance. These include:
true turns out to be falseDuring debugging, we can filter log messages based on these levels to get the most relevant information. An example of log messages is shown below:
To begin debugging with the Logcat CLI, ensure that either your Android device is connected via USB or you have an Android emulator running.
Next, run the command below in a terminal to launch your React Native application if it’s not already running:
npx react-native run-android
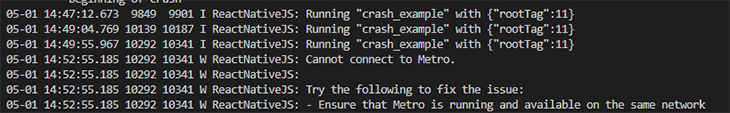
While the application is running, we can view log messages related to React Native by running the following command in a terminal:
adb Logcat "*:S" ReactNative:V ReactNativeJS:V
This command shows the log messages generated by both the native and JavaScript components of our application. However, these messages — while useful for debugging — may not tell us why our application crashed.
To view logs related to the application’s crash, we can filter the log messages to only those at the Error level by running the following command in a terminal:
adb Logcat *:E
The command above will show the Error-level log messages generated in the device. However, these messages may be quite difficult to navigate, as new messages are produced quickly. For this reason, we can further filter the log messages to show those with a specific log tag.
Log messages usually contain tags to identify message sources. For example, messages produced by React Native components usually have the ReactNative and ReactNativeJS tags.
Generally, when an Android application crashes, a stack trace is produced as part of the logs. These logs often contain the AndroidRuntime log tag, which we can use to filter for messages related to our application’s crash, as shown in the example below:
adb Logcat "*:S" AndroidRuntime:E
The command above will show the stack trace of the event that led to the crash, as illustrated below:
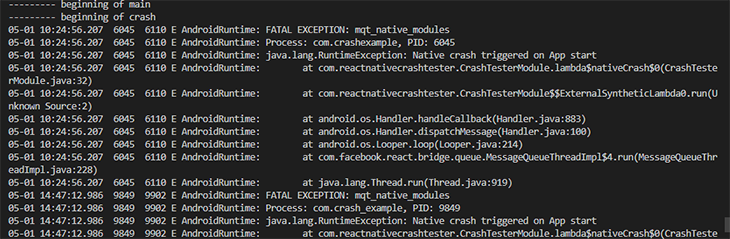
The stack trace contains the following information, which we can use to further diagnose the reason for the application crashing:
By examining the stack trace and the code that triggered the exception, you can identify the problem that led to the application’s crash.
As noted previously, Android Studio provides the Logcat viewer, a GUI we can use to view and filter log messages easily.
Let’s begin by opening the project in Android Studio:
Next, launch the application on the connected Android device or emulator by executing the command below in a terminal:
npx react-native run-android
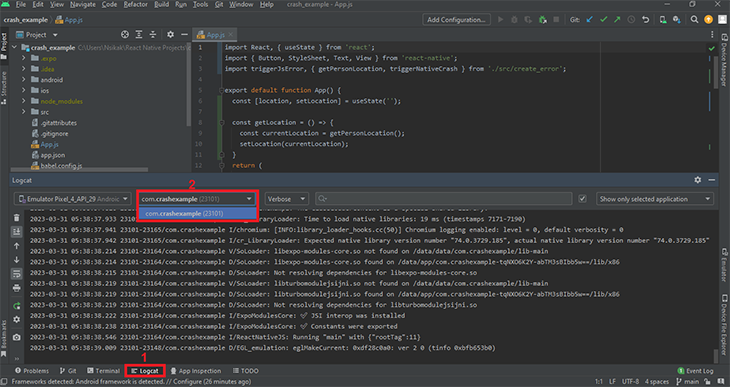
After that, click the Logcat tab in the bottom pane of the IDE. In the Logcat pane, select the application’s package name from the dropdown list, as shown below:
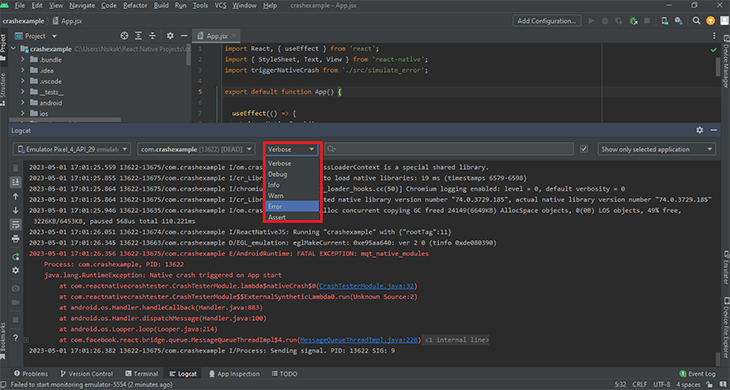
Next, click the log levels dropdown menu to select a log level; we are only interested in the Error log level:
Afterward, scroll through the log messages in the Logcat viewer to see the stack trace of the exception that led to the crash:
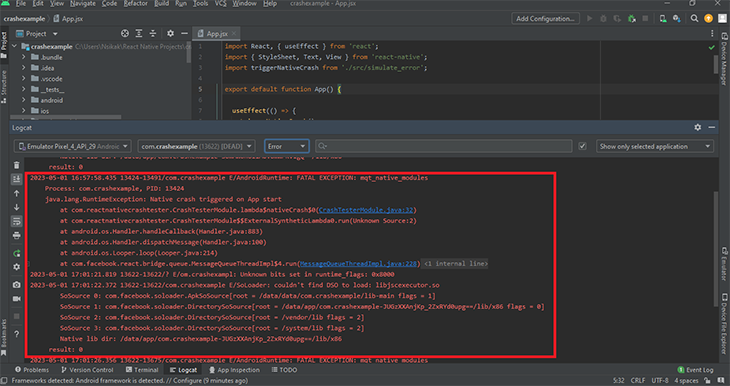
As you can see from the image above, the Logcat viewer shows a stack trace of the exception that triggered the crash. This information can now be used to further diagnose the problematic part of the code that caused the crash.
In addition, we can use the search bar in the Logcat viewer to easily navigate and look through log messages displayed by the Logcat.
In the previous sections, we’ve seen examples of how to debug crashes that arise immediately after launching an application. Nonetheless, we can also use Logcat to debug crashes that occur during the lifecycle of our application, even while the application is running in the background by following the same steps.
In most cases, you’ll have to examine the logs to identify the error messages related to the crash. Look for messages containing these keywords:
These logs will give you valuable information about the cause of the crash and potential fixes.
Once you’ve identified the error causing the crash, you can take the necessary steps to fix it. The solution will depend on the specific error message, but some common issues include:
A lot of time can be spent trying to diagnose why an application is crashing. However, we can put different measures in place to ensure that errors are caught in time, saving development time.
Some of the proactive steps we can take include:
The Logcat is a powerful tool for debugging crashes in React Native applications. By analyzing the log messages and stack traces generated by Logcat, you can identify the source of the crash in your application. Through the use of filters, you can focus on specific tags, log levels, or processes, to streamline your debugging process.
Overall, Logcat is a crucial tool in any React Native developer’s debugging toolkit. With careful analysis and troubleshooting, you can quickly resolve crashes and improve the stability and performance of your app.
LogRocket's Galileo AI watches sessions for you and and surfaces the technical and usability issues holding back your React Native apps.
LogRocket also helps you increase conversion rates and product usage by showing you exactly how users are interacting with your app. LogRocket's product analytics features surface the reasons why users don't complete a particular flow or don't adopt a new feature.
Start proactively monitoring your React Native apps — try LogRocket for free.

Learn what context rot is, why AI agent sessions degrade over time, and how to fix it with compaction, prompt anchoring, context files, plan files, and RAG.

Learn about TypeScript v6’s breaking changes, new ES2025 features, and deprecated options. A complete migration guide from v5 to prepare for v7.

Learn how Vite+ unifies Vite, Vitest, Oxlint, Oxfmt, Rolldown, and Node.js management in one CLI.

AI companies are buying developer tools as coding agents turn runtimes, package managers, and linters into strategic infrastructure.
Would you be interested in joining LogRocket's developer community?
Join LogRocket’s Content Advisory Board. You’ll help inform the type of content we create and get access to exclusive meetups, social accreditation, and swag.
Sign up now