Freezing web pages, sluggish UX, handling numerous components, slow rendering, and unnecessary re-rendering are common issues you might encounter when building a React application if you do not optimize your app’s performance.

This article will highlight performance optimization tools that can help you identify potential problems in your React application so you can achieve UX perfection. These tools include the Profiler API, React.memo(), and the React Developer Tools.
The Replay is a weekly newsletter for dev and engineering leaders.
Delivered once a week, it's your curated guide to the most important conversations around frontend dev, emerging AI tools, and the state of modern software.
The Profiler API (not the one from the Chrome Dev tools) is a relatively new React component developed by B. Vaughn. It provides a means to track how many times your components are re-rendered and the “cost” of rendering, i.e., the time and resources affected by that re-render.
With it, you can quickly identify slow and defecting areas of your application that may need to be optimized by memoization.
The Profiler API typically requires two props: the id and an onRender callback function that collects time metrics anytime a component wrapped by the <Profiler /> is mounted or updated. It is a very efficient tool for detecting lagging components in your React app.
The code snippet below shows how to profile a Footer component:
import React, { Profiler } from "react";
return(
  <App>
    <Profiler id="Footer" onRender={callback}>
      <Footer {...props} />
    </Profiler>
    <Main {...props} />
  </App>
);
You can also use multiple <Profiler/> components to keep track of different parts of your application:
return(
  <App>
    <Profiler id="Footer" onRender={callback}>
      <Footer {...props} />
    </Profiler>
    <Profiler id="Main" onRender={callback}>
      <Main {...props} />
    </Profiler>
  </App>
);
<Profiler /> components can also be nested in a manner with which you can access distinct components inside the same tree:
return(
  <App>
    <Profiler id="Panel" onRender={callback}>
      <Panel {...props}>
        <Profiler id="Main" onRender={callback}>
          <Main {...props} />
        </Profiler>
        <Profiler id="PreviewPane" onRender={callback}>
          <PreviewPane {...props} />
        </Profiler>
      </Panel>
    </Profiler>
  </App>
);
These are just different ways to use the <Profiler /> to track your application’s performance.
onRender callbackThe <Profiler/> requires an onRender method as a prop. This function runs when a component in the profiled tree “commits” a change. It gets information about what was rendered and how long it took:
function callback(id, phase, actualTime, baseTime, startTime, commitTime, interactions) {
  // aggregate or log render timings...
}
Now, let’s define the props:
id prop is used to identify the Profiler reporting; if you’re using several profilers, this can help you figure out what portion of the tree was compromisedphase(mount/update) will report whether the component tree was mounted for the first time or was re-rendered based on a change in props, state, or hooksactualTime is the amount of time it took for the Profiler to mount or update its descendantsbaseTime is the duration of the most current render time for each componentstartTime is the timestamp when the Profiler started measuring its descendants’ mount/render timecommitTime is the time it took to commit an update. All profilers share this value in a commit, making it possible to group them if desiredinteractions is a set of “interactions” tracked when the update was scheduled, for instance, when you schedule setState functionAlthough the API for tracking interactions is still experimental, it can become very effective when determining the cause of an update. You can learn more about it here.
import React, { Profiler } from "react";
const callback = (id, phase, actualTime, baseTime, startTime, commitTime) => {
  console.log(`${id}'s ${phase} phase:`);
  console.log(`Actual time: ${actualTime}`);
  console.log(`Base time: ${baseTime}`);
  console.log(`Start time: ${startTime}`);
  console.log(`Commit time: ${commitTime}`);
};
return (
    <>
      <Profiler id="CurrencyInput" onRender={callback}>
      <CurrencyInput
         props={props}
         />
        </Profiler>
    </>
);
In the example above, the <Profiler/> is wrapped around the CurrencyInput component enabling you to access a bunch of helpful information about this component when it mounts. In this case, you can access that information on the console:
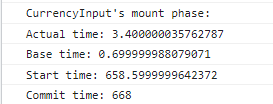
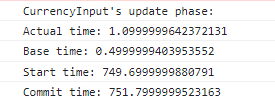
These parameters will aid in determining which component tree is slowing your app down and which is performing well.
You can use the <Profiler /> when:
The Profiler API was also very recently disabled in production builds due to its minor impact on performance. While this isn’t usually a concern because most serious performance issues will be noticeable in production and development builds, that isn’t always the case. Sometimes you may want to access your component’s rendering time on the production bundle.
React.memo()React.memo() is a function that tends to come in handy when handling unnecessary re-rendering. It helps to improve the rendering efficiency of functional components and hooks by making sure React skips the re-rendering of a component if its props have not changed on mounting/updating. The memo stands for memoization.
React.memo()Wrapping your function component in the React.memo() function is the most common way to use it:
const Stone = React.memo(() => {
  return (
    <div className="black-stone">
      <Task />
    </div>
  );
});
Consider the example below:
const Component1 = () => {
  console.log("Component 1 rendered")
  return (
    <>
      <p>Component 1</p>
      </>
  )
}
const Component2 = () => {
  console.log("Component 2 rendered")
  return (
    <div>
      <p>Component 2</p>
      </div>
  )
}
const SampleApp = () => {
  const [counter, setCounter] = React.useState(0)
  return (
    <div>
      <div>Count: {counter}</div>
      <Component1 />
      <Component2 />
      <button onClick={() => setCounter(counter + 1)}>increase count</button>
  </div>
  )
}
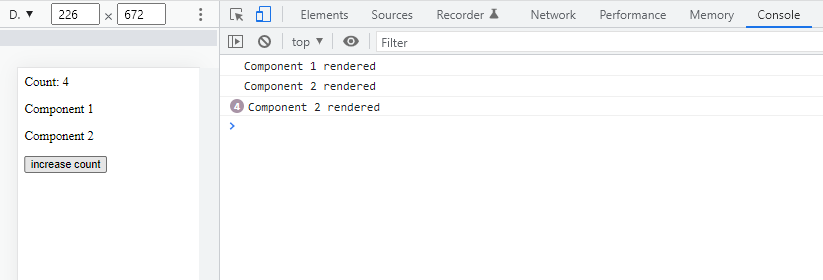
The code above is a simple React application containing two components: Component1 and Component2, which are housed by the App component. These two components will report to the console whenever rendered or re-rendered.
The App component also has a counter state variable that dynamically changes on the click of the increase count button, causing Component1 and Component2 to re-render.
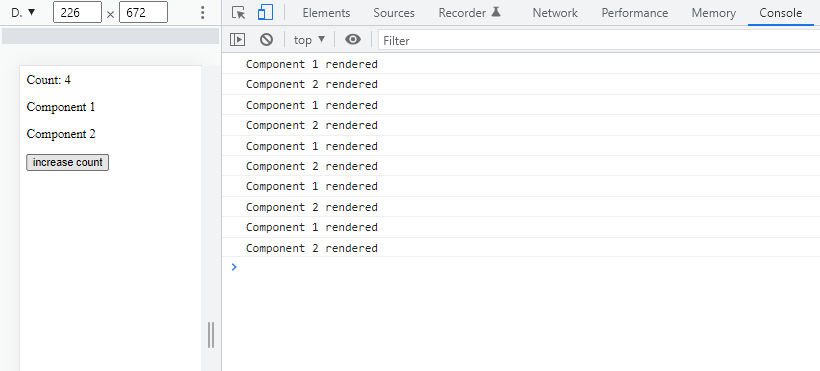
After clicking the button four times (increasing the count to four), you can see that we have five logs for each component: one for the initial render and an extra four for every time the button is clicked (i.e., every time these components are re-rendered). This is a performance problem that you may be inclined to ignore as it may go unnoticed in smaller projects, but it comes to play in much larger ones, making your app redundant and slow.
The good news is that you can quickly fix this problem with React.memo(). For instance, if you do not want Component1 to re-render when you click the button, here’s how:
const Component1 = React.memo(function Component1(props) {
  console.log("Component 1 rendered")
  return (
    <div>
      <p>Component 1</p>
      </div>
  )
});
Now that we have wrapped Component1 with React.memo(), let’s head back to the console and see how that affects our app:
As you can see, Component1 doesn’t re-render when the counter is increased, thereby fixing our problem.
React.memo()It is best to use React.memo() when:
React.memo()Avoid using React.memo() when the performance benefits are impossible to evaluate. If the computational time for re-rendering our component (with and without this higher-order component) is small or non-existent, then utilizing React.memo() is pointless.
While it is feasible to include wrap class components with React.memo, it is considered bad practice, so it is highly discouraged. Instead, extending the PureComponent class is more desirable, which is a much cleaner way to memoize your class components.
As a rule of thumb, if you can’t measure the performance advantages, don’t use memoization.
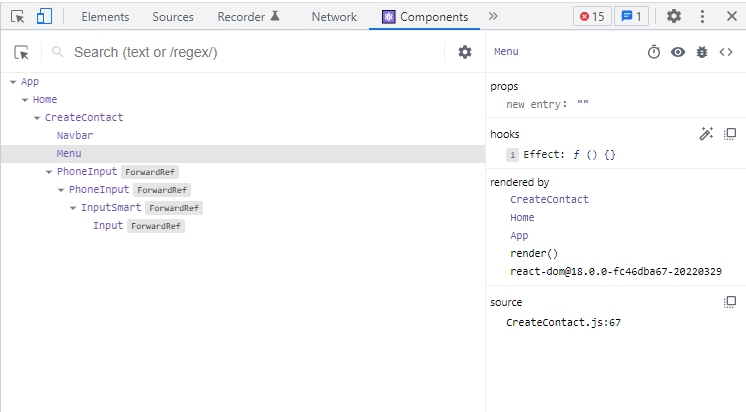
React has a Chrome DevTools extension called React Developer Tools. The React Developer tools have two tabs: ⚛️ Components and ⚛️ Profiler.
The Components tab gives you access to your app’s component hierarchy and its state information. It displays both the root React components and the subcomponents rendered on the page.
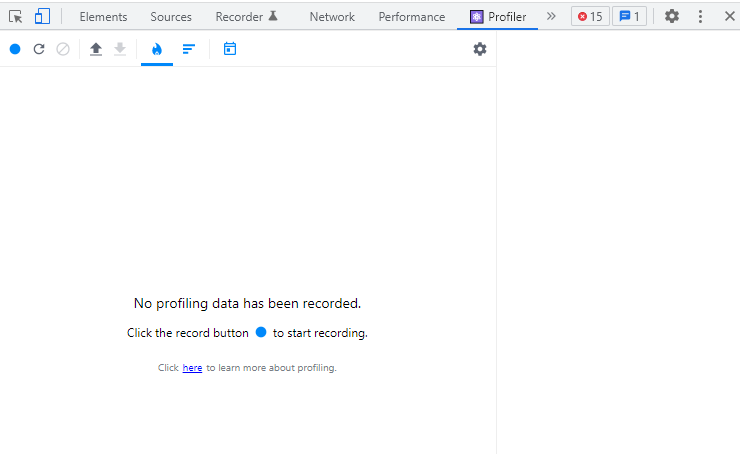
The Profiler tab aids performance optimization because it gives you a perfect analogy of your app structure and component rendering time.
Note that you must be using React v.16.5 or higher to access React Developer Tools.
By profiling a React application, you can readily attain all the necessary data that illustrates the app’s all-around performance, which allows you to optimize it by memoizing with React.memo().
There are three easy steps to using the Profiler:
Typically, React runs in two phases: the render phase, which decides what DOM changes are to be made, and the commit phase, where the actions are actually carried out.
React’s Profiler collates your app’s performance information and displays them in the form of commits represented by bar charts as illustrated below.
![]()
These charts come in three different forms.
This graph represents your component’s current state for a single commit. Each bar represents a component in your app, and the length of each bar is determined by its corresponding component’s render time, so the longer your component’s render time, the longer the bar becomes.
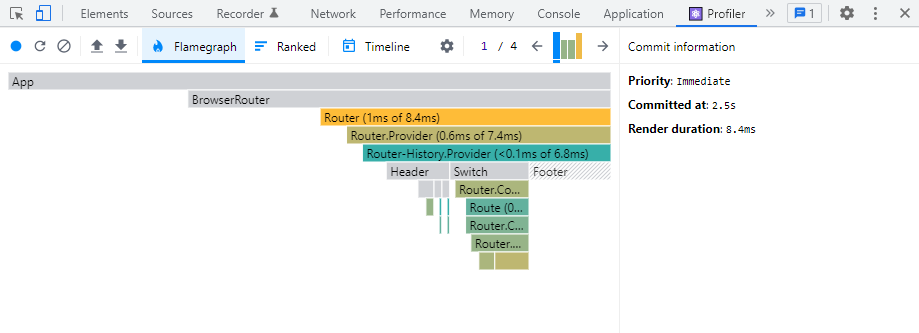
The app above shows that Router.Provider took longer to render than the Router.Consumer. You can click each bar to get the specific commit information for each component.
You can also get a sense of how long each component took to render by looking at the colors of the bars. The colors are interpreted as follows:
This graph displays the results in ranked order of each component’s time to render or re-render. The component which takes the longest time is on top.
With this graph, you can immediately detect which components slow your application down and which ones impact page reloads most.
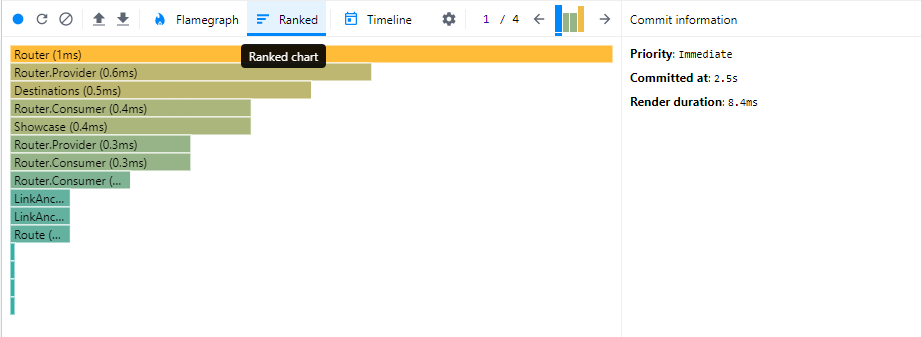
The Router has the longest render time from the sample app above.
You can access a component’s chart by double clicking any bars representing that component. This chart provides information on your component’s lifecycle during profiling time.
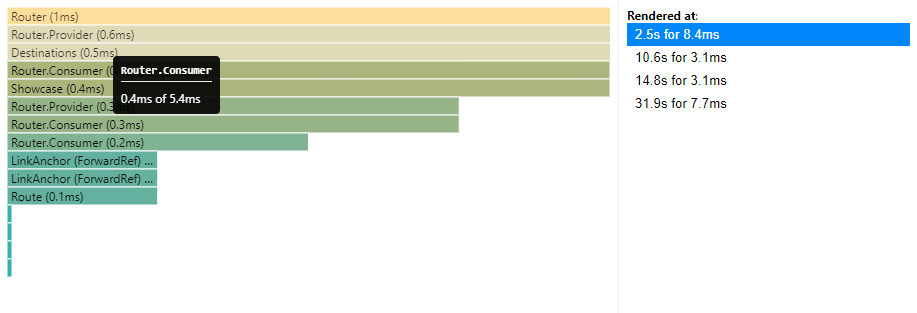
As I mentioned earlier, the Profiler provides helpful information like your app’s run time, component re-render time, and commit information. These results are essential because they give you an overview of the application in different ways, enabling you to figure out which components are causing the long renders and optimize them using techniques like memoization to avoid unwanted re-renders.
It’s a piece of cake to uncover performance issues in your React application after learning how to use this Chrome DevTools plugin successfully.
You can use React Developer Tools when:
As much as the Profiler gives you access to your app’s component information, it does not actively solve the problem, it only shows it to you. You still need to actively apply optimization techniques like memoization to improve your app’s performance.
Memoization in React terms is an optimization technique in which the child component only re-renders if the props change when the parent component re-renders. If the props remain unchanged, it will skip the
rendermethod and return the cached result.
| React Developer Tools Profiler | The Profiler API (<Profiler/>) | React.memo() | |
|---|---|---|---|
| What does it do? | Analyses your application and returns a graphical representation of the results. | Analyses your application and produces a programmatic representation of the results. | It is used to memoize components where necessary based on results gotten. |
| Does it display component render time? | Yes | Yes | No |
| Is it effective on the production bundle? | No | No | Yes |
Looking at these tools, the React Dev Tools Profiler just edged in front for me simply because it is easy to use, well documented, and gives you full access to your component tree structure in a graph-like manner. It couldn’t be easier to identify performance “hiccups” in a React application.
This guide has demonstrated some of the tools available for profiling React apps and identifying performance concerns. We also went over memoization and how to use the React.memo() function to improve your app’s overall performance. Happy coding!
Install LogRocket via npm or script tag. LogRocket.init() must be called client-side, not
server-side
$ npm i --save logrocket

// Code:

import LogRocket from 'logrocket';
LogRocket.init('app/id');
// Add to your HTML:

<script src="https://cdn.lr-ingest.com/LogRocket.min.js"></script>
<script>window.LogRocket && window.LogRocket.init('app/id');</script>

Learn how to build a full React Native auth system using Better Auth and Expo — with email/password login, Google OAuth, session persistence, and protected routes.

Compare the top AI development tools and models of June 2026. View updated rankings, feature breakdowns, and find the best fit for you.

Learn how Bloom filters reduce database lookups for username availability checks while preserving correctness at scale.

Learn how to test Nuxt apps with Vitest, @nuxt/test-utils, runtime mocks, server route mocks, and Playwright e2e tests.
Would you be interested in joining LogRocket's developer community?
Join LogRocket’s Content Advisory Board. You’ll help inform the type of content we create and get access to exclusive meetups, social accreditation, and swag.
Sign up now