Logging is an important concept in software engineering. By writing out an audit of events that occur in an application, logs provide insight to developers when trying to understand what an app’s code actually does.
In this post, we’ll compare different logging tools for Node.js, including:
But before we look at the comparisons, let’s dive into the elements of logging.
When working with logs in any application, it is important to understand logging levels. A logging level is a way of classifying the entries in a log file in terms of urgency and how to display them.
Each defined log message has an associated log level that gives a rough guide to the importance and urgency of the message. The most common logging levels in Nodejs are:
ERRORINFODEBUGWARNFATALEach of these log levels have their own use cases and how to apply them.
ERROR log levelThe ERROR level indicates a serious problem that must be dealt with. It designates error events that might still allow the application to continue running.
INFO log levelThis log level keeps track of an event that has occurred. These alerts can usually be ignored, assuming the rest of the system continues to operate normally.
It basically indicates informational messages that highlight the progress of the application at a granular level.
DEBUG log levelThe DEBUG log level contains information that is only useful during the debug phase and may be of little value during production. They are basically informational events that are most useful when debugging an application.
WARN log levelThe WARN log level is slightly less severe than error conditions because they indicate potentially harmful situations. The message indicates that an unexpected event occurred in an application that may disrupt or delay other processes.
FATAL log levelThis log level indicates very severe error events that presumably lead the application to abort.
Now that we understand the different log levels, we can dive into the different logging tools in Node.js and how to use them in our application.
Bunyan is a very popular logging tool in Node.js. It is a simple and fast JSON logging library for Node.js services that provides a beautiful logging CLI view describing the different logging levels in different colors.

To install Bunyan, add the following to your terminal:
npm i bunyan
To start logging with Bunyan, create a test.js file and add this code for testing purposes:
const bunyan = require('bunyan');
After requiring the package, we must define an instance of the logger using the createLogger method:
var log = bunyan.createLogger({
  name: '<name of application',
  stream: process.stdout
});
We can then use Bunyan to log data:
log.info('hi');
If we run our test.js file, we get this output in the console:
{"name":"myapp","hostname":"banana.local","pid":40161,"level":30,"msg":"hi","time":"2013-01-04T18:46:23.851Z","v":0}
Here it is clear that Bunyan advocates that logs should be in JSON format and each log carries the date when the log was made. A common practice in Node.js is storing these log entities in a file for reference purposes.
Bunyan supports multiple runtimes in addition to Node.js like Webpack, Browserify, and NW.js.
Bunyan also has the concept of serialization where functions produce a JSON-able object from a JavaScript object. Here, a particular logger instance can have a serializer that maps a log record field name to a serializer function.
And with child logging, developers can specialize a logger for a subcomponent of an application, like creating a new logger with additional bound fields that are included in its log records.
Winston is a top Node.js logging library with over 17k stars on GitHub at the time of writing this post due to its large community and functionality.
Winston decouples parts of logging and makes it extensible and flexible with a lot of configuration, making development seamless.
To install Bunyan, add the following to your terminal:
npm i winston
After installing the library, we must require the library in our root file and create an instance of it:
const winston = require('winston');
const logger = winston.createLogger({})
The createLogger methods can hold a lot of configurations such as the log level, the format, and a meta description:
const logger = winston.createLogger({
  level: 'info',
  format: winston.format.json(),
  defaultMeta: { service: '<service>' },
});
Also, we can specify a file where all logs are written to by including the file in the transport array:
const logger = winston.createLogger({
  level: 'info',
  format: winston.format.json(),
  defaultMeta: { service: 'user-service' },
  transports: [
    new winston.transports.File({ filename: 'error.log', level: 'error' }),
    new winston.transports.File({ filename: 'combined.log' }),
  ],
});
Here we are setting all logs with a log level of error must be written into the error.log file while all other logs must be written into the combined.log file.
We can also choose to only display our logs in the console by using this configuration in the transport array:
new winston.transports.Console()
To get all the methods that Winston provides, you can reference the documentation.
Winston gives the ability to send logs to other cloud logging services such as logz.io and AWS Cloudwatch instead of storing logs in a static file or logging them on the console.
Since each log has a timestamp and a log level, logs can be easily traced based on any occurrences.
Pino touts itself as a “very low overhead” Node.js logger because it uses minimum resources for logging. With Pino, logged messages are added over time, thus leading to a throttling effect on applications such as reduced requests per second.
Throttling is a methodology where, no matter how many times the user fires the event, the attached function executes only once in a given time interval.
To install Pino, add the following to your terminal:
npm i pino
Using this library is quite easy and very straightforward. All you have to do is require the library and initialize it:
const logger = require('pino')()

logger.info('hello world')
Running this script produces the following on the console:
{"level":30,"time":1531171074631,"msg":"hello world","pid":657,"hostname":"Davids-MBP-3.fritz.box"}
This logged data on the console consists of the log level, the time the data was logged, the actual message of the log, the id of the log, and the host.
You can also use Pino in your Express.js application by installing this package:
npm install pino-http
After installing this library, you can use it in your Express.js application like so:
const express = require('express')
const pino = require('pino-http')

const app = express();
const pinoInstance = pino()

app.use(pinoInstance);

app.post('/do-stuff', (req,res) => {
  req.log.info('Something done');
  res.send('Say hello to Pino')
})

app.listen(5500)
Pino has a module that provides a basic NDJSON formatter called pino-pretty.
The Newline Delimited JSON, or NDJSON, is a convenient format for storing or streaming structured data that can process one record at a time. All logged data applies extra formatting by considering things like the log level and timestamp.
You can install pino-pretty on your project or globally on your local machine.
To install pino-pretty, run this command:
npm install -g pino-pretty
After installing, you can run your application using the following command:
node app.js | pino-pretty
Morgan is a Node.js library used for logging HTTP requests. It is usually added as a middleware so that it can track all requests made. Unlike other logging tools, its primary function is to log HTTP requests.
To install Morgan, add the following to your terminal:
npm i morgan
After installation, you must require the library and then add it as an Express.js middleware:
var morgan = require('morgan')

app.use(morgan('dev'))
The dev passed is a Morgan format. Morgan implements five logging formats:
combined, which uses the standard Apache combined log outputcommon, which uses the standard Apache combined log outputdev, which uses concise output colored by the response status for development useshort, which includes response time and shortens the log by defaulttiny, which uses a minimal outputYou can then use these formats as seen below:
app.use(morgan('combined'))
app.use(morgan('common'))
app.use(morgan('dev'))
app.use(morgan('short'))
app.use(morgan('tiny'))
Without having to write extra configuration codes, Morgan gives you the ability to choose any of the predefined formats that were created depending on your niche, saving you time.
This is the official logger utility that npm uses. Just like other Node.js logging libraries, it supports custom levels, colored output, and gives you the ability to set different colors for your different log levels.
To install Npmlog, add the following to your terminal:
npm i npmlog
To begin using the library, create a test file and then require the package:
const log = require('npmlog');
log.info('Wisdom Ekpot', 'Hello from logrocket', {'message': 'test'})
The log.info logs data on the console or file and it can accept up to there parameters:
Just like every other logging tool, npmlog comes with a lot of methods to simplify development such as setting log headers, heading styles, and defining log levels.
Below is a quick comparison of the Node.js logging libraries we covered in this article; all data is accurate at the time of posting this article.
| Library | Number of weekly downloads | Github stars | Github forks |
|---|---|---|---|
| Bunyan | 1,568,274 | 6.7k | 522 |
| Winston | 6,364,282 | 17.8k | 1.6k |
| Pino | 1,836,807 | 7.8k | 530 |
| Morgan | 2,873,389 | 6.7k | 485 |
| npmlog | 13,220,573 | 358 | 55 |
Going through all these Node.js logging tools, it shows that it’s quite simple and straightforward to implement logging in any of our Node.js projects. It is often recommended to use the library that fits your application purpose and displays the actual data needed.
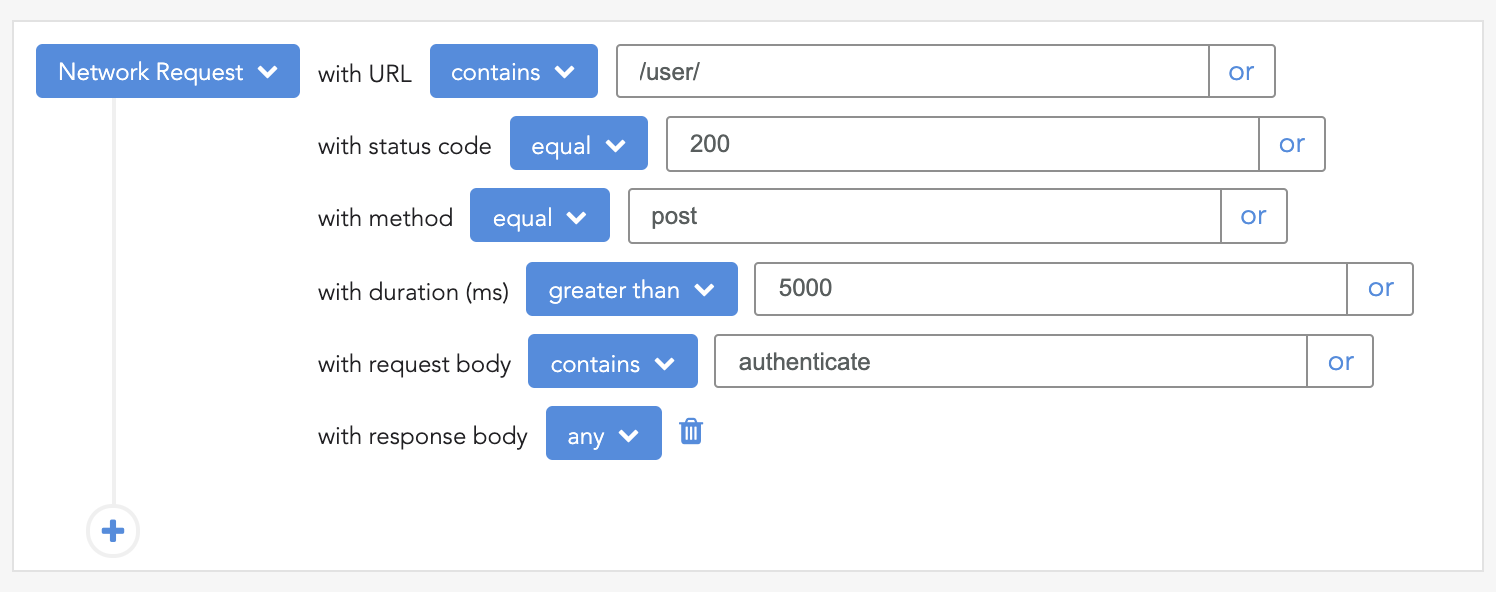
 Monitor failed and slow network requests in production
Deploying a Node-based web app or website is the easy part. Making sure your Node instance continues to serve resources to your app is where things get tougher. If you’re interested in ensuring requests to the backend or third-party services are successful, try LogRocket.
LogRocket lets you replay user sessions, eliminating guesswork around why bugs happen by showing exactly what users experienced. It captures console logs, errors, network requests, and pixel-perfect DOM recordings — compatible with all frameworks.
LogRocket's Galileo AI watches sessions for you, instantly identifying and explaining user struggles with automated monitoring of your entire product experience.
LogRocket instruments your app to record baseline performance timings such as page load time, time to first byte, slow network requests, and also logs Redux, NgRx, and Vuex actions/state. Start monitoring for free.
Hey there, want to help make our blog better?
Join LogRocket’s Content Advisory Board. You’ll help inform the type of content we create and get access to exclusive meetups, social accreditation, and swag.
Sign up now
Discover how to use Gemini CLI, Google’s new open-source AI agent that brings Gemini directly to your terminal.

This article explores several proven patterns for writing safer, cleaner, and more readable code in React and TypeScript.
A breakdown of the wrapper and container CSS classes, how they’re used in real-world code, and when it makes sense to use one over the other.

This guide walks you through creating a web UI for an AI agent that browses, clicks, and extracts info from websites powered by Stagehand and Gemini.