In this article, we’re going to have a look at some techniques to analyze and improve the performance of Rust web applications.

The field of performance optimization in Rust is vast, and this tutorial can only hope to scratch the surface. For a great overview of the tooling and technique landscape within Rust when it comes to performance, I would very much recommend The Rust Performance Book by Nicholas Nethercote.
In this tutorial, we will look at a way to measure web application performance and explore a tool to analyze and improve your Rust code in general.
If this post reaches its goal, you should walk away with some useful knowledge to improve the performance of your Rust web applications along with some good resources to dive deeper into the topic.
Let’s get started!
The Replay is a weekly newsletter for dev and engineering leaders.
Delivered once a week, it's your curated guide to the most important conversations around frontend dev, emerging AI tools, and the state of modern software.
To follow along, all you need is a recent Rust installation (1.45+) and a Python3 installation with the ability to run Locust.
First, create a new Rust project:
cargo new rust-web-profiling-example
cd rust-web-profiling-example
Next, edit the Cargo.toml file and add the dependencies you’ll need:
[dependencies]
tokio = { version = "1.1", features = ["macros", "time", "rt-multi-thread", "sync"] }
warp = "0.3"

[profile.release]
debug = true
All we need for this tutorial is a small web service, so we’ll use Warp and Tokio to create it. The techniques discussed in this article will work with any other web frameworks and libraries, however.
Note that we set debug=true for the release profile, which means that we will have debug information even in the release build. The reason for this is that we always want to do performance optimization in release mode with all compiler optimizations. However, we also would like to have as much information as possible about the running code, which makes profiling a lot easier.
First, we create a very basic Warp web service with a shared resource and a couple of endpoints to test.
We start by defining some types:
type WebResult<T> = std::result::Result<T, Rejection>;

#[derive(Debug, Clone)]
pub struct Client {
    pub user_id: usize,
    pub subscribed_topics: Vec<String>,
}

pub type Clients = Arc<Mutex<HashMap<String, Client>>>;
The WebResult is simply a helper type for the result of our web handlers. The Clients type is our shared resource – a map of user ids to clients. A Client has a user_id and a list of subscribed topics, but that’s not particularly relevant for our example.
What is relevant is that this resource will be shared across our whole application and multiple endpoints will access it simultaneously. For that purpose, we wrap it in Mutex, to guard access and put it into an Arc smart pointer, so we can pass it around safely.
Next, we define some helpers to initialize and propagate our Clients:
fn with_clients(clients: Clients) -> impl Filter<Extract = (Clients,), Error = Infallible> + Clone {
    warp::any().map(move || clients.clone())
}

async fn initialize_clients(clients: &Clients) {
    let mut clients_lock = clients.lock().await;
    clients_lock.insert(
        String::from("87-89-34"),
        Client {
            user_id: 1,
            subscribed_topics: vec![String::from("cats"), String::from("dogs")],
        },
    );
    clients_lock.insert(
        String::from("22-38-21"),
        Client {
            user_id: 2,
            subscribed_topics: vec![String::from("cats"), String::from("reptiles")],
        },
    );
    clients_lock.insert(
        String::from("12-67-22"),
        Client {
            user_id: 3,
            subscribed_topics: vec![
                String::from("mice"),
                String::from("birds"),
                String::from("snakes"),
            ],
        },
    );
}
The with_clients Warp Filter is simply a way we can make resources available to routes in the Warp web framework. In initialize_clients, we add some hard-coded values to our shared Clients map, but the actual values aren’t particularly relevant for the example.
Then, we add a handler module, which will use the shared Clients:
use crate::{Clients, FasterClients, WebResult};
use std::time::Duration;
use warp::{reply, Reply};

pub async fn read_handler(clients: Clients) -> WebResult<impl Reply> {
    let clients_lock = clients.lock().await;
    let user_ids: Vec<String> = clients_lock
        .iter()
        .map(|(_, client)| client.user_id.to_string())
        .collect();
    tokio::time::sleep(Duration::from_millis(50)).await;
    let result = user_ids
        .iter()
        .rev()
        .map(|user_id| user_id.parse::<usize>().expect("can be parsed to usize"))
        .fold(0, |acc, x| acc + x);
    Ok(reply::html(result.to_string()))
}
This async web handler function receives a cloned, shared reference to Clients, accesses it, and gets a list of user_ids from the map.
Then, we use tokio::time::sleep to pause execution here asynchronously. This is just to simulate some time passing in this request – this might, for example, be a database call, or an HTTP call to another service in a real world application.
After the handler comes back from sleep, we do another operation on the user_ids, parsing them to numbers, reversing them, adding them up, and returning them to the user.
This is just so none of the code gets optimized out – this should simulate some CPU-bound work in this case.
Now, let’s wire everything up in main:
#[tokio::main]
async fn main() {
    let clients: Clients = Clients::default();
    initialize_clients(&clients).await;

    let read_route = warp::path!("read")
        .and(with_clients(clients.clone()))
        .and_then(handler::read_handler);

    println!("Started server at localhost:8080");
    warp::serve(read_route)
        .run(([0, 0, 0, 0], 8080))
        .await;
}
We simply create the Clients, initialize them, define the read route and start the server with this route on port 8080.
When we run this using cargo run, we can go to http://localhost:8080/read and we’ll get a response.
So far, so good. Let’s see how well this performs.
To test the performance of our web service and the read handler in particular, we will use Locust in this tutorial. However, any other load-testing application (such as Gatling) or your own tool to send and measure lots of requests to a web server, will suffice.
Installing Locust is rather simple – you can either install it directly, or within a virtualenv.
Now, with Locust installed, let’s create locust folder in our project, where we can add some load testing definitions:
from locust import HttpUser, task, between

class Basic(HttpUser):
    wait_time = between(0.5, 0.5)

    @task
    def read(self):
        self.client.get("/read")
Writing a locustfile is relatively straightforward, but if you want to dive deeper, the Locust documentation is fantastic.
In the above read.py example, we create a class called Basic based on HttpUser, which will give us all the Locust helpers within the class.
Then we define a @task called read, and this client simply makes a GET request to /read using the HTTP client Locust provides. We also define the wait_time property, which controls how long to wait in between requests. This is useful if the goal is to simulate real user behavior, but in our case we’ll just set it to 0.5 seconds.
Let’s run this using the following command:
locust -f read.py --host=http://127.0.0.1:8080
Now we can navigate to http://localhost:8089 and we’ll be greeted by the Locust web interface.
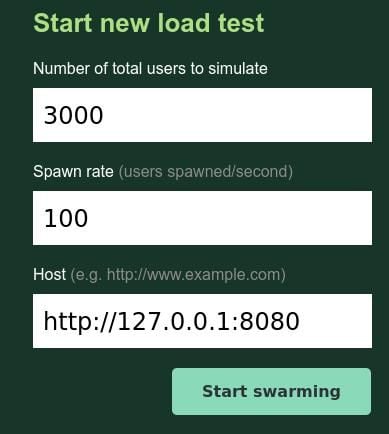
There, we can set the amount of users we want to simulate and how fast they should spawn (per second).

In this case, we want to spawn 3000 users with 100/s. These users will then make one /read request every 0.5 seconds until we stop.
This way, we can create some load onto the web service, which will help us find performance bottlenecks and hot paths in the code, as we’ll see later.
One important thing to note when optimizing performance in Rust, is to always compile in release mode. Don’t profile your debug binary, as the compiler didn’t do any optimizations there and you might just end up optimizing part of your code the compiler will improve, or throw away entirely.
So we run cargo build --release and then start the app using ./target/release/rust-web-profiling-example. Now our locusts can start to swarm!
You may have to increase the number of open files allowed for the locust process using a command such as ulimit -n 200000 in the terminal where you run Locust.
If we run the load test for a while, at least until all users were spawned and the response times stabilize, we might see something like this, upon stopping it:

We see that we managed to get a measly 19.5 requests per second and the requests took an average of 18+ seconds. There is clearly something wrong with our code – but we didn’t do anything fancy, and Rust, Warp and Tokio are all super fast. What happened?
If we review the code in our read_handler, we might notice that we’re doing something very inefficient when it comes to the Mutex lock:
pub async fn read_handler(clients: Clients) -> WebResult<impl Reply> {
    let clients_lock = clients.lock().await;
    let user_ids: Vec<String> = clients_lock
        .iter()
        .map(|(_, client)| client.user_id.to_string())
        .collect();
    tokio::time::sleep(Duration::from_millis(50)).await;
    let result = user_ids
        .iter()
        .rev()
        .map(|user_id| user_id.parse::<usize>().expect("can be parsed to usize"))
        .fold(0, |acc, x| acc + x);
    Ok(reply::html(result.to_string()))
}
We acquire the lock, access the data, and at that point, we’re actually done with clients and don’t need it anymore. However, since the clients_lock stays in the scope, especially for the whole duration of our fake DB call (sleep), that means we lock the resource for the whole duration of this handler!
Also, in this application, except for the initialization, we only ever read from the shared resource, but a Mutex doesn’t distinguish between read and write access, it simply always locks.
So there are two simple optimizations we can make here:
RwLock instead of a Mutex, since that doesn’t lock if there are only reads, but only if there is a writeSo in main we implement a FasterClients type using an RwLock:
pub type FasterClients = Arc<RwLock<HashMap<String, Client>>>;

#[tokio::main]
async fn main() {
    ...
    let faster_clients: FasterClients = FasterClients::default();
    initialize_faster_clients(&faster_clients).await;
    ...
    let fast_route = warp::path!("fast")
        .and(with_faster_clients(faster_clients.clone()))
        .and_then(handler::fast_read_handler);
    ...
    warp::serve(read_route.or(fast_route).or(cpu_route).or(cpu_route_alloc))
        .run(([0, 0, 0, 0], 8080))
        .await;
}

fn with_faster_clients(
    clients: FasterClients,
) -> impl Filter<Extract = (FasterClients,), Error = Infallible> + Clone {
    warp::any().map(move || clients.clone())
}

async fn initialize_faster_clients(clients: &FasterClients) {
    let mut clients_lock = clients.write().await;
    clients_lock.insert(
        String::from("87-89-34"),
        Client {
            user_id: 1,
            subscribed_topics: vec![String::from("cats"), String::from("dogs")],
        },
    );
    clients_lock.insert(
        String::from("22-38-21"),
        Client {
            user_id: 2,
            subscribed_topics: vec![String::from("cats"), String::from("reptiles")],
        },
    );
    clients_lock.insert(
        String::from("12-67-22"),
        Client {
            user_id: 3,
            subscribed_topics: vec![
                String::from("mice"),
                String::from("birds"),
                String::from("snakes"),
            ],
        },
    );
}
We initialize the FasterClients in the same way and pass it in the same way as Clients with a filter. We also define a route to /fast with the following handler:
pub async fn fast_read_handler(clients: FasterClients) -> WebResult<impl Reply> {
    let clients_lock = clients.read().await;
    let user_ids: Vec<String> = clients_lock
        .iter()
        .map(|(_, client)| client.user_id.to_string())
        .collect();
    drop(clients_lock);
    tokio::time::sleep(Duration::from_millis(50)).await;
    let result = user_ids
        .iter()
        .rev()
        .map(|user_id| user_id.parse::<usize>().expect("can be parsed to usize"))
        .fold(0, |acc, x| acc + x);
    Ok(reply::html(result.to_string()))
}
As you can see, we get past the FasterClients now and we drop the lock immediately after we’re done using it. This should give us quite a speed boost – let’s check.
In the read.py Locust file, you can comment out the previous /read endpoint and add the following instead:
    @task
    def read(self):
        self.client.get("/fast")
Let’s re-compile and run Locust again.

It’s faster, alright! We get about 820 requests per second, a 40x improvement, just by changing a type and dropping a lock earlier.
Now, at this point you might roll your eyes a bit at this contrived example, and I do agree that this probably isn’t an issue you will run into a lot in real systems. However, this post is about a workflow and tools we can use to find performance issues and the approach outlined so far is a good starting point for poking your application for inefficiencies.
Next, armed with a great way to load test our web application, we’ll do some actual profiling to get a deeper look into what happens under the hood of our web handlers.
Next, we’ll look at an actual profiling technique using the convenient cargo-flamegraph tool, which wraps and automates the technique outlined in Brendan Gregg’s flame graph article.
The basic idea is, to collect performance data using tools such as perf, or dtrace, in particular which functions take how much CPU time during the sampling and to then visualize the results in a way which can be interpreted nicely.
Flame graphs can also be used to do, among other analyses, Off-CPU Analysis, which can help find issues where threads are waiting for I/O a lot, for example.
In this example, we will only do CPU time analysis, which is supported by cargo-flamegraph.
First, let’s build a handler so we get a nice visualization:
pub async fn cpu_handler_alloc(clients: FasterClients) -> WebResult<impl Reply> {
    let clients_lock = clients.read().await;
    let user_ids: Vec<String> = clients_lock
        .iter()
        .map(|(_, client)| client.user_id.to_string())
        .collect();
    drop(clients_lock);

    let mut result = 0;
    for i in 0..1000000 {
        result += user_ids
            .iter()
            .cloned()
            .rev()
            .map(|user_id| user_id.parse::<usize>().expect("can be parsed to usize"))
            .fold(i, |acc, x| acc + x);
    }
    Ok(reply::html(result.to_string()))
}
In this (also rather contrived) example, we re-use the base of the /fast handler, but we extend the calculation to run inside a long loop. Also notice how we use .cloned() on the iterator, cloning the whole list for each iteration. This is a rather obvious performance issue, but when you’re juggling references and fighting with the borrow checker, it’s possible the odd superfluous .clone() makes it in your code which, inside of hot loops, might lead to performance issues.
We also add the handler in main:
...
    let cpu_route_alloc = warp::path!("cpualloc")
        .and(with_faster_clients(faster_clients.clone()))
        .and_then(handler::cpu_handler_alloc);
...
Let’s run cargo flamegraph to collect profiling stats with the following command:
cargo flamegraph --bin rust-profiling-example
Also, we add another Locust file in /locust called cpu.py:
from locust import HttpUser, task, between

class Basic(HttpUser):
    wait_time = between(0.5, 0.5)

    @task
    def cpu(self):
        self.client.get("/cpualloc")
This is essentially the same as before, just calling the /cpualloc endpoint.
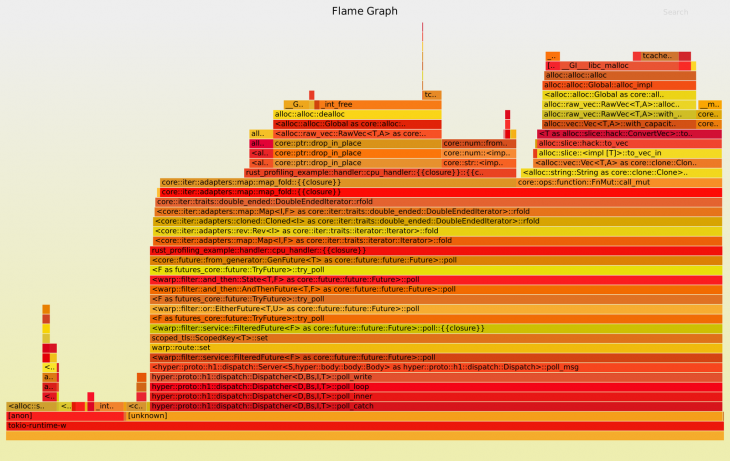
After running this load-test on our profiled application and stopping the running Rust web server using CTRL+C, we get a flame graph like this:

You can see the benefit of this visualization. We see, stacked up, where we spend most of the time during the load test. We can trace from the Tokio runtime up to our cpu_handler and the calculation. One thing to note is that we spend a lot of time doing allocations.
This is not very surprising as we added .cloned() to the iterator, which, for each loop iteration, clones the contents of the list before processing the data. We can see in between the allocation blocks that we also spend some time parsing the strings to numbers.
Let’s try to get rid of these unnecessary allocations. Again, this is a bit of a simplified example, and in real code you’ll likely have to dig a bit deeper to find underlying issues, but this demonstration shows you the tools and a workflow in order to approach performance issues in your code.
If you’re looking for memory-related performance issues specifically, you might want to take a look at the tools mentioned within the Profiling section of The Rust Performance Book, namely heaptrack, DHAT, or cachegrind.
Fixing this is pretty easy, we simply remove the .cloned() as we don’t need it here anyway, but as you might have noticed, unnecessary cloning can lead to big performance impacts, especially within hot code. Often, people who are not yet familiar with Rust’s ownership system use .clone() to get the compiler to leave them alone.
pub async fn cpu_handler(clients: FasterClients) -> WebResult<impl Reply> {
    let clients_lock = clients.read().await;
    let user_ids: Vec<String> = clients_lock
        .iter()
        .map(|(_, client)| client.user_id.to_string())
        .collect();
    drop(clients_lock);

    let mut result = 0;
    for i in 0..1000000 {
        result += user_ids
            .iter()
            .rev()
            .map(|user_id| user_id.parse::<usize>().expect("can be parsed to usize"))
            .fold(i, |acc, x| acc + x);
    }
    Ok(reply::html(result.to_string()))
}
And in main:
...
let cpu_route = warp::path!("cpu")
.and(with_faster_clients(faster_clients.clone()))
.and_then(handler::cpu_handler);
...
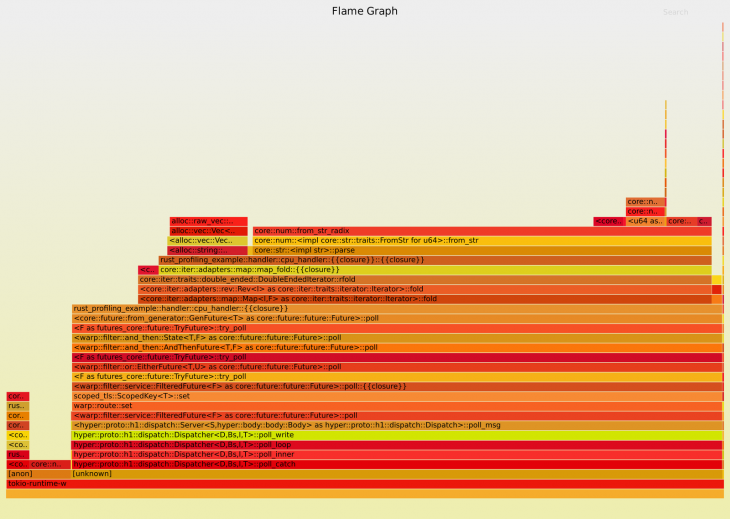
Let’s run the sampling again. We’ll get a flame graph like this:

That’s quite a difference! As you can see, we spend a lot less time allocating memory and spend most of our time parsing the strings to numbers and calculating our result.
You can also use a tool such as Hotspot to create and analyze flame graphs. The nice thing about using these more high-level tools is that you not only get a static .svg file, which hides some of the details, but you can zoom around in your profile!
That’s it! The full example code can be found on GitHub.
In this post, we took a bit of a dive into performance measurement and improvement for Rust web applications.
The possibilities in this area are almost as endless are the different ways to write code. In this tutorial, I attempted to provide you with some techniques, which have helped me find slow code and performance regressions in the past.
If you’re interested in this type of thing and want to dive deeper, there is a huge rabbit hole waiting for you and you can use the resources mentioned in The Rust Performance Book as a starting point on your journey towards lightning fast Rust code.
Debugging Rust applications can be difficult, especially when users experience issues that are hard to reproduce. If you’re interested in monitoring and tracking the performance of your Rust apps, automatically surfacing errors, and tracking slow network requests and load time, try LogRocket.
LogRocket lets you replay user sessions, eliminating guesswork around why bugs happen by showing exactly what users experienced. It captures console logs, errors, network requests, and pixel-perfect DOM recordings — compatible with all frameworks.
LogRocket's Galileo AI watches sessions for you, instantly identifying and explaining user struggles with automated monitoring of your entire product experience.

Modernize how you debug your Rust apps — start monitoring for free.

AI companies are buying developer tools as coding agents turn runtimes, package managers, and linters into strategic infrastructure.

Learn how AI-assisted development governance uses rules, agents, hooks, and protocols to help AI coding tools produce safer, more consistent code.

A step-by-step guide to building your first MCP server using Node.js, covering core concepts, tool design, and upgrading from file storage to MySQL.

Using security headers in your Next.js apps is a highly effective way to secure websites from common security threats.
Hey there, want to help make our blog better?
Join LogRocket’s Content Advisory Board. You’ll help inform the type of content we create and get access to exclusive meetups, social accreditation, and swag.
Sign up now