React performance advice often gets reduced to a few familiar prescriptions: wrap expensive children in React.memo, add useCallback to handlers, add useMemo to computed values, and move on. In practice, though, those tools only work when the values you pass through them are actually stable. If a parent recreates an object or function on every render, React sees a different reference every time, and the memoization boundary stops doing useful work. React’s own docs are explicit about this: memo skips re-renders only when props are unchanged, and React compares props with Object.is, not by deeply comparing their contents.

That is why one of the most common React patterns also ends up being one of the most expensive in the wrong context: passing inline objects, arrays, and callbacks directly at the call site.
<UserCard
  style={{ padding: 16, borderRadius: 8 }}
  onSelect={() => handleSelect(user.id)}
  config={{ showAvatar: true, compact: false }}
  user={user}
/>
There is nothing inherently “wrong” with code like this. In plenty of components, it is completely fine. But once that child is memoized, or sits inside a large list, or lives under a parent that re-renders frequently because of search input, scroll state, filters, animation state, or live data, those inline props can quietly erase the optimization you thought you already had. That is the core issue this article explores.
We will look at how React’s bailout mechanism actually works, why referential instability breaks it, how to prove the problem with React DevTools Profiler and Why Did You Render, and which refactors actually restore the performance contract. To show how expensive this can become, I built a controlled React test: a searchable product list with 200 memoized rows, where each row receives the same logical values but new object and function references on every parent render. The result is a useful reminder that React.memo only works when prop identities stay stable.
React.memo wraps a component in a memoization boundary. When the parent renders, React does not automatically skip the child just because the child is memoized. Instead, React compares the new props to the previous props. If every prop is considered equal, React can bail out and reuse the previous result. If even one prop fails that comparison, the child renders again. By default, React performs that comparison per prop with Object.is.
That detail matters because Object.is is effectively a reference equality check for objects and functions:
Object.is({ padding: 16 }, { padding: 16 }) // false
Object.is(() => {}, () => {}) // false
Even though the contents look identical, the references are different. React therefore treats them as changed. This is why inline objects and callbacks are so often the hidden reason a memoized child still re-renders.
The same logic explains why useCallback and useMemo exist. According to the React docs, useCallback caches a function definition between renders, while useMemo caches the result of a calculation between renders. Both only help when their dependencies remain stable enough for React to reuse the previous value. If you place an unstable object into a dependency array, React sees a new dependency on every render and recomputes anyway.
This is also why the bug can feel confusing in a real app. The values often look unchanged to a human reader. The style object has the same keys. The callback body is identical. The config object still says the same thing. But React is not comparing intent or structure here. It is comparing identity. Once you internalize that distinction, a lot of “mysterious” re-renders stop being mysterious.
It is worth drawing a line between theoretical and practical cost. An inline callback is not automatically a performance bug. If the child is cheap, the render frequency is low, and no memoization boundary is involved, there may be no measurable downside at all. React’s own performance guidance consistently points developers toward measurement rather than blanket memoization, and LogRocket’s React performance coverage makes the same point: optimization pays off when it targets real bottlenecks, not hypothetical ones.
The trouble starts when three conditions overlap. First, the parent re-renders frequently. Second, the child or subtree is large enough that extra work matters. Third, you have already introduced memoization and expect React to skip work when nothing meaningful has changed. In that setup, unstable inline references do not just add a little overhead. They nullify the optimization you deliberately added.
That is what makes this pattern so costly in production code. It does not usually announce itself as a bug. The UI still works. There is no exception, no warning, and often no obvious smell unless you profile. The cost shows up instead as sluggish list filtering, input lag, noisy flame graphs, and component trees that keep re-rendering even when their meaningful data is unchanged.
Rather than argue about whether inline props are “bad,” I wanted to measure when they become expensive. So I built a controlled React test: a searchable product list with 200 memoized rows, where each row receives the same logical values but new object and function references on every parent render. That setup makes it easy to see whether React.memo still bails out or whether the entire subtree re-renders on every keystroke.
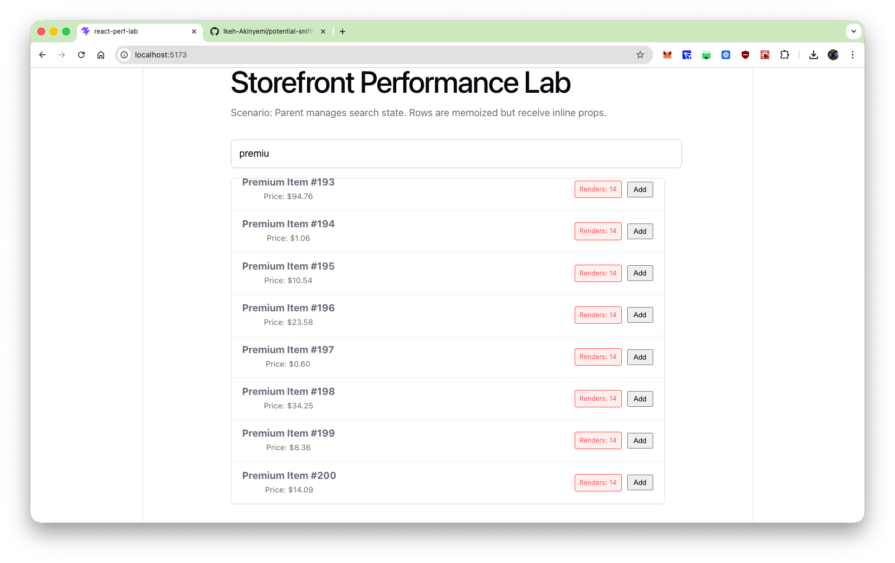
To make the issue visible, imagine a storefront UI with 200 memoized ProductRow components. The parent component, ProductList, stores a searchTerm in state. Every keystroke updates that state, re-renders ProductList, and re-executes the JSX that maps over the filtered products. In the draft experiment you shared, each ProductRow is wrapped in memo and marked with whyDidYouRender = true, but still receives two inline props at the call site.
{filteredProducts.map(p => (
  <ProductRow
    key={p.id}
    product={p}
    style={{
      display: 'flex',
      justifyContent: 'space-between',
      alignItems: 'center',
      padding: '12px 20px',
      borderBottom: '1px solid #eee'
    }}
    onAddToCart={(id) => console.log('Added:', id)}
  />
))}
That is exactly the kind of pattern React warns about when passing functions to memoized components: a fresh function or object created during render will cause the prop comparison to fail unless you stabilize the reference.
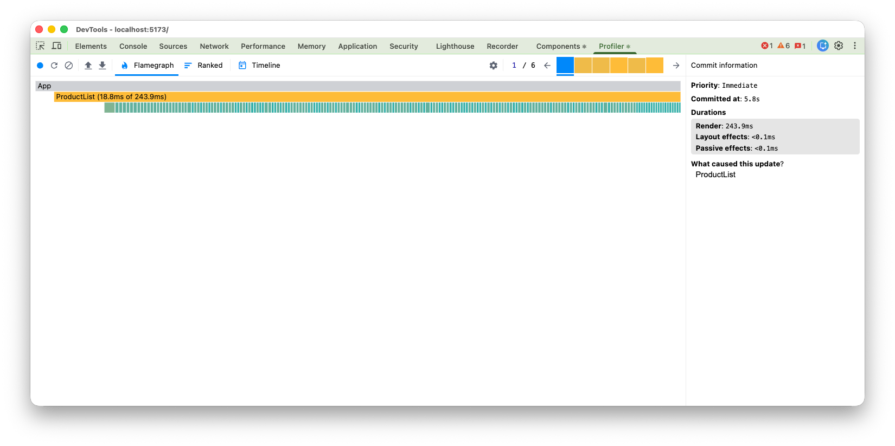
In your experiment, the effect becomes visible almost immediately. The style object and onAddToCart callback are recreated every time ProductList renders, so the memo wrapper sees changed props for every row on every keystroke. The render counter makes that concrete: after typing six characters, every visible row reads Renders: 14. The Profiler then shows the runtime cost of that mistake, with a single keystroke producing a commit where ProductList takes 243.9ms and all 200 row fibers light up in the flame graph.
This is exactly where React Developer Tools earns its keep. The official docs describe React Developer Tools as a way to inspect components, edit props and state, and identify performance problems. The Profiler reference also notes that React provides similar functionality programmatically through <Profiler>, while the DevTools Profiler gives you the interactive view most teams actually use during debugging.
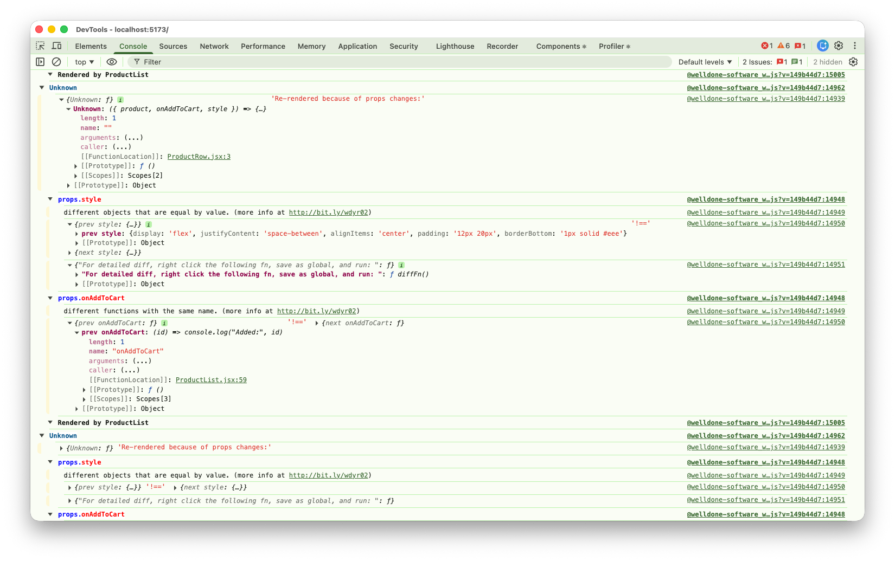
Why Did You Render makes the root cause even easier to see. The package’s documentation describes it as a tool that monkey patches React to notify you about potentially avoidable re-renders. In your example, it reports props.style as “different objects that are equal by value” and props.onAddToCart as “different functions with the same name,” which is exactly the referential mismatch you would expect. It is a development-only diagnostic, not something to keep in production, but it is extremely effective for surfacing this class of bug.
To stop the render cascade, you need stable references. Conceptually, the fix is simple: values that never change should not be recreated during render, and callbacks that need to persist across renders should be memoized when a child depends on referential stability.
// FIX 1: Move static objects to module scope
const ROW_STYLE = {
display: 'flex',
justifyContent: 'space-between',
padding: '12px 20px',
borderBottom: '1px solid #eee'
};
export default function ProductList() {
const [searchTerm, setSearchTerm] = useState('');
// FIX 2: Memoize dynamic callbacks
const handleAddToCart = useCallback((id) => {
console.log('Added:', id);
}, []);
return (
<div className="container">
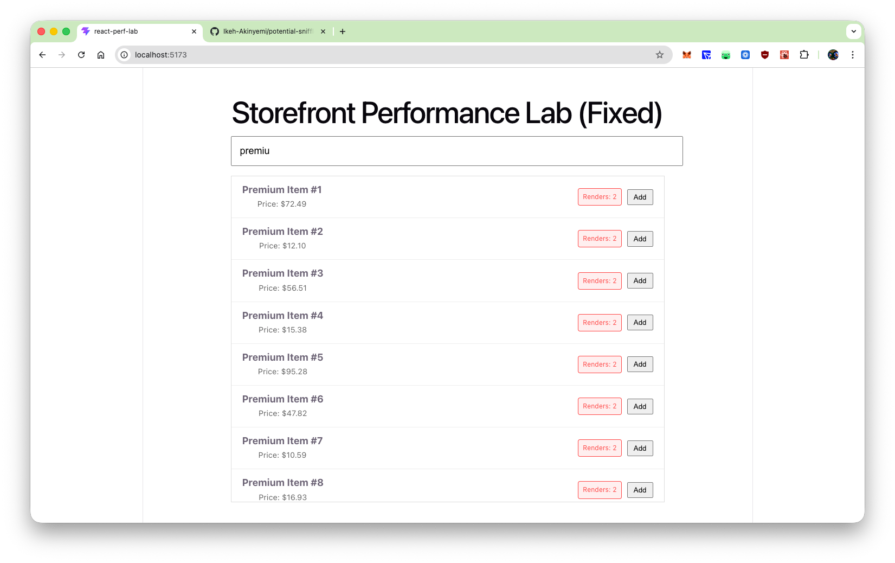
<h1>Storefront Performance Lab (Fixed)</h1>
<input
value={searchTerm}
onChange={(e) => setSearchTerm(e.target.value)}
/>
{filteredProducts.map(p => (
<ProductRow
key={p.id}
product={p}
style={ROW_STYLE}
onAddToCart={handleAddToCart}
/>
))}
</div>
);
}
Moving ROW_STYLE to module scope solves the problem at the cheapest possible level: React never sees a new object reference because the object is created once, outside the component. Using useCallback for handleAddToCart gives the child a stable function reference across renders, as long as the dependency list does not change. That is precisely the use case React documents for functions passed into memoized children.
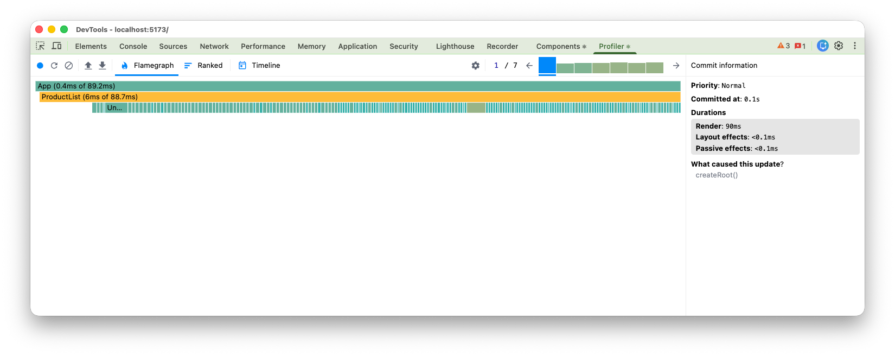
In your experiment, stabilizing those references restores the bailout path. The measured result is dramatic: ProductList drops from 243.9ms to 6ms, the render badges stay at 2 no matter how much you type, and Why Did You Render goes silent because the avoidable referential mismatches are gone.
This is the part that often gets lost in performance discussions. The lesson is not “never use inline objects” or “wrap everything in useCallback.” The lesson is that memoization is a contract. If a child relies on referential equality to skip work, then the parent has to respect that contract by passing stable references.
That does not mean every component needs aggressive memoization. In fact, React’s modern guidance still treats memoization as a targeted optimization, not a default style rule. If a render is cheap, the subtree is small, or the child is not memoized, then stabilizing references may add complexity without any real benefit. This is also why so many articles on React performance, including LogRocket’s broader guides, emphasize profiling first instead of optimizing mechanically.
A useful rule of thumb is to move first, then memoize. If a value is static, lift it out of the component body before reaching for hooks. That gives you referential stability with almost no cognitive or runtime overhead. Use useCallback and useMemo only when the value is truly dynamic and the receiving component can benefit from a stable identity. React’s docs make the same distinction: declare values outside the component when possible, and cache them with hooks when you need stable values across renders.
One current wrinkle is React Compiler. React’s docs describe it as a stable build-time tool that automatically optimizes React apps and, by default, memoizes code based on its analysis and heuristics. That reduces the need for some manual useMemo, useCallback, and React.memo work, especially in new code. But it does not make referential stability irrelevant. The docs also note that useMemo and useCallback still remain useful as escape hatches when developers need precise control, such as keeping a memoized value stable for an Effect dependency. So even in codebases adopting React Compiler, it still helps to understand how unstable references affect re-renders, profiling results, and the cases where manual control is still warranted.
Inline objects and inline callbacks are not automatically bad React code. Most of the time, they are just ordinary JavaScript expressions inside JSX. The problem appears when they cross a memoization boundary and you expect React to treat “same value” as “same prop.” By default, React compares props and Hook dependencies with Object.is, so for objects and functions, a new reference is enough to make React treat the value as changed.
That is why this issue deserves more attention than it usually gets. It is not just a micro-optimization trivia point. It is one of the easiest ways to accidentally invalidate React.memo, especially in filtered lists, dashboards, search-heavy UIs, and component trees with expensive descendants. The code still looks clean. The app still works. But the optimization you thought you bought disappears.
For teams trying to build faster React interfaces, the practical takeaway is simple. Profile first. If a memoized subtree is still rendering too often, inspect the props before you blame React. Move static objects out of the render path. Memoize callbacks only when a child actually benefits. Use React Developer Tools and Why Did You Render to confirm what changed and why. Do that consistently, and React.memo stops being decorative performance code and starts doing the job it was meant to do.
Install LogRocket via npm or script tag. LogRocket.init() must be called client-side, not
server-side
$ npm i --save logrocket

// Code:

import LogRocket from 'logrocket';
LogRocket.init('app/id');
// Add to your HTML:

<script src="https://cdn.lr-ingest.com/LogRocket.min.js"></script>
<script>window.LogRocket && window.LogRocket.init('app/id');</script>

Learn how to use Fallow to analyze AI-generated code, detect dead code, duplicate logic, and complexity issues, and integrate automated code quality checks into your AI-assisted development workflow.

Learn how to protect full-stack projects from NPM supply chain attacks with a practical security checklist.

Explore 15 essential MCP servers for web developers to enhance AI workflows with tools, data, and automation.

Learn how contrast-color() automatically picks accessible text colors using native CSS, without JavaScript.
Would you be interested in joining LogRocket's developer community?
Join LogRocket’s Content Advisory Board. You’ll help inform the type of content we create and get access to exclusive meetups, social accreditation, and swag.
Sign up now