Visualizing data with graphs and charts makes it much easier to comprehend. We can use data visualization libraries to easily generate clean and beautiful charts.

In this tutorial, we’ll learn how to plot data in Golang using the go-echarts library. On GitHub, it has over 4k stars, making it one of the most popular libraries for generating charts in Go. We’ll learn how to set up and install this package, then cover step-by-step how to create different charts, including a bar chart, line chart, pie chart, and a word cloud.
go-echarts includes a wide variety of customization options, like multiple UI themes that you can use to further improve the look and feel of your data visualization. go-echarts has proper documentation and provides a clean and comprehensive API.
Natively, Go doesn’t provide the ability to create customizable visualizations, but go-echarts provides support for multiple data input formats and mobile optimizations.
To set up our project and install go-echarts, run the code below:
mkdir learn_charts
cd learn_charts

go mod init learn_charts
go get -u github.com/go-echarts/go-echarts/...

touch main.go
Now, open the main.go file in your favorite editor, and let’s get started!
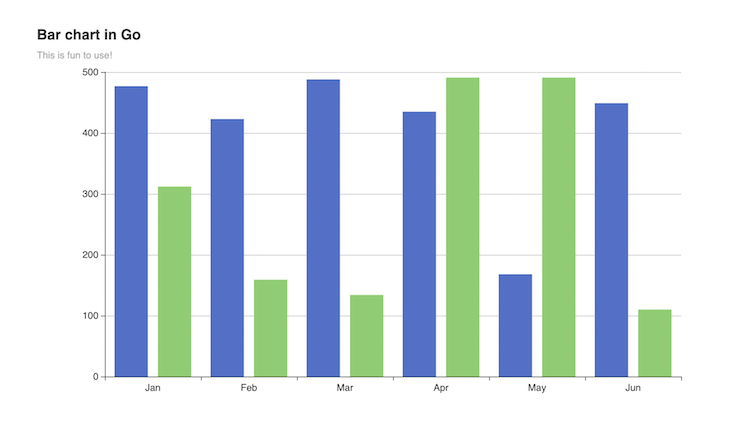
First, let’s cover how to create a bar chart, one of the most common and widely used chart types. Bar charts are ideal when you want to show a distribution or comparison across groups. We’ll use random data for our bar chart and explore different options to customize it.
First, let’s write a function to create random sample data for our bar chart:
package main
import (
    "math/rand"
    "os"

    "github.com/go-echarts/go-echarts/v2/opts"
)
// generate random data for bar chart
func generateBarItems() []opts.BarData {
    items := make([]opts.BarData, 0)
    for i := 0; i < 6; i++ {
        items = append(items, opts.BarData{Value: rand.Intn(500)})
    }
    return items
}
Now, we’re ready to create our bar chart. To do so, we’ll initialize a new bar chart and set global options like title and legend. Then, we’ll populate data into our instance using the AddSeries() method with our generateBarItems() function. Finally, we’ll render our chart into an HTML file. Alternately, you can render your chart using an HTTP server:
func createBarChart() {
    // create a new bar instance
    bar := charts.NewBar()

    // Set global options
    bar.SetGlobalOptions(charts.WithTitleOpts(opts.Title{
        Title:    "Bar chart in Go",
        Subtitle: "This is fun to use!",
    }))

    // Put data into instance
    bar.SetXAxis([]string{"Jan", "Feb", "Mar", "Apr", "May", "Jun"}).
        AddSeries("Category A", generateBarItems()).
        AddSeries("Category B", generateBarItems())
    f, _ := os.Create("bar.html")
    _ = bar.Render(f)
}
With the commands above, a file called bar.html should be created. Open it in your browser, and you should see your first bar chart with Go. You can feel free to add custom styling as you like:
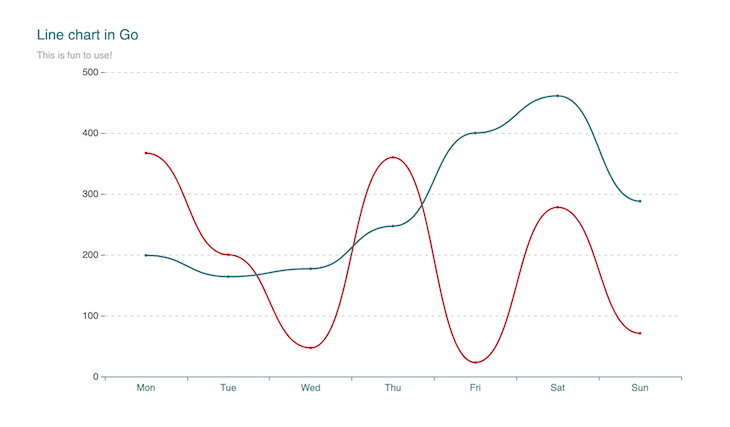
Data scientists often use line graphs to track changes over periods of time. In our example, we’ll create a line chart with random data and compare two random categories.
First, let’s generate our random data for the chart:
package main

import (
    "math/rand"
    "os"

    "github.com/go-echarts/go-echarts/v2/opts"
)

// generate random data for line chart
func generateLineItems() []opts.LineData {
    items := make([]opts.LineData, 0)
    for i := 0; i < 7; i++ {
        items = append(items, opts.LineData{Value: rand.Intn(500)})
    }
    return items
}
Now, we’re ready to create a line chart. To do so, we’ll initialize a new instance for our line chart as we did for the bar chart. Then, we’ll populate data into our instance and render our chart into an HTML file:
func createLineChart() {
    // create a new line instance
    line := charts.NewLine()

    // set some global options like Title/Legend/ToolTip or anything else
    line.SetGlobalOptions(
        charts.WithInitializationOpts(opts.Initialization{
          Theme: types.ThemeInfographic
        }),
        charts.WithTitleOpts(opts.Title{
            Title:    "Line chart in Go",
            Subtitle: "This is fun to use!",
        })
    )

    // Put data into instance
    line.SetXAxis([]string{"Mon", "Tue", "Wed", "Thu", "Fri", "Sat", "Sun"}).
        AddSeries("Category A", generateLineItems()).
        AddSeries("Category B", generateLineItems()).
        SetSeriesOptions(charts.WithLineChartOpts(opts.LineChart{Smooth: true}))
    f, _ := os.Create("line.html")
    _ = line.Render(f)
}
Open line.html in your browser, and you’ll see a chart like the one below:
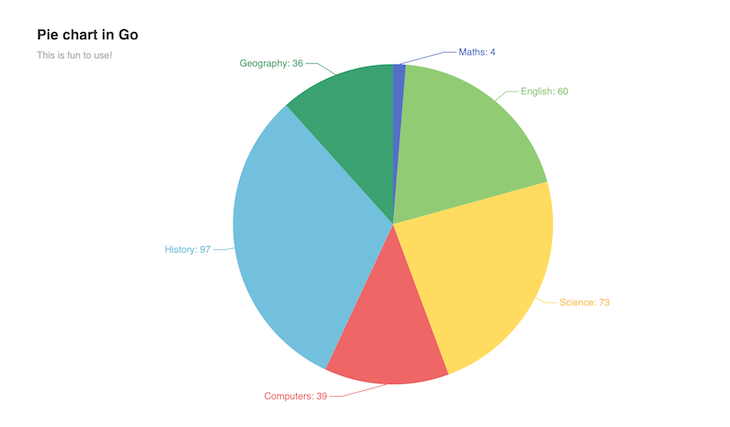
Pie charts are arguably the best choice when you are comparing parts of a whole. In our example, we’ll create a pie chart with random data to show sales marks distribution for a student.
Let’s write a small function to create sample random data for our pie chart:
package main

import (
    "math/rand"
    "os"

    "github.com/go-echarts/go-echarts/v2/opts"
)

// generate random data for pie chart
func generatePieItems() []opts.PieData {
    subjects := []string{"Maths", "English", "Science", "Computers", "History", "Geography"}
    items := make([]opts.PieData, 0)
    for i := 0; i < 6; i++ {
        items = append(items, opts.PieData{
            Name:  subjects[i],
            Value: rand.Intn(500)})
    }
    return items
}
Now, we need to create an instance and add customization. We’ll add additional label options and set a radius for our pie chart. Feel free to change and play with the options:
func createPieChart() {
    // create a new pie instance
    pie := charts.NewPie()
    pie.SetGlobalOptions(
        charts.WithTitleOpts(
            opts.Title{
                Title:    "Pie chart in Go",
                Subtitle: "This is fun to use!",
            },
        ),
    )
    pie.SetSeriesOptions()
    pie.AddSeries("Monthly revenue",
        generatePieItems()).
        SetSeriesOptions(
            charts.WithPieChartOpts(
                opts.PieChart{
                    Radius: 200,
                },
            ),
            charts.WithLabelOpts(
                opts.Label{
                    Show:      true,
                    Formatter: "{b}: {c}",
                },
            ),
        )
    f, _ := os.Create("pie.html")
    _ = pie.Render(f)
}
Open pie.html in your browser to see a pie chart like the one below:
Word clouds display the words most frequently used in a dataset by highlighting them with a larger font. In our example, we’ll create a word cloud with random data about cryptocurrency popularity.
Let’s write a function to create sample random data for our word cloud:
package main

import (
    "math/rand"
    "os"

    "github.com/go-echarts/go-echarts/v2/opts"
)

var wordCloudData = map[string]interface{}{
    "Bitcoin":      10000,
    "Ethereum":     8000,
    "Cardano":      5000,
    "Polygon":      4000,
    "Polkadot":     3000,
    "Chainlink":    2500,
    "Solana":       2000,
    "Ripple":       1500,
    "Decentraland": 1000,
    "Tron":         800,
    "Sandbox":      500,
    "Litecoin":     200,
}

// generate random data for word cloud
func generateWordCloudData(data map[string]interface{}) (items []opts.WordCloudData) {
    items = make([]opts.WordCloudData, 0)
    for k, v := range data {
        items = append(items, opts.WordCloudData{Name: k, Value: v})
    }
    return
}
Now, we need to create an instance and add customization options. First, we define the title and subtitle using charts.WithTitleOpts(), then we add data to our word cloud chart instance. Feel free to change and play with the options:
func createWordCloud() {
    wc := charts.NewWordCloud()
    wc.SetGlobalOptions(
        charts.WithTitleOpts(opts.Title{
            Title:    "Popular Cryptocurrencies",
            Subtitle: "Spot your favourite coins",
        }))
    wc.AddSeries("wordcloud", generateWordCloudData(wordCloudData)).
        SetSeriesOptions(
            charts.WithWorldCloudChartOpts(
                opts.WordCloudChart{
                    SizeRange: []float32{40, 80},
                    Shape:     "cardioid",
                }),
        )
    f, _ := os.Create("word_cloud.html")
    _ = wc.Render(f)
}
Open word_cloud.html in your browser to see a word cloud like the one below:
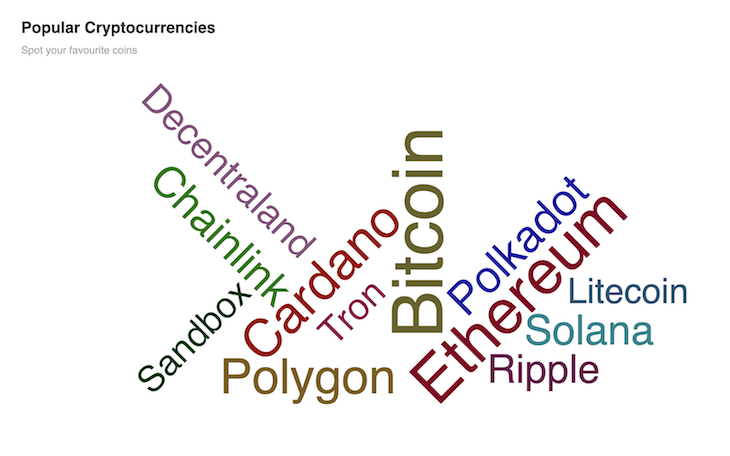
In the word cloud above, the most frequently named cryptocurrencies appear in the largest font size. In our case, we can infer that these include Bitcoin and Ethereum.
In this article, we practiced a better way to visualize data in Go using the go-echarts library. go-echarts offers more types of charts, like heatmaps, scatter plots, and box plots, which are easy to build and populate following the method we used above.
Alternately, you might consider the following libraries for building charts in Go:
I hope you learned something new in this tutorial. Now, you can use charts in your own Go web applications. Happy coding!
Install LogRocket via npm or script tag. LogRocket.init() must be called client-side, not
server-side
$ npm i --save logrocket

// Code:

import LogRocket from 'logrocket';
LogRocket.init('app/id');
// Add to your HTML:

<script src="https://cdn.lr-ingest.com/LogRocket.min.js"></script>
<script>window.LogRocket && window.LogRocket.init('app/id');</script>

Compare the top AI development tools and models of July 2026. View updated rankings, feature breakdowns, and find the best fit for you.

Learn how to detect unused and ghost dependencies in JavaScript projects using Knip, a project-level linter that keeps your dependency graph accurate.

Learn how Storybook MCP enables AI agents to understand your component library, generate accurate UI, and validate code using documentation, stories, and automated tests.

Debug RSC hydration mismatches in production with Next.js instrumentation, Suspense isolation, HTML diffing, and CI smoke tests.
Hey there, want to help make our blog better?
Join LogRocket’s Content Advisory Board. You’ll help inform the type of content we create and get access to exclusive meetups, social accreditation, and swag.
Sign up now
