
JSON is one of the most popular data structures in and out of web development and data handling because it’s straightforward, readable, flexible, and lightweight.

In contrast to other key-data structures and formats like YAML, JSON is easier to read and write and computer processors to parse and generate. Plus, JSON is based on key-value pairs, which are great for relations and representing complex data structures.
Everybody uses JSON on multiple career development paths. I have dabbled in data science, backend engineering smart contracts and DevOps, and I’ve had to use JSON data while working on each of these.
As you use JSON and your data set grows more nested and complex, you may want to visualize it for more scannability, debugging validation, and, sometimes, analysis. I will show you some great tools I use to visualize JSON data, and then I’ll talk about how to use them.
The Replay is a weekly newsletter for dev and engineering leaders.
Delivered once a week, it's your curated guide to the most important conversations around frontend dev, emerging AI tools, and the state of modern software.
You need to visualize JSON data in many situations and for many purposes. Let’s go over some of them.
Exploring and understanding complex JSON data structures
Your JSON data can become complex with size, especially when you have nested objects and arrays. You can visualize the JSON in a tree-like structure to explore hierarchy, expand/collapse nodes, and understand the data organization.
Validating JSON data
You can validate your JSON data and spot invalid data, syntax, incorrect nesting, etc.
For this purpose, you can use linting tools like JSONLint or one on your IDE marketplace.
Debugging API responses
If you’re building or consuming APIs that return JSON data as a response, visualizing the data is quite helpful for understanding the structure and content, especially when the content is large or nested.
Presenting JSON data to stakeholders
Visualizing complex JSON data is excellent for sharing with people who may not be familiar with the technical aspects.
Mocking JSON data during development
When building applications that consume or use JSON, you’ll likely mock the data before the API is ready. Visualizing the mock data would help you ensure it matches your expected structure.
You can use many tools to visualize JSON data in different environments, from IDEs to browsers and other apps.
JsonTree.js is a lightweight JavaScript library that helps with generating customizable tree views for visualizing JSON data. You’ll find JsonTree.js helpful if you want to manage and display hierarchical data structure clearly and interactively.
Features of JsonTree.js
Here’s an non-exhaustive list of the features JSONTree provides:
Once you have NodeJS installed, you can run this command to install the jjsontree.js library and get started visualizing JSON data with it:
npm install jjsontree.js
Now, you can add this CDN link to the HTML of your webpage to make the JSON visible:
<!DOCTYPE html>

<link rel="stylesheet" href="<https://cdn.jsdelivr.net/gh/williamtroup/[email protected]/dist/jsontree.js.min.css>">
<script src="<https://cdn.jsdelivr.net/gh/williamtroup/[email protected]/dist/jsontree.min.js>"></script>
Also, add the necessary CSS and JS files to your HTML:
<link rel="stylesheet" href="dist/jsontree.js.css">
<script src="dist/jsontree.js"></script>
Here’s how you can visualize three JSON trees in your webpage with JSONTree.js:
<!DOCTYPE html>
<html lang="en">
<head>
    <meta charset="UTF-8">
    <meta name="viewport" content="width=device-width, initial-scale=1.0">
    <title>JSON Tree Example</title>
    <link rel="stylesheet" href="jjsontree.js/dist/jsontree.js.css">
</head>
<body>
    <div id="tree-1" data-jsontree-js="{ 'showCounts': true, 'data': [ true, false, 5, 10, 'A String' ] }">
        Your HTML.
    </div>

    <div id="tree-2" data-jsontree-js="{ 'showCounts': false, 'data': { 'name': 'John', 'age': 30, 'city': 'New York' } }">
        Another JSON tree.
    </div>

    <div id="tree-3" data-jsontree-js="{ 'showCounts': true, 'data': [ { 'id': 1, 'name': 'Item 1' }, { 'id': 2, 'name': 'Item 2' }, { 'id': 3, 'name': 'Item 3' } ] }">
        Yet another JSON tree.
    </div>

    <script src="jjsontree.js/dist/jsontree.js"></script>
    <script>
        $jsontree.setConfiguration({
            safeMode: false
        });
    </script>
</body>
</html>
The HTML document sets up the webpage to display three different JSON Tree visualizations with the jsontree.js library.
Here’s the output from checking out the webpage and interacting with the tree: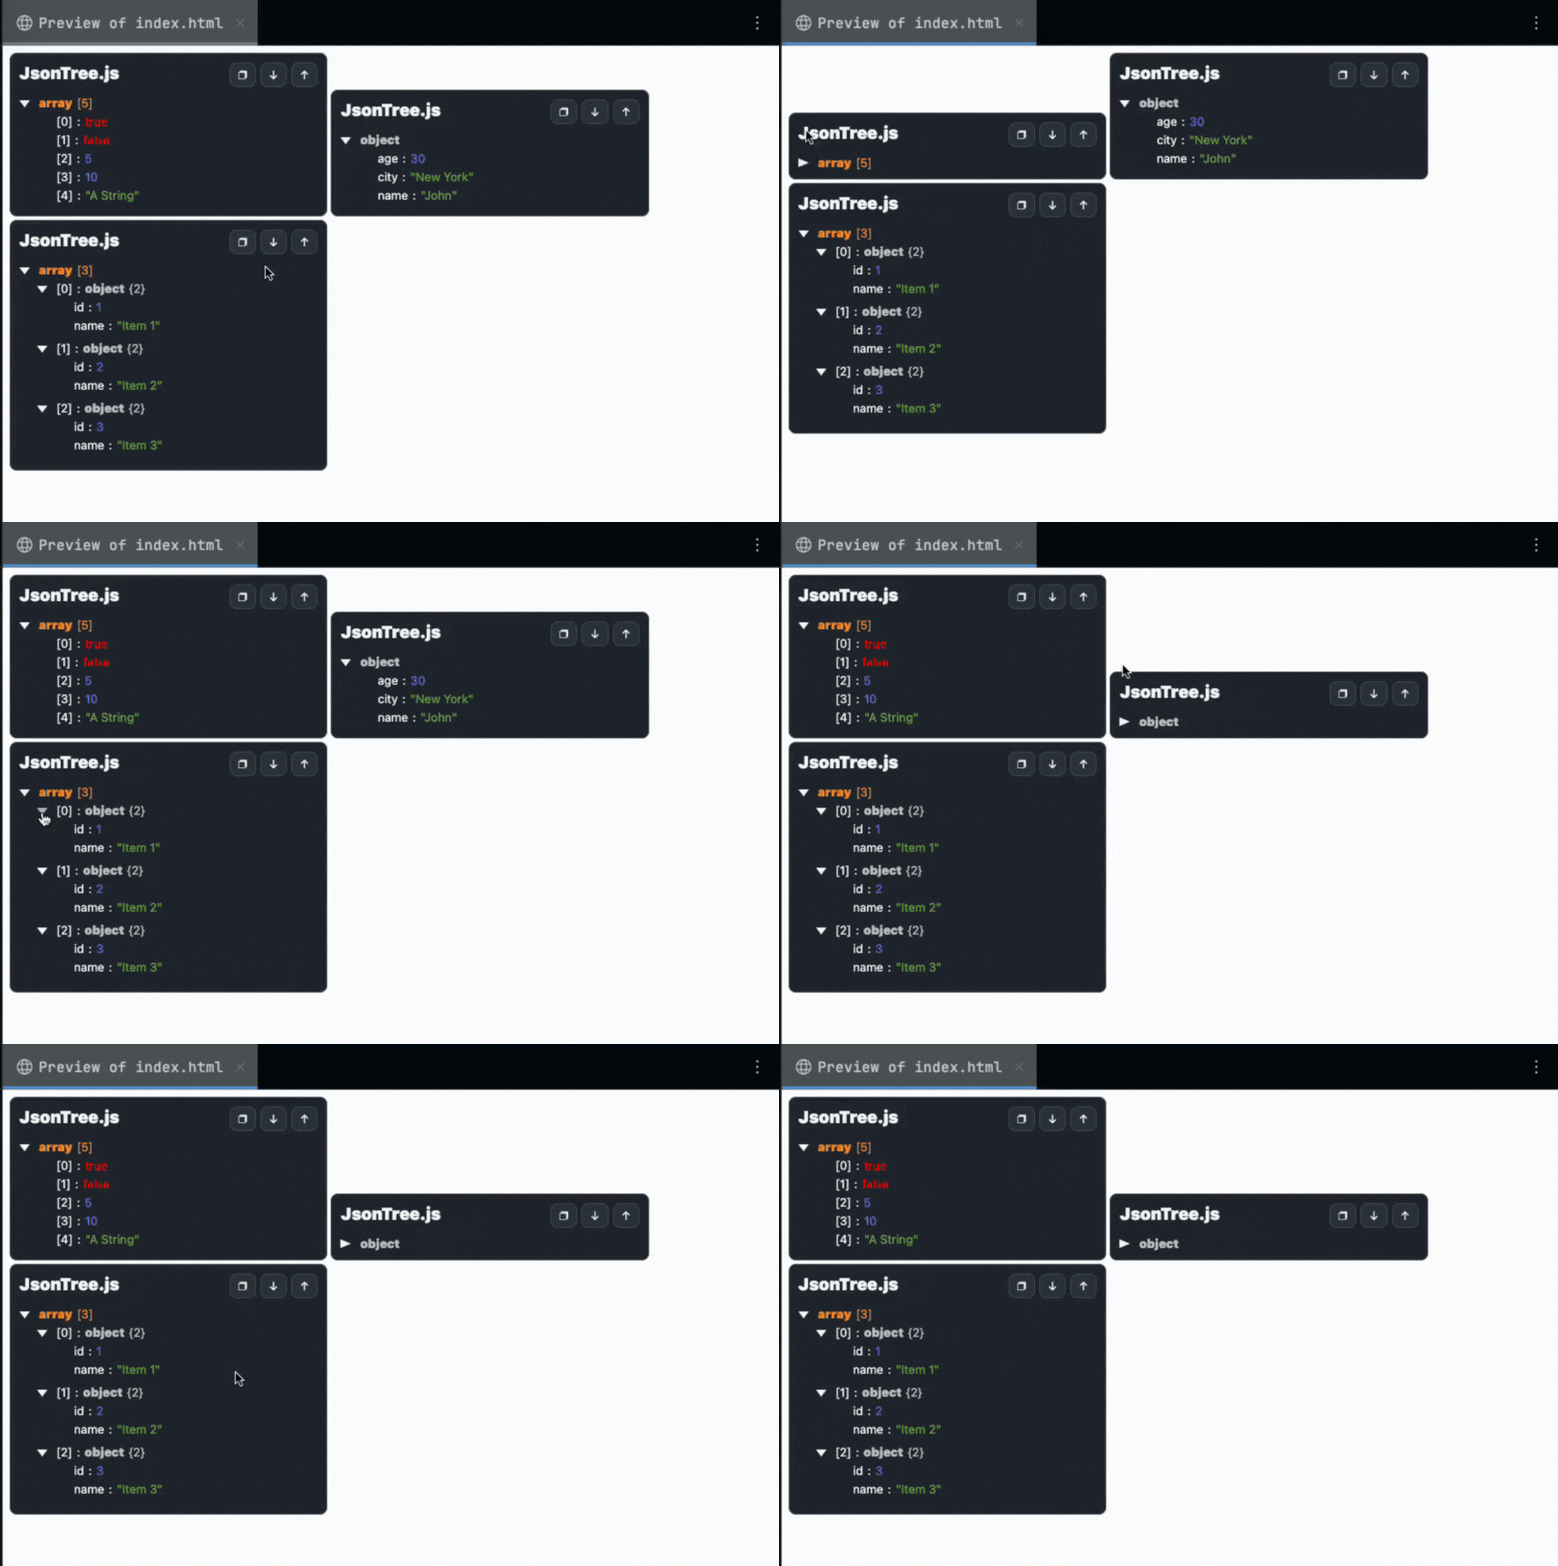
You can check out the JSONTree.js documentation to learn how to customize this further to style, add more functionalities, and use more of the tool’s features.
JsonTree.js is quite versatile in this regard, and since it’s lightweight, it’s suitable for use in production and development.
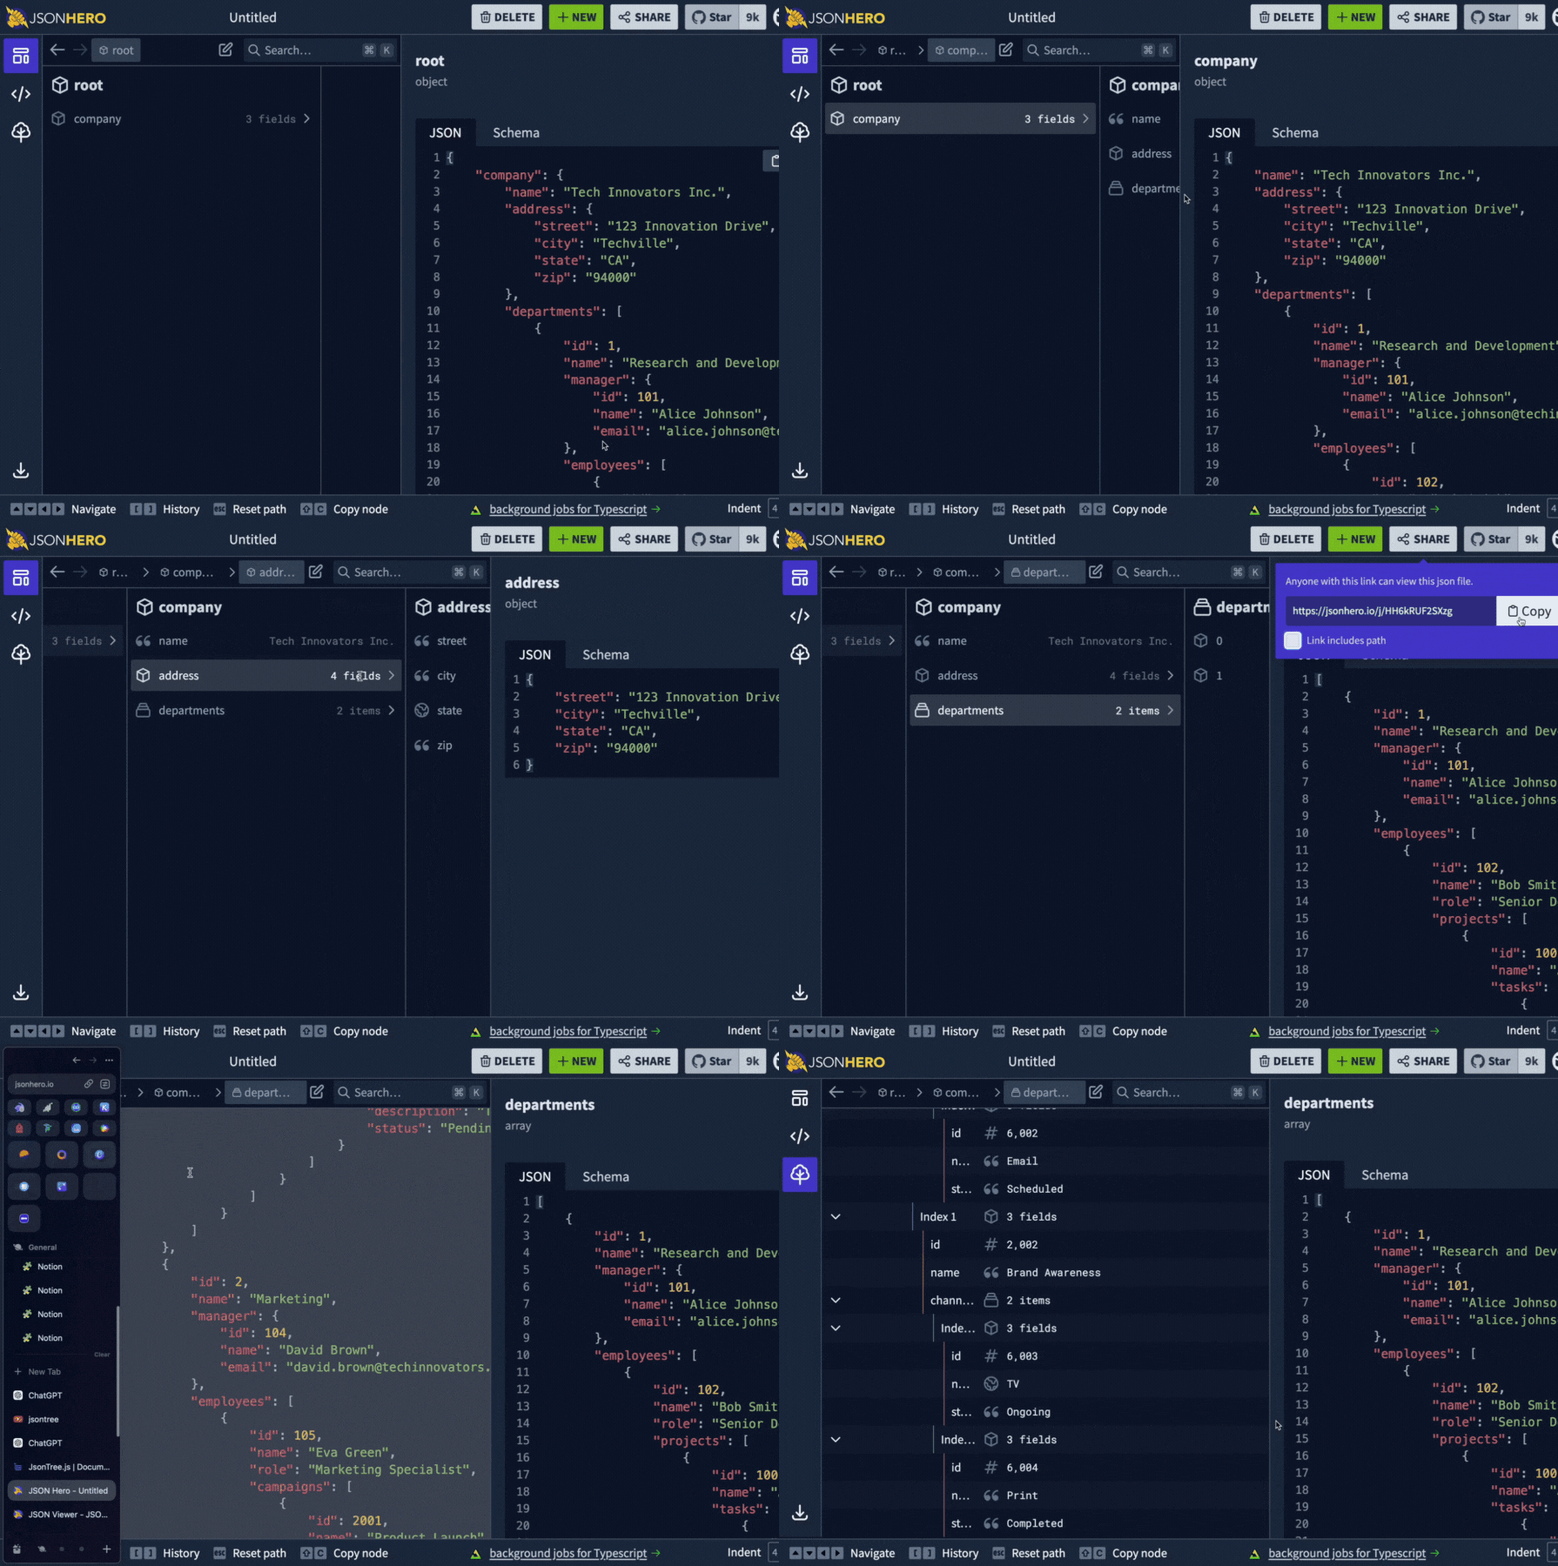
JSON Hero is an advanced, feature-rich JSON visualization tool with an intuitive UI that anyone can pick up and use.
JSON Hero makes it easy to work with JSON files from various sources with a clean JSON viewer interface that supports all field types, from images to dates, colors, URLs, or videos.
You can upload or link to your JSON files, search through them with lightning speed, and collaborate with team members from JSON Hero:
API testing tools like Postman and Insomnia ship with tools you can use to visualize JSON for requests and responses.
You’ll find these useful if you’re debugging JSON or using JSON data for API development, collaborating with a team, or you need to document the JSON data since they also ship with these features.
You’ll find an extension/plugin for working with and visualizing JSON in your tooling of choice’s extensions marketplace.
All you have to do is search and select one that matches the use case and features you need. Most extensions here help with linting JSON so you can view them better in your development environment. In some cases, they provide features for converting JSON to native language types like JSON to Python, Go, or Swift:
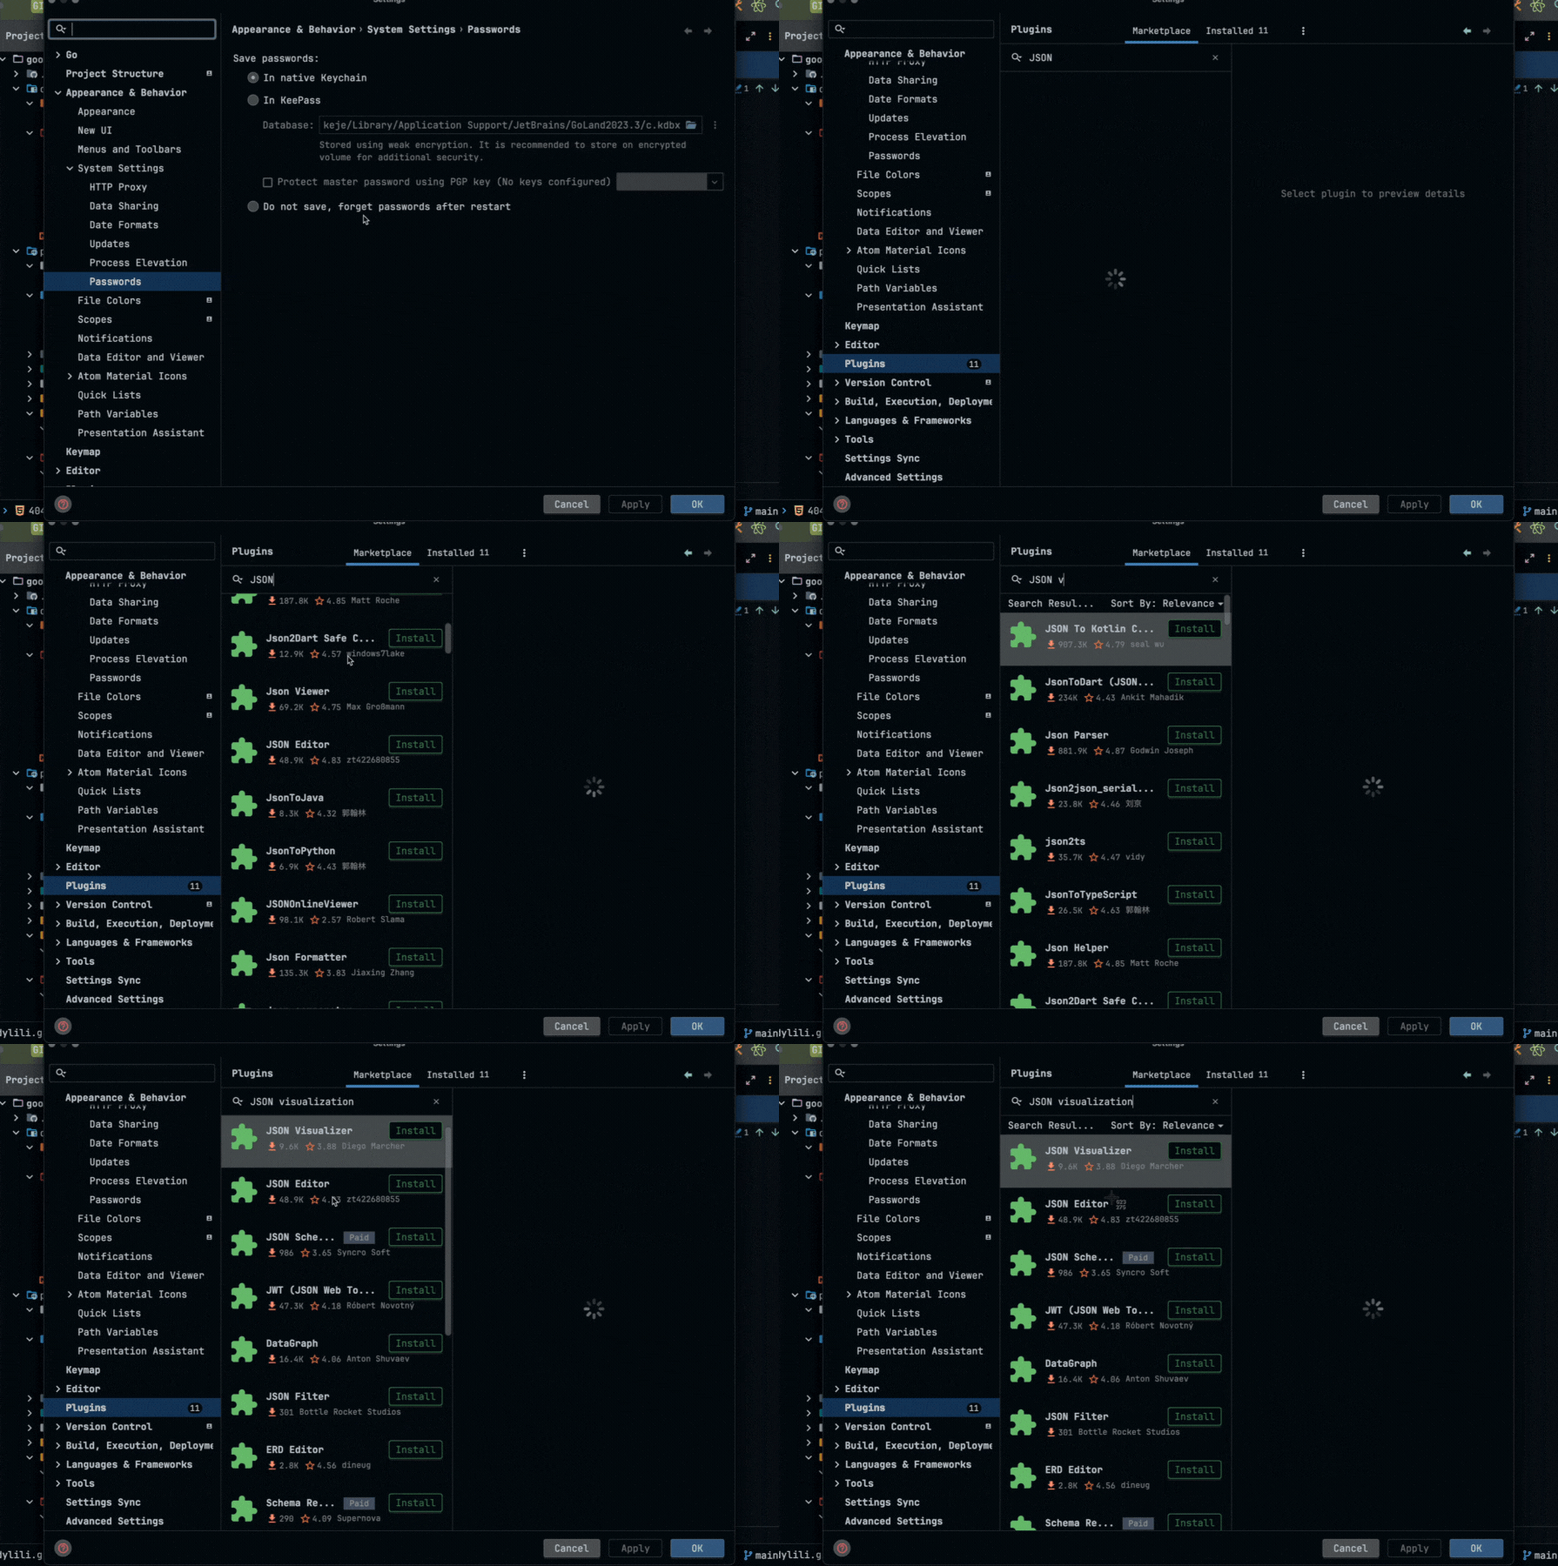
In some cases, your editor could be enough to visualize JSON data. JetBrains IDEs ship with great support for JSON and other file types.
Visualizing JSON data with any of these tools boils down to what you’re trying to do and the environment in which you’re using JSON data.
Here’s a table with an overview of the pros and cons of using these tools and when to use any of them for the best experience possible:
| Tool | Pros | Cons | When to use |
|---|---|---|---|
| JsonTree.js | Zero dependencies, lightweight, customizable, supports frameworks like React and Angular, interactive features, Array paging support | Limited to browser environments, basic feature set compared to more advanced tools | You need a lightweight, customizable tree view to visualize hierarchical JSON data |
| JSON Hero | Intuitive UI supports various field types (images, dates, colors, etc.) and collaboration features | It may require an internet connection and a more complex setup than simple libraries | When you need an advanced, feature-rich JSON viewer with a clean interface and collaboration tools |
| Postman/Insomnia | Comprehensive API testing features, collaboration and documentation tools, built-in JSON viewer | Primarily designed for API testing, not dedicated JSON visualization | When you’re debugging JSON, developing APIs, or needing to document and collaborate on JSON data |
| IDE/Text Editor Extensions | Integrated with the development environment, linting and conversion features; no additional tools are needed | Depending on the capabilities of the specific IDE or extension, may lack advanced visualization | When you need basic JSON visualization and linting within your development environment |
JSON is quite simple and structured enough at first glance, but as the data grows and your use case becomes more critical, you’ll likely face some challenges with visualizing data.
Visual noise
When the dataset is large with depth and complexity, objects may appear similar on screen, making it hard to find or distinguish data. You can tackle visual noise by ensuring the data is clean, removing outliers, or using a listing tool to reduce the visual noise.
Performance issues
Processing and parsing extensive JSON data can be time-consuming and resource-intensive. You can implement data chunking or pagination to process and visualize data in smaller segments or use efficient data structures and algorithms to minimize memory usage and processing time.
Transforming data
Sometimes, it can be complex to transform nested JSON data into other formats. You can use data transformation tools like ETL (Extract, Transform, Load) processes or custom scripts to restructure and clean your data.
Interactivity
You should add interactive elements for an immersive experience with your JSON data. Some JSON visualization tools support visualizing data in different formats. To add interactivity, you can check out D3.js for JavaScript or Dash for Python.
The tools in this article help solve most of the challenges you may encounter when visualizing and interacting with JSON data.
You’ve learned about JSON and some popular tools you can use to visualize JSON data to elevate your tinkering experience. Explore these options, and select a tool based on the situation you are in with JSON.
Debugging code is always a tedious task. But the more you understand your errors, the easier it is to fix them.
LogRocket allows you to understand these errors in new and unique ways. Our frontend monitoring solution tracks user engagement with your JavaScript frontends to give you the ability to see exactly what the user did that led to an error.
LogRocket records console logs, page load times, stack traces, slow network requests/responses with headers + bodies, browser metadata, and custom logs. Understanding the impact of your JavaScript code will never be easier!

Compare the top AI development tools and models of February 2026. View updated rankings, feature breakdowns, and find the best fit for you.

Broken npm packages often fail due to small packaging mistakes. This guide shows how to use Publint to validate exports, entry points, and module formats before publishing.

Discover what’s new in The Replay, LogRocket’s newsletter for dev and engineering leaders, in the February 11th issue.

Cut React LCP from 28s to ~1s with a four-phase framework covering bundle analysis, React optimizations, SSR, and asset/image tuning.
Hey there, want to help make our blog better?
Join LogRocket’s Content Advisory Board. You’ll help inform the type of content we create and get access to exclusive meetups, social accreditation, and swag.
Sign up now