If you’ve ever had to debug a memory leak or profile a performance issue in Chrome, you’ve probably experienced the clunky Performance and Memory tabs in the dev tools. While providing highly granular information, they require purposefully starting and stopping a “recording”, and significantly increase CPU and memory usage on your machine.
Recently added in Chrome Canary, the streaming Performance Monitor displays live performance and memory stats as your app runs. It combines the most useful data from the Performance and Memory tabs showing:
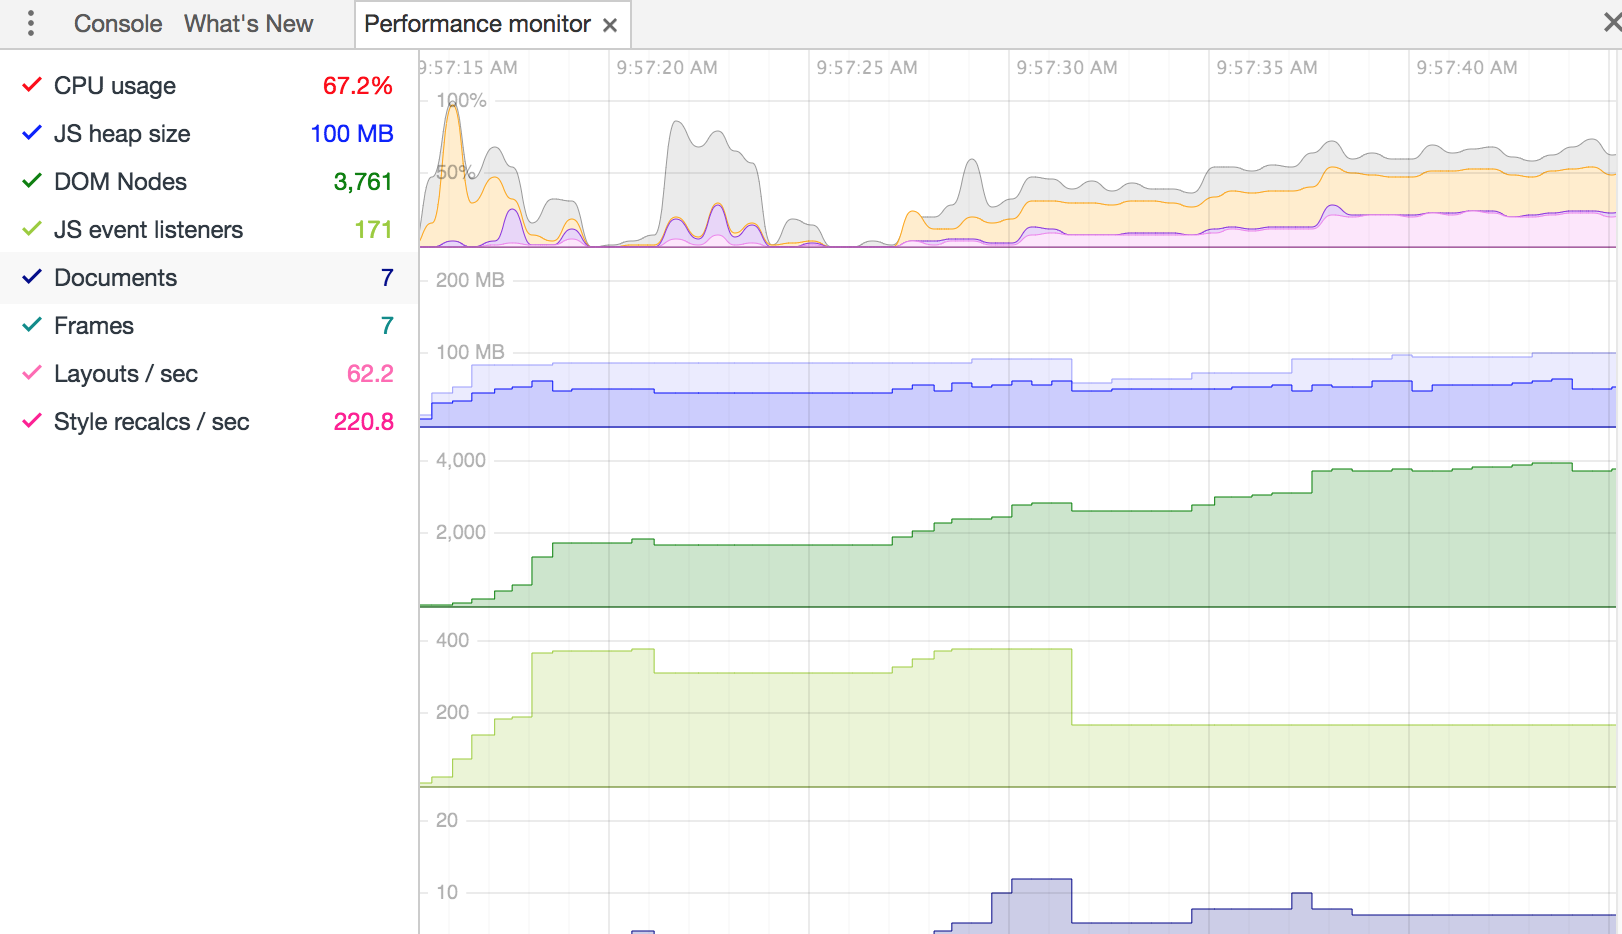
Since the performance monitor doesn’t require starting and stopping a discrete recording, you can keep it open as you use your app on a day-to-day basis. If you see the CPU or memory spike, you’ll know that something might be awry.
This can also save time when it’s not immediately clear which action or page in the app causes a slowdown — since the stats are live, you’ll see right away when you do something in the app and the CPU or memory usage begins to climb.
To be clear, the Performance Monitor doesn’t completely replace the Performance and Memory tabs. These yield more granular information and are helpful when trying to figure out the root cause of an issue since you can record one instance and then pause and zoom in on problem areas.
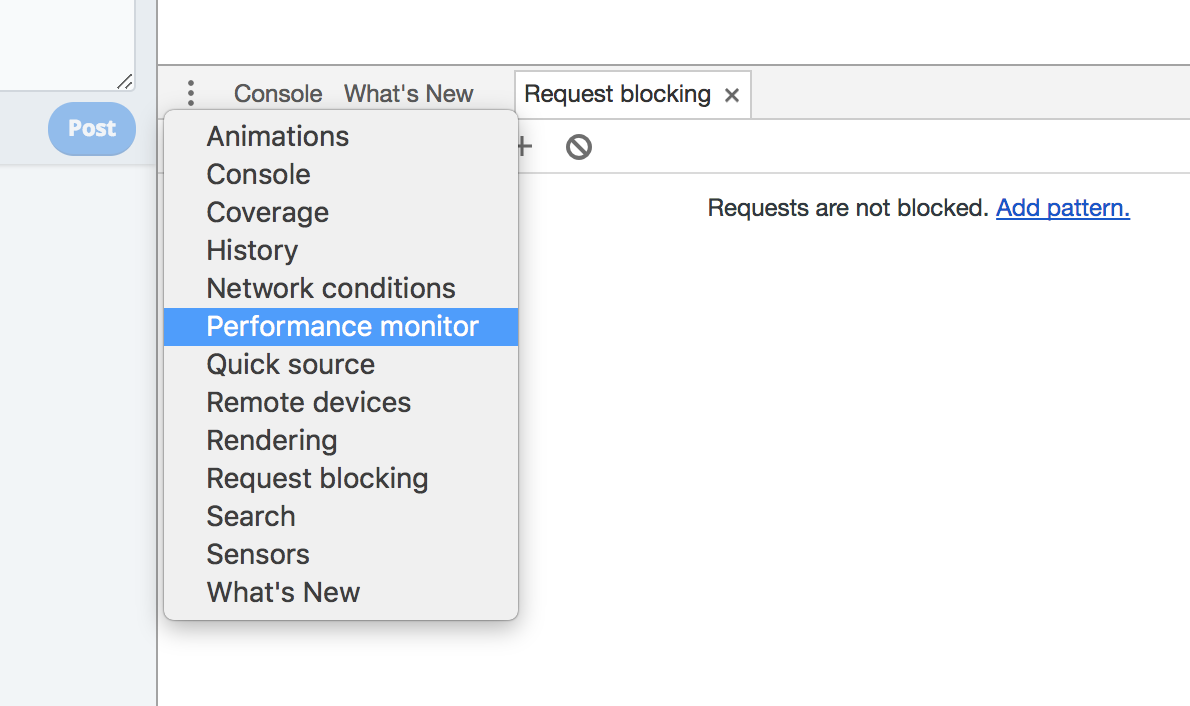
Make sure you have the latest version of Chrome Canary, and click on “Performance monitor” in the dropdown next to “Console” in the lower pane of the developer tools.
If you don’t want to install Canary, you’ll only have to wait a few weeks for the performance monitor to reach Chrome Stable (the regular version of Chrome).
LogRocket helps product teams build better experiences for their users. By recording videos of user sessions along with logs and network data, LogRocket surfaces UX problems and reveals the root cause of every bug.
We built the same app in TanStack Start RSC and Next.js RSC. TanStack shipped 40% less JS and built 4x faster — but Next.js is still the safer production bet.

From RSC vulnerabilities and the Vercel breach to TypeScript 7.0 Beta and AI agents — the nine frontend storylines that defined H1 2026, ranked.

AI tools generate working React code fast, but miss race conditions, empty states, debouncing, and accessibility. Here’s how to catch bugs before production.

Learn how to use Gemini CLI subagents to delegate frontend, backend, testing, and docs tasks to specialized agents with guardrails and clear ownership.
Would you be interested in joining LogRocket's developer community?
Join LogRocket’s Content Advisory Board. You’ll help inform the type of content we create and get access to exclusive meetups, social accreditation, and swag.
Sign up now