
Elasticsearch is an open-source, distributed search and analytics engine based on Apache Lucene. Unlike typical SQL and NoSQL databases whose primary purpose is to store data, Elasticsearch stores, and indexes data so that it can be quickly searched through and analyzed. It also integrates with Logstash (a data processing pipeline that can take in data from multiple sources like logs and databases) and Kibana (for data visualization) and together, they make up the ELK stack.

In this tutorial, we will explore how to combine the powers of Elasticsearch and Golang. We will build a basic content management system with the ability to create, read, update, and delete posts, as well as the ability to search the posts through Elasticsearch.
The Replay is a weekly newsletter for dev and engineering leaders.
Delivered once a week, it's your curated guide to the most important conversations around frontend dev, emerging AI tools, and the state of modern software.
To follow along with the sample project in this tutorial, you will need:
Create a new directory in your preferred location to house the project (I’m naming mine letterpress) and initialize a new Go module with the commands below:
$ mkdir letterpress && cd letterpress
$ go mod init gitlab.com/idoko/letterpress
The application dependencies comprise of:
Install the dependencies by running the following command in your terminal:
$ go get github.com/lib/pq github.com/elastic/go-elasticsearch github.com/gin-gonic/gin github.com/rs/zerolog
Next, create the needed folders and files in the project directory to match the structure below:
├── cmd
│   ├── api
│   │   └── main.go
├── db
│   ├── database.go
│   └── posts.go
├── .env
├── handler
├── logstash
│   ├── config
│   ├── pipelines
│   └── queries
└── models
    └── post.go
cmd — This is where the application binaries (i.e. main.go files) live. We’ve also added an inner api sub-folder to allow for multiple binaries which won’t be possible otherwisedb — The db package acts as a bridge between our application and the database. We will also use it later on to store the database migration files.env — Contains a “key-value” mapping of our environment variables (e.g., the database credentials)handler — The handler package includes the API route handlers powered by the gin frameworklogstash — This is where we keep code related to logstash such as pipeline configurations and the accompanying Dockerfilemodels — Models are Golang structs that can be marshaled into the appropriate JSON objectsOpen the .env file in the project root directory and set up the environment variables like this:
POSTGRES_USER=letterpress
POSTGRES_PASSWORD=letterpress_secrets
POSTGRES_HOST=postgres
POSTGRES_PORT=5432
POSTGRES_DB=letterpress_db

ELASTICSEARCH_URL="http://elasticsearch:9200"
Open the post.go file (in the models folder) and set up the Post struct:
package models

type Post struct {
   ID    int    `json:"id,omitempty"`
   Title string `json:"title"`
   Body  string `json:"body"`
}
Next, add the code below to db/database.go to manage the database connection:
package db

import (
   "database/sql"
   "fmt"
   _ "github.com/lib/pq"
   "github.com/rs/zerolog"
)

type Database struct {
   Conn *sql.DB
   Logger zerolog.Logger
}

type Config struct {
   Host     string
   Port     int
   Username string
   Password string
   DbName   string
   Logger zerolog.Logger
}

func Init(cfg Config) (Database, error) {
   db := Database{}
   dsn := fmt.Sprintf("host=%s port=%d user=%s password=%s dbname=%s sslmode=disable",
      cfg.Host, cfg.Port, cfg.Username, cfg.Password, cfg.DbName)
   conn, err := sql.Open("postgres", dsn)
   if err != nil {
      return db, err
   }

   db.Conn = conn
   db.Logger = cfg.Logger
   err = db.Conn.Ping()
   if err != nil {
      return db, err
   }
   return db, nil
}
In the code above, we set up the database configuration and add a Logger field which can then be used to log database errors and events.
Also, open db/posts.go and implement the database operations for the posts and post_logs tables which we will create shortly:
package db

import (
   "database/sql"
   "fmt"
   "gitlab.com/idoko/letterpress/models"
)

var (
   ErrNoRecord = fmt.Errorf("no matching record found")
   insertOp = "insert"
   deleteOp = "delete"
   updateOp = "update"
)

func (db Database) SavePost(post *models.Post) error {
   var id int
   query := `INSERT INTO posts(title, body) VALUES ($1, $2) RETURNING id`
   err := db.Conn.QueryRow(query, post.Title, post.Body).Scan(&id)
   if err != nil {
      return err
   }
   logQuery := `INSERT INTO post_logs(post_id, operation) VALUES ($1, $2)`
   post.ID = id
   _, err = db.Conn.Exec(logQuery, post.ID, insertOp)
   if err != nil {
      db.Logger.Err(err).Msg("could not log operation for logstash")
   }
   return nil
}
Above, we implement a SavePost function that inserts the Post argument in the database. If the insertion is successful, it proceeds to log the operation and the ID generated for the new post into a post_logs table. These logs happen at the app level but if you feel like your database operations won’t always pass through the app, you can try doing it at the database level using triggers. Logstash will later use these logs to synchronize our Elasticsearch index with our application database.
Still in the posts.go file, add the code below to update and delete posts from the database:
func (db Database) UpdatePost(postId int, post models.Post) error {
   query := "UPDATE posts SET title=$1, body=$2 WHERE id=$3"
   _, err := db.Conn.Exec(query, post.Title, post.Body, postId)
   if err != nil {
      return err
   }

   post.ID = postId
   logQuery := "INSERT INTO post_logs(post_id, operation) VALUES ($1, $2)"
   _, err = db.Conn.Exec(logQuery, post.ID, updateOp)
   if err != nil {
      db.Logger.Err(err).Msg("could not log operation for logstash")
   }
   return nil
}

func (db Database) DeletePost(postId int) error {
   query := "DELETE FROM Posts WHERE id=$1"
   _, err := db.Conn.Exec(query, postId)
   if err != nil {
      if err == sql.ErrNoRows {
         return ErrNoRecord
      }
      return err
   }

   logQuery := "INSERT INTO post_logs(post_id, operation) VALUES ($1, $2)"
   _, err = db.Conn.Exec(logQuery, postId, deleteOp)
   if err != nil {
      db.Logger.Err(err).Msg("could not log operation for logstash")
   }
   return nil
}
While PostgreSQL will automatically create our application database when setting it up in the Docker container, we will need to set up the tables ourselves. To do that, we will use the golang-migrate/migrate to manage our database migrations. Install migrate using this guide and run the command below to generate the migration file for the posts table:
$ migrate create -ext sql -dir db/migrations -seq create_posts_table
$ migrate create -ext sql -dir db/migrations -seq create_post_logs_table
The above command will create four SQL files in db/migrations, two of which have a .up.sql extension while the other two end with .down.sql. Up migrations are executed when we apply the migrations. Since we want to create the tables in our case, add the code block below to the XXXXXX_create_posts_table.up.sql file:
CREATE TABLE IF NOT EXISTS posts (
    id SERIAL PRIMARY KEY,
    title VARCHAR(150),
    body text
);
Similarly, open XXXXXX_create_post_logs_table.up.sql and direct it to create the posts_logs table like this:
CREATE TABLE IF NOT EXISTS post_logs (
    id SERIAL PRIMARY KEY,
    post_id INT NOT NULL,
    operation VARCHAR(20) NOT NULL,
    created_at TIMESTAMP DEFAULT CURRENT_TIMESTAMP
);
Down migrations are applied when we want to rollback the changes we’ve made to the database. In our case, we want to delete the tables we just created. Add the code below to XXXXXX_create_posts_table.down.sql to delete the posts table:
DROP TABLE IF EXISTS posts;
Do the same thing for the posts_logs table by adding the code below to XXXXXX_create_post_logs_table.down.sql:
DROP TABLE IF EXISTS post_logs;
Create a docker-compose.yml file in the project root and declare the services our application needs like this:
version: "3"

services:
  postgres:
    image: postgres
    restart: unless-stopped
    hostname: postgres
    env_file: .env
    ports:
      - "5432:5432"
    volumes:
      - pgdata:/var/lib/postgresql/data

  api:
    build:
      context: .
      dockerfile: Dockerfile
    hostname: api
    env_file: .env
    ports:
      - "8080:8080"
    depends_on:
      - postgres

  elasticsearch:
    image: 'docker.elastic.co/elasticsearch/elasticsearch:7.10.2'
    environment:
      - discovery.type=single-node
      - "ES_JAVA_OPTS=-Xms512m -Xmx512m"
    ports:
      - "9200:9200"
    volumes:
      - esdata:/usr/share/elasticsearch/data

volumes:
  pgdata:
    driver: local
  esdata:
    driver: local
The services include:
postgres — The PostgreSQL database our app will use. It also exposes the default PostgreSQL port so that we can access our database from outside of the containerapi — This is our application’s REST API which allows us to create and search postselasticsearch — The Elasticsearch image that powers our search feature. We’ve also set the discovery type to single-node since we are in a development environmentNext, create the project’s Dockerfile in the project folder and fill it with the code below:
FROM golang:1.15.7-buster

COPY go.mod go.sum /go/src/gitlab.com/idoko/letterpress/
WORKDIR /go/src/gitlab.com/idoko/letterpress
RUN go mod download
COPY . /go/src/gitlab.com/idoko/letterpress
RUN go build -o /usr/bin/letterpress gitlab.com/idoko/letterpress/cmd/api

EXPOSE 8080 8080
ENTRYPOINT ["/usr/bin/letterpress"]
In the code above, we’ve set up Docker to build our application using the Debian buster image for Go. Next, it downloads the app dependencies, builds the app, and copies the resulting binary to /usr/bin.
While we haven’t implemented the REST API yet, you can try out the progress so far by running docker-compose up--build in your terminal to start up the services.
With the PostgreSQL service running, export the Data Source Name (DSN) as an environment variable and apply the migrations we created by running the commands below from the project root directory:
$ export PGURL="postgres://letterpress:letterpress_secrets@localhost:5432/letterpress_db?sslmode=disable"
$ migrate -database $PGURL -path db/migrations/ up
NOTE: The DSN has the format postgres://USERNAME:PASSWORD@HOST:PORT/DATABASE?sslmode=SSLMODE. Remember to use your values if they are different from the ones we used in the .env file above.
To set up our API routes, create a new handler.go file in the handlers folder and set it up to initialize and register the relevant routes:
package handler

import (
   "github.com/elastic/go-elasticsearch/v7"
   "github.com/gin-gonic/gin"
   "github.com/rs/zerolog"
   "gitlab.com/idoko/letterpress/db"
)

type Handler struct {
   DB     db.Database
   Logger zerolog.Logger
   ESClient *elasticsearch.Client
}

func New(database db.Database, esClient *elasticsearch.Client, logger zerolog.Logger) *Handler {
   return &Handler{
      DB:     database,
      ESClient: esClient,
      Logger: logger,
   }
}

func (h *Handler) Register(group *gin.RouterGroup) {
   group.GET("/posts/:id", h.GetPost)
   group.PATCH("/posts/:id", h.UpdatePost)
   group.DELETE("/posts/:id", h.DeletePost)

   group.GET("/posts", h.GetPosts)
   group.POST("/posts", h.CreatePost)

   group.GET("/search", h.SearchPosts)
}
The routes expose a CRUD interface to our posts, as well as a search endpoint to allow for searching all the posts using Elasticsearch.
Create a post.go file in the same handlers directory and add the implementation for the route handlers above (for brevity, we will go over creating and searching posts, though you can see the complete implementation for the other handlers in the project’s GitLab repository):
package handler

import (
   "context"
   "encoding/json"
   "fmt"
   "github.com/gin-gonic/gin"
   "gitlab.com/idoko/letterpress/db"
   "gitlab.com/idoko/letterpress/models"
   "net/http"
   "strconv"
   "strings"
)

func (h *Handler) CreatePost(c *gin.Context) {
   var post models.Post
   if err := c.ShouldBindJSON(&post); err != nil {
      h.Logger.Err(err).Msg("could not parse request body")
      c.JSON(http.StatusBadRequest, gin.H{"error": fmt.Sprintf("invalid request body: %s", err.Error())})
      return
   }
   err := h.DB.SavePost(&post)
   if err != nil {
      h.Logger.Err(err).Msg("could not save post")
      c.JSON(http.StatusInternalServerError, gin.H{"error": fmt.Sprintf("could not save post: %s", err.Error())})
   } else {
      c.JSON(http.StatusCreated, gin.H{"post": post})
   }
}

func (h *Handler) SearchPosts(c *gin.Context) {
   var query string
   if query, _ = c.GetQuery("q"); query == "" {
      c.JSON(http.StatusBadRequest, gin.H{"error": "no search query present"})
      return
   }

   body := fmt.Sprintf(
      `{"query": {"multi_match": {"query": "%s", "fields": ["title", "body"]}}}`,
      query)
   res, err := h.ESClient.Search(
      h.ESClient.Search.WithContext(context.Background()),
      h.ESClient.Search.WithIndex("posts"),
      h.ESClient.Search.WithBody(strings.NewReader(body)),
      h.ESClient.Search.WithPretty(),
      )
   if err != nil {
      h.Logger.Err(err).Msg("elasticsearch error")
      c.JSON(http.StatusInternalServerError, gin.H{"error": err.Error()})
      return
   }
   defer res.Body.Close()
   if res.IsError() {
      var e map[string]interface{}
      if err := json.NewDecoder(res.Body).Decode(&e); err != nil {
         h.Logger.Err(err).Msg("error parsing the response body")
      } else {
         h.Logger.Err(fmt.Errorf("[%s] %s: %s",
            res.Status(),
            e["error"].(map[string]interface{})["type"],
            e["error"].(map[string]interface{})["reason"],
         )).Msg("failed to search query")
      }
      c.JSON(http.StatusInternalServerError, gin.H{"error": e["error"].(map[string]interface{})["reason"]})
      return
   }

   h.Logger.Info().Interface("res", res.Status())

   var r map[string]interface{}
   if err := json.NewDecoder(res.Body).Decode(&r); err != nil {
      h.Logger.Err(err).Msg("elasticsearch error")
      c.JSON(http.StatusInternalServerError, gin.H{"error": err.Error()})
      return
   }
   c.JSON(http.StatusOK, gin.H{"data": r["hits"]})
}
CreatePost takes the JSON request body and transforms it into a Post struct using gin’s ShouldBindJSON. The resulting object is then saved to the database using the SavePost function we wrote earlier.
SearchPosts is more involved. It uses Elasticsearch’s multi-query to search the posts. That way, we can quickly find posts whose title and/or body contains the given query. We also check for and log any error that might occur, and transform the response into a JSON object using the json package from the Go standard library, and present it to the user as their search results.
Logstash is a data processing pipeline that takes in data from different input sources, processes them, and sends them to an output source.
Since the goal is to make data in our database searchable via Elasticsearch, we will configure Logstash to use the PostgreSQL database as its input and Elasticsearch as output.
In the logstash/config directory, create a new pipelines.yml file to hold all the Logstash pipelines we will be needing. For this project, it is a single pipeline that syncs the database with Elasticsearch. Add the code below in the new pipelines.yml:
- pipeline.id: sync-posts-pipeline
  path.config: "/usr/share/logstash/pipeline/sync-posts.conf"
Next, add a sync-posts.conf file in the logstash/pipeline folder with the code below to set up the input and output sources:
input {
    jdbc {
        jdbc_connection_string => "jdbc:postgresql://${POSTGRES_HOST}:5432/${POSTGRES_DB}"
        jdbc_user => "${POSTGRES_USER}"
        jdbc_password => "${POSTGRES_PASSWORD}"
        jdbc_driver_library => "/opt/logstash/vendor/jdbc/postgresql-42.2.18.jar"
        jdbc_driver_class => "org.postgresql.Driver"
        statement_filepath => "/usr/share/logstash/config/queries/sync-posts.sql"
        use_column_value => true
        tracking_column => "id"
        tracking_column_type => "numeric"
        schedule => "*/5 * * * * *"
    }
}

filter {
    mutate {
        remove_field => ["@version", "@timestamp"]
    }
}

output {
    if [operation] == "delete" {
        elasticsearch {
            hosts => ["http://elasticsearch:9200"] # URL of the ES docker container - docker would resolve it for us.
            action => "delete"
            index => "posts"
            document_id => "%{post_id}"
        }
    } else if [operation] in ["insert", "update"] {
        elasticsearch {
            hosts => ["http://elasticsearch:9200"]
            action => "index"
            index => "posts"
            document_id => "%{post_id}"
        }
    }
}
The config file above is made up of three blocks:
input — Establishes a connection to PostgreSQL using the JDBC plugin and instructs Logstash to run the SQL query specified by statement_filepath every five seconds (configured by the schedule value). While schedule has a cron-like syntax, it also supports sub-minute intervals and uses rufus-scheduler behind the scenes. You can learn more about the syntax and configuring it here. We also track the id column so that Logstash only fetches operations that were logged since the last run of the pipelinefilter — Removes unneeded fields including ones added by Logstashoutput — Responsible for moving the input data into our Elasticsearch index. It uses ES conditionals to either delete a document from the index (if the operation field in the database is a delete) or create/update a document (if the operation is either an insert or an update)You can explore the Logstash docs on input, filter, and output plugins to see even more of what is possible in each block.
Next, create a sync-posts.sql file in logstash/queries to house our pipeline’s SQL statement:
SELECT l.id,
       l.operation,
       l.post_id,
       p.id,
       p.title,
       p.body
FROM post_logs l
         LEFT JOIN posts p
                   ON p.id = l.post_id
WHERE l.id > :sql_last_value ORDER BY l.id;
The SELECT statement uses SQL joins to fetch the relevant post based on the post_id in the post_logs table.
With our Logstash configured, we can now set up its Dockerfile and add it to our docker-compose services. Create a new file named Dockerfile in the logstash folder and add the code below to it:
FROM docker.elastic.co/logstash/logstash:7.10.2

RUN /opt/logstash/bin/logstash-plugin install logstash-integration-jdbc
RUN mkdir /opt/logstash/vendor/jdbc
RUN curl -o /opt/logstash/vendor/jdbc/postgresql-42.2.18.jar https://jdbc.postgresql.org/download/postgresql-42.2.18.jar

ENTRYPOINT ["/usr/local/bin/docker-entrypoint"]
The Dockerfile above takes the official Logstash image and sets up the JDBC plugin as well as the PostgreSQL JDBC driver which our pipeline needs.
Update the docker-compose.yml file by adding Logstash to the list of services (i.e., before the volumes block) like this:
logstash:
  build:
    context: logstash
  env_file: .env
  volumes:
    - ./logstash/config/pipelines.yml:/usr/share/logstash/config/pipelines.yml
    - ./logstash/pipelines/:/usr/share/logstash/pipeline/
    - ./logstash/queries/:/usr/share/logstash/config/queries/
  depends_on:
    - postgres
    - elasticsearch
The Logstash service uses the logstash directory that contains the Dockerfile as its context. It also uses volumes to mount the configuration files from earlier into the appropriate directories in the Logstash container.
We are now ready to expose our project as an HTTP API. We will do this through the main.go residing in cmd/api. Open it in your editor and add the code below to it:
package main

import (
   "github.com/elastic/go-elasticsearch/v7"
   "os"
   "strconv"

   "github.com/gin-gonic/gin"
   "github.com/rs/zerolog"
   "gitlab.com/idoko/letterpress/db"
   "gitlab.com/idoko/letterpress/handler"
)

func main() {
   var dbPort int
   var err error
   logger := zerolog.New(os.Stderr).With().Timestamp().Logger()

   port := os.Getenv("POSTGRES_PORT")
   if dbPort, err = strconv.Atoi(port); err != nil {
      logger.Err(err).Msg("failed to parse database port")
      os.Exit(1)
   }
   dbConfig := db.Config{
      Host:     os.Getenv("POSTGRES_HOST"),
      Port:     dbPort,
      Username: os.Getenv("POSTGRES_USER"),
      Password: os.Getenv("POSTGRES_PASSWORD"),
      DbName:   os.Getenv("POSTGRES_DB"),
      Logger: logger,
   }
   logger.Info().Interface("config", &dbConfig).Msg("config:")
   dbInstance, err := db.Init(dbConfig)
   if err != nil {
      logger.Err(err).Msg("Connection failed")
      os.Exit(1)
   }
   logger.Info().Msg("Database connection established")

   esClient, err := elasticsearch.NewDefaultClient()
   if err != nil {
      logger.Err(err).Msg("Connection failed")
      os.Exit(1)
   }

   h := handler.New(dbInstance, esClient, logger)
   router := gin.Default()
   rg := router.Group("/v1")
   h.Register(rg)
   router.Run(":8080")
}
First, we set up a logger and pass it to all the application components to ensure that errors and event logs are uniform. Next, we establish a database connection using values from the environment variables (managed by the .env file). We also connect to the Elasticsearch server and ensure that it is reachable. Following that, we initialize our route handler and start the API server on port 8080. Notice that we also use gin’s route groups to put all of our routes under a v1 namespace, that way, we also provide a sort of “versioning” for our API.
At this point, we can now try out our search application. Rebuild and start the docker-compose services by running docker-compose up --build in your terminal. The command should also start the API server on http://localhost:8080.
Bring up your favorite API testing tool (e.g Postman, cURL, HTTPie, etc.) and create some posts. In the example below, I’ve used HTTPie to add five different posts (sourced from the Creative Commons blog) to our database:
$ http POST localhost:8080/v1/posts title="Meet CC South Africa, Our Next Feature for CC Network Fridays" body="After introducing the CC Italy Chapter to you in July, the CC Netherlands Chapter in August, CC Bangladesh Chapter in September, CC Tanzania Chapter in October, and the CC India Chapter in November, the CC Mexico Chapter in December, and CC Argentina Chapter in January, we are now traveling to Africa"

$ http POST localhost:8080/v1/posts title="Still Life: Art That Brings Comfort in Uncertain Times" body="There is a quiet, familiar beauty found in still life, a type of art that depicts primarily inanimate objects, like animals, food, or flowers. These comforting images offer a sense of certainty and simplicity in uncertain and complex times. This could explain why over six million Instagram users have fallen in love with still life"

$ http POST localhost:8080/v1/posts title="Why Universal Access to Information Matters" body="The coronavirus outbreak not only sparked a health pandemic; it triggered an infodemic of misleading and fabricated news. As the virus spread, trolls and conspiracy theorists began pushing misinformation, and their deplorable tactics continue to this day."
If you prefer to use Postman, here’s a screenshot of a Postman request similar to the ones above:
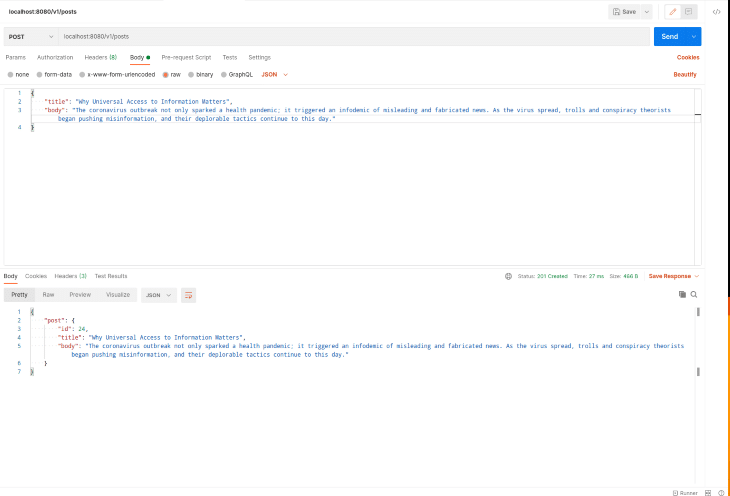
You can also check the docker-compose logs (if you are not running docker-compose in the background) to see how Logstash indexes the new posts.
To test out the search endpoint, make a HTTP GET request to http://localhost:8080/v1/search as shown in the Postman screenshot below:
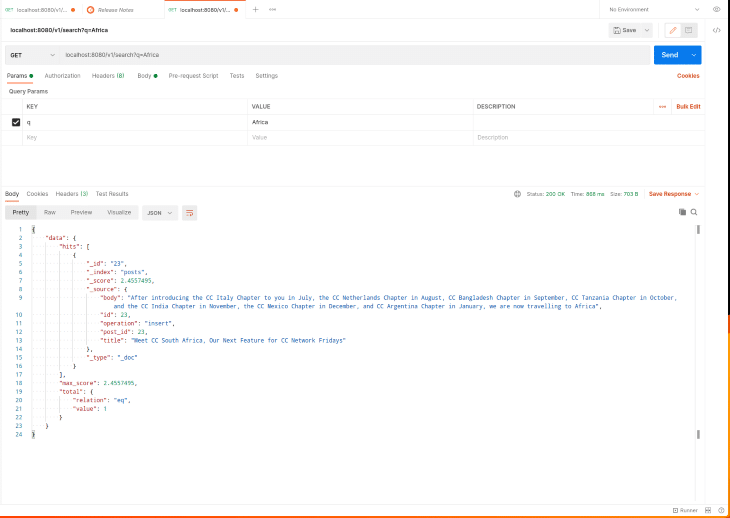
While we can always use the Elasticsearch API to see what is going on in our Elasticsearch server or see the documents currently in the index, it is sometimes helpful to visualize and explore this information in a tailored dashboard. Kibana allows us to do just that. Update the docker-compose file to include the Kibana service by adding the code below in the services section (i.e., after the logstash service but before the volumes section):
kibana:
  image: 'docker.elastic.co/kibana/kibana:7.10.2'
  ports:
    - "5601:5601"
  hostname: kibana
  depends_on:
    - elasticsearch
We make Kibana dependent on the Elasticsearch service since it will be useless if Elasticsearch isn’t up and running. We also expose the default Kibana port so that we can access the dashboard from our development machine.
Start the docker-compose services by running docker-compose up (you will have to stop them first with docker-compose down if they were running). Visit http://localhost:5601 to access the Kibana dashboard.
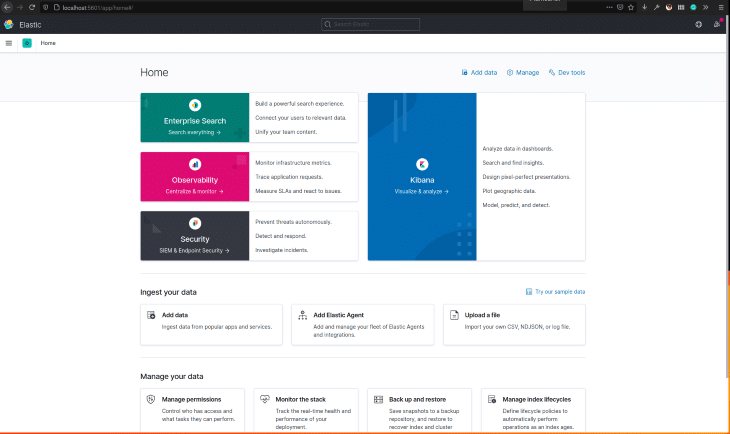
You can also use the Dev Tools to view all the documents in the posts index or to try out different search queries before using them in your application. In the screenshot below, we use match_all to list all the indexed posts:
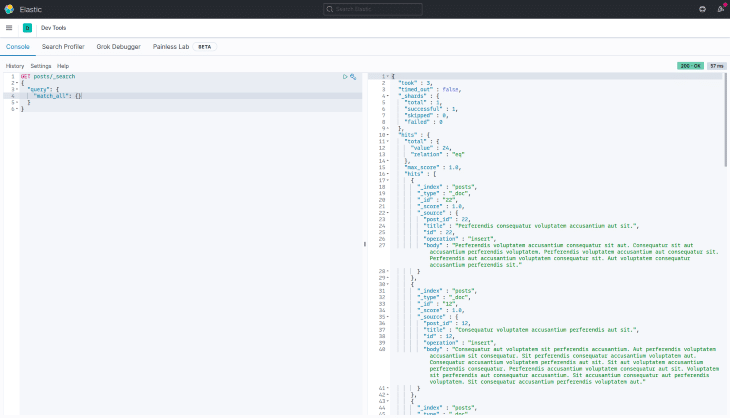
In this article, we explored adding “search” to our Go application using the ELK stack. The complete source code is available on GitLab. Feel free to create an issue there if you run into a problem.
Install LogRocket via npm or script tag. LogRocket.init() must be called client-side, not
server-side
$ npm i --save logrocket

// Code:

import LogRocket from 'logrocket';
LogRocket.init('app/id');
// Add to your HTML:

<script src="https://cdn.lr-ingest.com/LogRocket.min.js"></script>
<script>window.LogRocket && window.LogRocket.init('app/id');</script>

AI-generated tests can speed up React testing, but they also create hidden risks. Here’s what broke in a real app.re

Why the future of DX might come from the web platform itself, not more tools or frameworks.
A hands-on test of Claude Code Review across real PRs, breaking down what it flagged, what slipped through, and how the pipeline actually performs in practice.

CSS art once made frontend feel playful and accessible. Here’s why it faded as the web became more practical and prestige-driven.
Would you be interested in joining LogRocket's developer community?
Join LogRocket’s Content Advisory Board. You’ll help inform the type of content we create and get access to exclusive meetups, social accreditation, and swag.
Sign up now