Building a clone of a well-known application or site is a great way to learn a new technology or level up knowledge you already have. So, while D3 might not be the first tool you’d think to reach for to build a calendar app, we can learn a lot about the library by using it to create a Google Calendar clone.

For simplicity, we’ll create a directory and then scaffold our app using Snowpack. From the command line, run the following (you can also run the yarn equivalents if that’s your thing):
mkdir calendar-clone
cd calendar-clone
npm init -y
npm install --save-dev snowpack
npm install --save d3
Before we get anything running, we should first create an HTML file (index.html ) in the root of our calendar-clone directory with the following contents:
<!DOCTYPE html>
<html lang="en">
  <head>
    <meta charset="utf-8" />
    <meta name="viewport" content="width=device-width, initial-scale=1" />
    <meta name="description" content="Starter Snowpack App" />
    <title>D3 Calendar App</title>
  </head>
  <body>
    <h1>D3 Calendar</h1>
    <script type="module" src="/index.js"></script>
  </body>
</html>
We’ll also create an index.js file in the same directory (which where we’ll be doing the rest of our work).
Just to be safe, let’s add a console log statement to make sure it’s running correctly:
console.log("Let's build a calendar app!");
From here, you can start up your dev server and run the following command from your terminal:
npx snowpack dev
This will start your dev server and open a browser window where it’s running.
Once you open the console in your browser devtools and find the log we added above, we’re ready to start building our app!
The Replay is a weekly newsletter for dev and engineering leaders.
Delivered once a week, it's your curated guide to the most important conversations around frontend dev, emerging AI tools, and the state of modern software.
D3 is most often used for pulling in, parsing, and visualizing data. In this tutorial, we will bypass the data manipulation that would take place in most data visualization projects by creating our own JSON object.
To begin building our app, our first step is to clear out the previous test code we added to our index.js file. With our index.js file blank, we will now import D3, declare some calendar events, and create a dates array which will be used later:
import * as d3 from 'd3';
const calendarEvents = [
  {
    timeFrom: '2020-11-11T05:00:00.000Z',
    timeTo: '2020-11-11T12:00:00.000Z',
    title: 'Sleep',
    background: '#616161'
  },
  {
    timeFrom: '2020-11-11T16:00:00.000Z',
    timeTo: '2020-11-11T17:30:00.000Z',
    title: 'Business meeting',
    background: '#33B779'
  },
  {
    timeFrom: '2020-11-12T00:00:00.000Z',
    timeTo: '2020-11-12T05:00:00.000Z',
    title: 'Wind down time',
    background: '#616161'
  }
];
// Make an array of dates to use for our yScale later on
const dates = [
  ...calendarEvents.map(d => new Date(d.timeFrom)),
  ...calendarEvents.map(d => new Date(d.timeTo))
];
We will design more later, but to start, we can declare a few variables that are typically part of D3 projects (margin, height, width) and a few others that are specific to ours (barWidth, nowColor):
const margin = { top: 30, right: 30, bottom: 30, left: 50 }; // Gives space for axes and other margins
const height = 1500;
const width = 900;
const barWidth = 600;
const nowColor = '#EA4335';
const barStyle = {
  background: '#616161',
  textColor: 'white',
  width: barWidth,
  startPadding: 2,
  endPadding: 3,
  radius: 3
};
Before we continue, we’ll get something to display on the page so we can see that everything is working:
// Create the SVG element
const svg = d3
  .create('svg')
  .attr('width', width)
  .attr('height', height);
// All further code additions will go just below this line

// Actually add the element to the page
document.body.append(svg.node());
// This part ^ always goes at the end of our index.js
When you open up the browser, you may not notice anything at first, but rest assured, there is a big SVG element on the page. You can confirm this by opening your browser devtools and inspecting the page elements.
This is a great way of debugging issues with D3 as your code will change SVG elements and their properties on your page.
Next, we will add in our scale functions, which are often called x or xScale and y or yScale. These functions are used to map points in our data to a pixel value on our visualization.
For example, if we had data points for 1 through 100 mapped along the y-axis, then the y function would map 82 to be toward the top of our SVG object (82% the way up, to be exact).
In many cases, time would be mapped on the x-scale, but for our purposes, we are going to plot time vertically on the y-scale. For added simplicity, we are only going to build a single-day calendar, so we will not need to include an x-scale at all:
const yScale = d3
  .scaleTime()
  .domain([d3.min(dates), d3.max(dates)])
  .range([margin.top, height - margin.bottom]);
Notice that we pass our data range to domain and our pixel range to range. Also notice that for the range function, we first pass the margin.top, rather than the bottom. This is because SVG are drawn from top to bottom, so the 0 y-coordinate will be at the top.
We’ll use the scale mapping we just created later on, but first, let’s draw the actual y-axis itself:
const yAxis = d3
  .axisLeft()
  .ticks(24)
  .scale(yScale);
// We'll be using this svg variable throughout to append other elements to it
svg
  .append('g')
  .attr('transform', `translate(${margin.left},0)`)
  .attr('opacity', 0.5)
  .call(yAxis);
Then, since we are only showing one day for now, we can style the first and last ticks to just appear as midnight (12AM), with the intention of displaying the actual date somewhere else in the app later.
svg
  .selectAll('g.tick')
  .filter((d, i, ticks) => i === 0 || i === ticks.length - 1)
  .select('text')
  .text('12 AM');
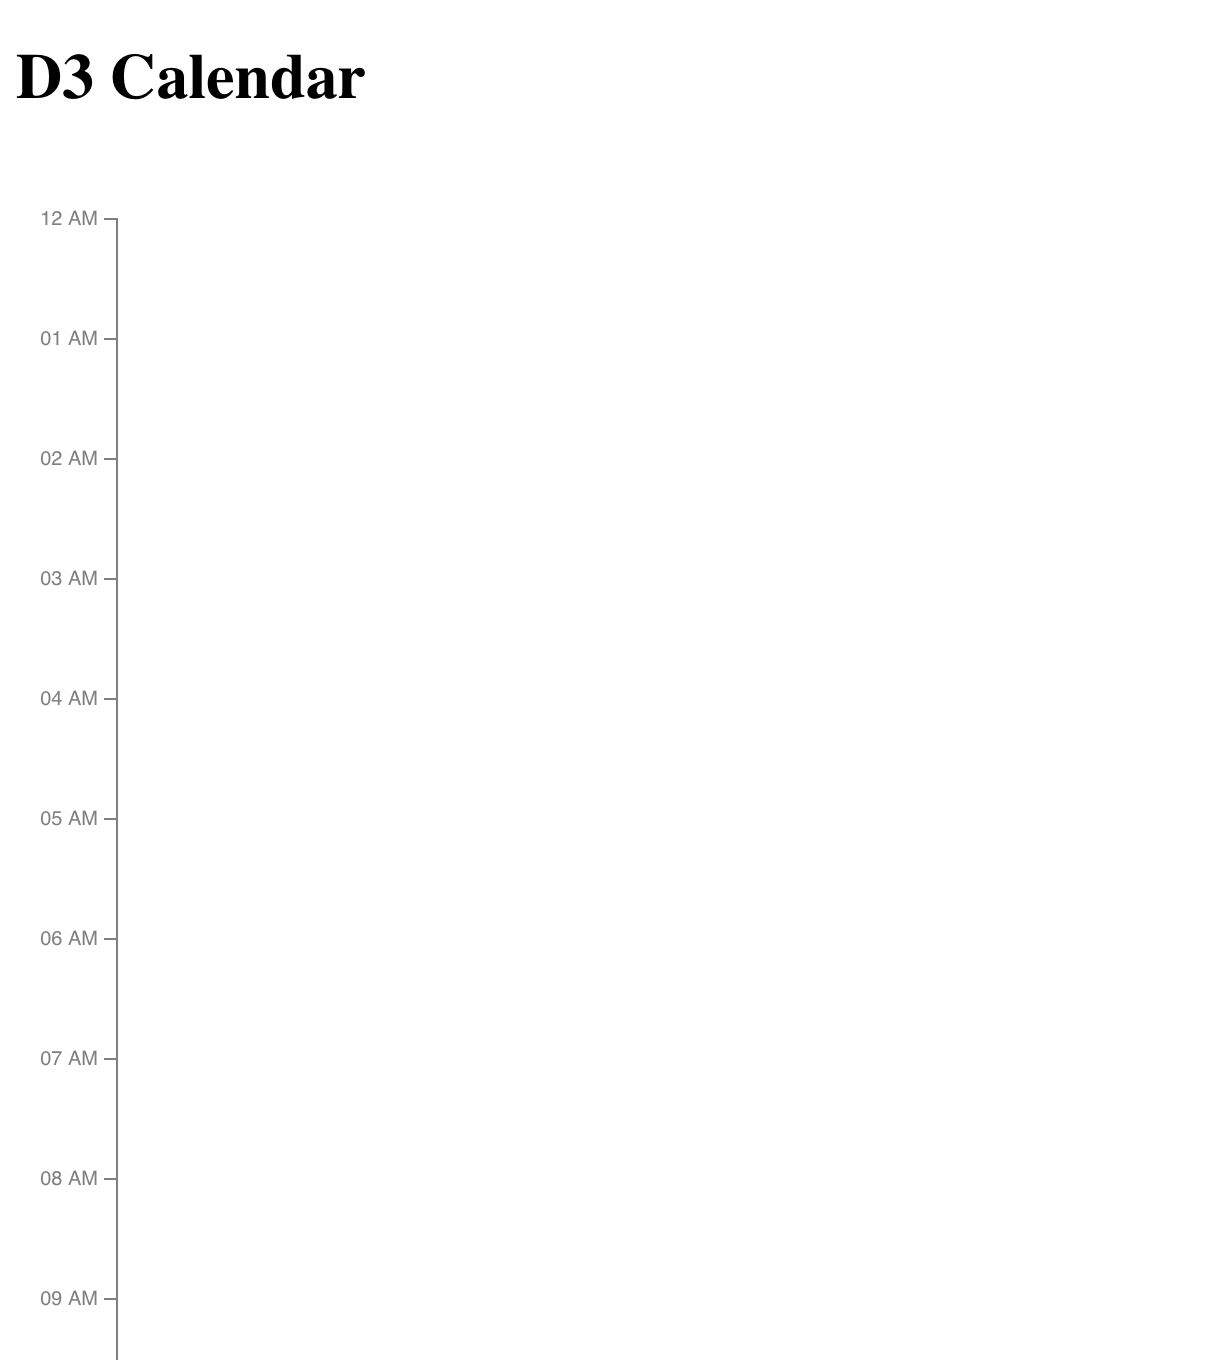
So far, we’ve created an axis, specified that it will be on the left side of our chart, specified that we want 24 tick marks on the axis, and applied our scale. We then used our append function to actually put the axis into a g element within our svg element.
To confirm that this is all set up correctly, inspect the elements you have so far in your browser devtools. The app itself will look like this:
Since this is a calendar after all, we’re going to add some grid lines for design.
In our previous steps, we set up our yAxis and set the ticks to be 24, one for each hour of the day. To set up our grid lines, we will do the same, using axisRight so that the ticks appear on the right side:
const gridLines = d3
  .axisRight()
  .ticks(24)
  .tickSize(barStyle.width) // even though they're "ticks" we've set them to be full-width
  .tickFormat('')
  .scale(yScale);

svg
  .append('g')
  .attr('transform', `translate(${margin.left},0)`)
  .attr('opacity', 0.3)
  .call(gridLines);
As with our earlier approach, we’ve placed our axis within a g element and appended that to our svg element. Check your browser devtools to see the DOM structure.
calendarEvents arrayWith our axis and gridlines in place, we can use the calendarEvents array we created to add in some calendar events.
To add events, we will use the [join](https://observablehq.com/@d3/selection-join) method to add g elements to our svg element. To do this, we will select all existing g elements that have the class of barGroup (hint: none exist yet) and join a new g element with that class for each calendarEvents item that exists.
Here is the code we will add to make that happen:
const barGroups = svg
  .selectAll('g.barGroup')
  .data(calendarEvents)
  .join('g')
    .attr('class', 'barGroup');
Now, when you look at the browser devtools, you should be able to see that we’ve got 3 empty g items (our events list) within our svg element.
With our g items created and calendar event-bound, we are now able to append other elements to them.
For our demo, we will use .append and rect to create colored rectangles for our calendar events:
barGroups
  .append('rect')
  .attr('fill', d => d.background || barStyle.background)
  .attr('x', margin.left)
  .attr('y', d => yScale(new Date(d.timeFrom)) + barStyle.startPadding)
  .attr('height', d => {
    const startPoint = yScale(new Date(d.timeFrom));
    const endPoint = yScale(new Date(d.timeTo));
    return (
      endPoint - startPoint - barStyle.endPadding - barStyle.startPadding
    );
  })
  .attr('width', barStyle.width)
  .attr('rx', barStyle.radius);
In the example above, we’ve done some math to figure out where the rectangle should start vertically and how tall it should be. If you change the math, you’ll see how that affects the app. Just remember: if you do change the math, don’t forget to change it back.
Using a similar approach, we can now add in a line for tracking the current time which will allow users can see where “now” is on the calendar:
// Since we've hardcoded all our events to be on November 11 of 2020, we'll do the same thing for the "now" date
const currentTimeDate = new Date(new Date(new Date().setDate(11)).setMonth(10)).setFullYear(2020);

barGroups
  .append('rect')
  .attr('fill', nowColor)
  .attr('x', margin.left)
  .attr('y', yScale(currentTimeDate) + barStyle.startPadding)
  .attr('height', 2)
  .attr('width', barStyle.width);
Note that we’ve once again used the margin variable that we declared at the start to make sure that our rectangles aren’t going to overlap our axis.
Finally, we will add labels for the events we have on our calendar. We’ll again use the append method, but this time we’ll add a text element to our barGroups variable:
barGroups
  .append('text')
  .attr('font-family', 'Roboto')
  .attr('font-size', 12)
  .attr('font-weight', 500)
  .attr('text-anchor', 'start')
  .attr('fill', barStyle.textColor)
  .attr('x', margin.left + 10)
  .attr('y', d => yScale(new Date(d.timeFrom)) + 20)
  .text(d => d.title);
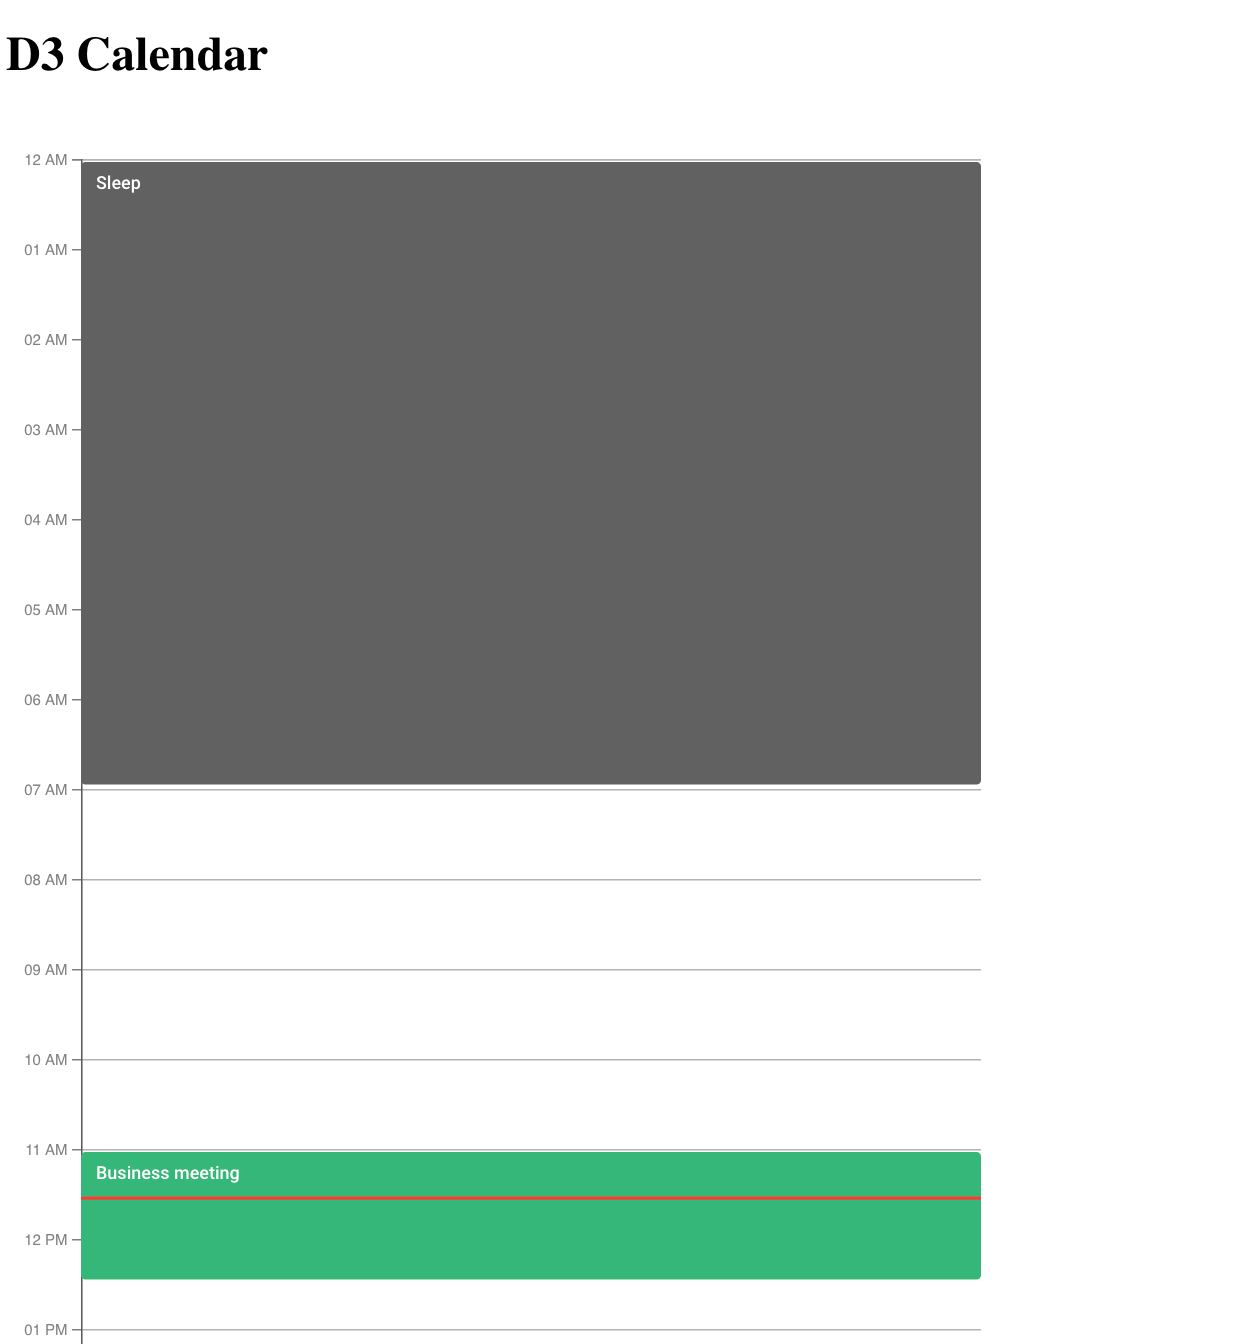
And just like that, we’ve created our own calendar and events app using D3.js! Of course, this is only the beginning of the D3 calendar experiment. You could continue to make improvements from here, like expanding it to a weekly or monthly calendar, or allowing dynamic event creation.
While you may not typically reach for D3 to build a calendar app, this exercise has given us some insight into how scales, axes, and shapes can be drawn using D3. For future experimentation, use browser devtools to see how our changes to our D3 code affects, changes, and modifies SVG elements in the app.
There’s no doubt that frontends are getting more complex. As you add new JavaScript libraries and other dependencies to your app, you’ll need more visibility to ensure your users don’t run into unknown issues.
LogRocket is a frontend application monitoring solution that lets you replay JavaScript errors as if they happened in your own browser so you can react to bugs more effectively.
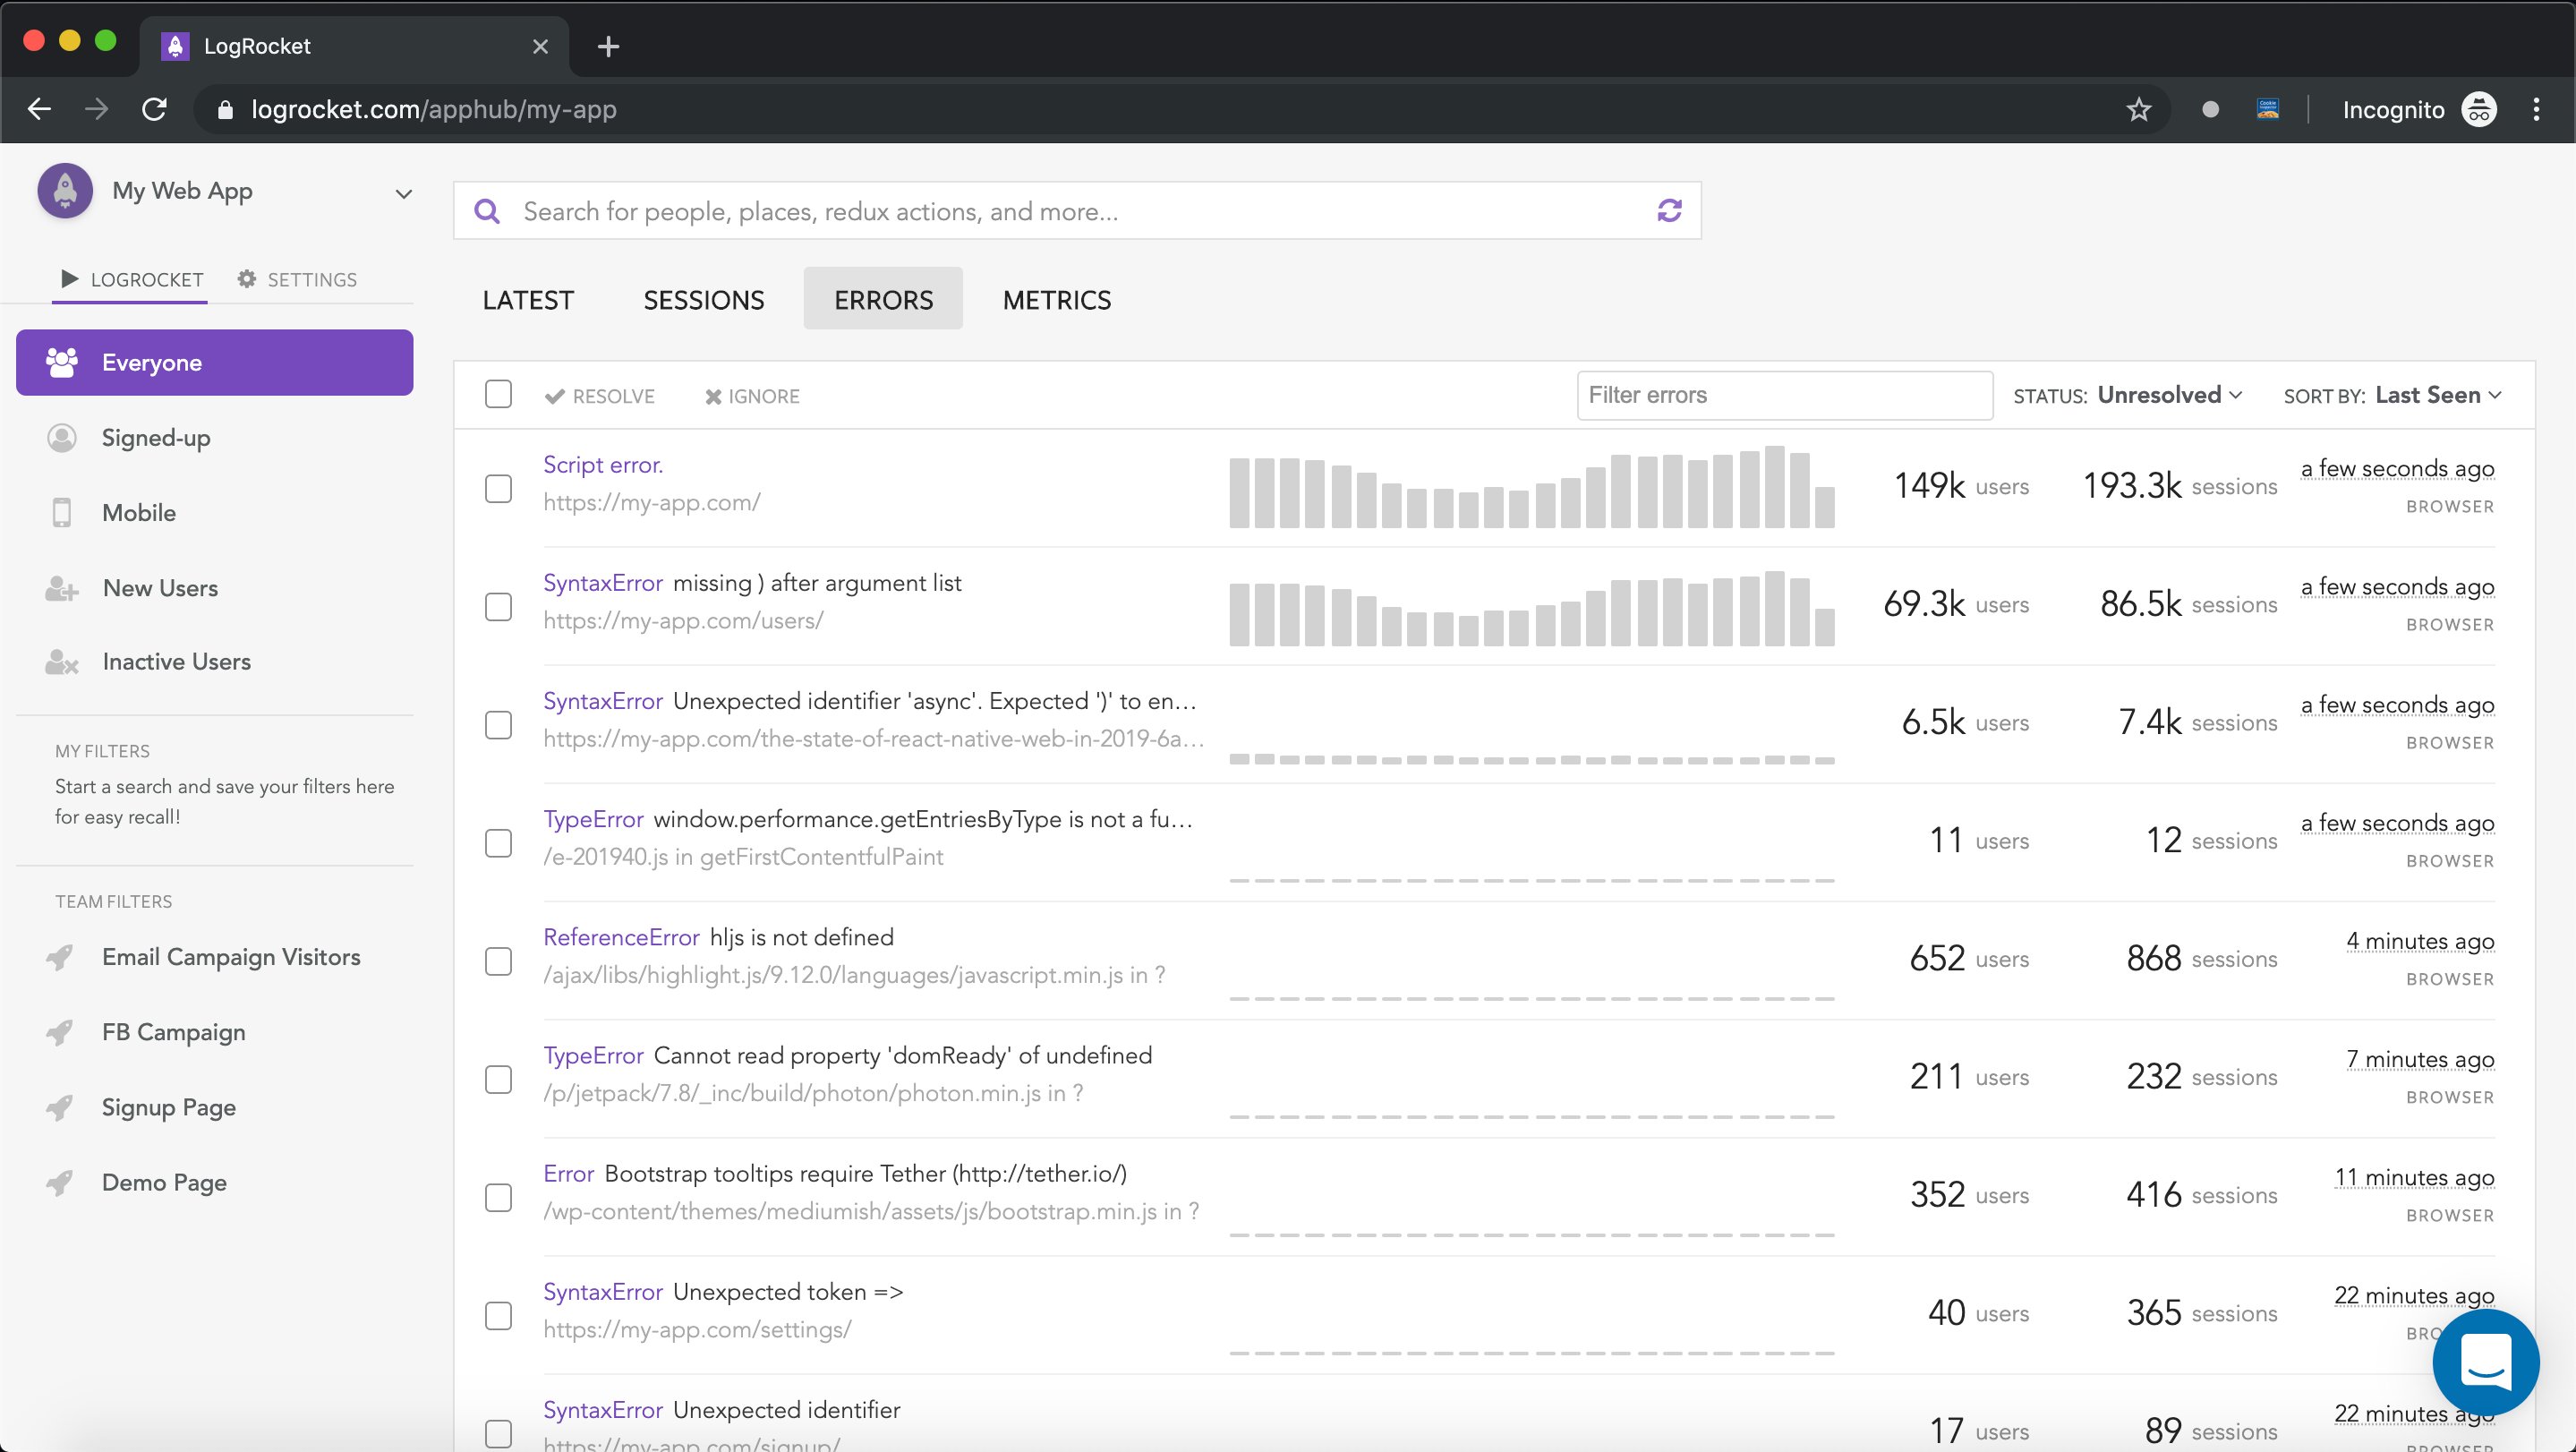
LogRocket works perfectly with any app, regardless of framework, and has plugins to log additional context from Redux, Vuex, and @ngrx/store. Instead of guessing why problems happen, you can aggregate and report on what state your application was in when an issue occurred. LogRocket also monitors your app’s performance, reporting metrics like client CPU load, client memory usage, and more.
Build confidently — start monitoring for free.

AI companies are buying developer tools as coding agents turn runtimes, package managers, and linters into strategic infrastructure.
Learn how AI-assisted development governance uses rules, agents, hooks, and protocols to help AI coding tools produce safer, more consistent code.

A step-by-step guide to building your first MCP server using Node.js, covering core concepts, tool design, and upgrading from file storage to MySQL.

Using security headers in your Next.js apps is a highly effective way to secure websites from common security threats.
Would you be interested in joining LogRocket's developer community?
Join LogRocket’s Content Advisory Board. You’ll help inform the type of content we create and get access to exclusive meetups, social accreditation, and swag.
Sign up now