Data visualization is a great way to present data and engage an audience. In comparison to raw data, excel sheets, or long lists of numbers, the human mind is typically better at remembering images. React and Google Charts, which are both built on JavaScript, can work together to enable developers to create engaging, reusable data visualizations like bar charts, pie charts, bubble plots, and more.

In this tutorial, we’ll learn how to use Google Charts with React. We’ll discuss why you should use Google Charts and demonstrate how to visualize different types of charts in React using Google Charts. We’ll cover the following in detail:
App.jsLet’s get started!
Google Charts is a free, modern, and actively-maintained JavaScript charting service from Google that is efficient and easy to use in your projects. Google Charts includes an extensive set of customization options as well as a rich chart gallery with many options to choose from, ranging from simple line graphs to more complex hierarchical tree maps. Google Charts includes a few chart types like Gantt charts, which can be hard to find in other chart libraries in my experience.
Google Charts is compatible with a lot of devices, unlike some other libraries, which are not so generous in this aspect. Google Charts has cross-browser compatibility and cross-platform capabilities, meaning that charts look nice both on desktop and mobile. Google Charts uses HTML and SVG, therefore no additional plugins are needed.
At 43kB minified and gzipped, Google Charts is small in comparison to other chart libraries like Chart.js, which is 117kB at the time of writing.
The best use case for Google Charts in my opinion would be when you quickly want to set up visualization on your website without needing to add lots of customization, or you have concern about the overall size of the shipped application. Now that we’re familiar with Google Charts, let’s learn how to set it up in our React application.
To use Google Charts in our React application, we’ll start by setting up a React app with the code below:
npx create-react-app react-google-chart
Once this code is finished running, change the working directory to the folder created from the previous command:
cd react-google-chart
react-google-charts packageThe react-google-charts package is a modern, well-maintained, thin, typed, React wrapper for Google Charts that makes it super easy for developers to use React with Google Charts:
npm install --save react-google-charts
Now, we’re all set to use Google Charts to visualize our data. Start the project to preview the app:
npm start
To begin designing the interface, open the project that was created with the text editor of your choice. Next, remove all the code inside the return method in the src/App.js file. The file should look similar to the code below:
import './App.css';
function App() {
  return (

  );
}
export default App;
The code above comes with the default placeholder rendered in the browser, so we’ll update it with our own content later in the tutorial. Next, to see Google Charts in action, we’ll create a simple chart. First, we create a new file called charts.js in the src directory where we’ll build our charts.
In the newly created file, we’ll recreate the example from the React Google Charts Pie Chart example, which is just a rework of the the main Google Charts Pie Example showing how to implement it using this package:
import { Chart } from "react-google-charts";
export const data = [
  ["Task", "Hours per Day"],
  ["Work", 11],
  ["Eat", 2],
  ["Commute", 2],
  ["Watch TV", 2],
  ["Sleep", 7],
];
export const options = {
  title: "My Daily Activities",
};

const charts = () => {
  return (
    <Chart
      chartType="PieChart"
      data={data}
      options={options}
      width={"100%"}
      height={"400px"}
    />
  )
}
export default charts
First, we import react-google-charts and get the Chart property. Next, we create a data variable that will house the data to be displayed on the pie chart. The pie chart is highly customizable; for a more complex chart, you only need to update the data to the array.
With <Chart />, you can pass props to update the data shown by the chart, as well as change the chart’s look and feel. The chartType prop allows you to change the type of chart being displayed. Therefore, if we passed Barchart instead, a bar chart would be displayed.
data accepts the data of the chart, and options accepts an object that we can further customize. We only changed the title for this example. Lastly, as their respective names imply, width and height change the dimensions of the chart.
Inside src/App.js, replace the content with the following:
import './App.css';
import Chart from './components/charts'
function App() {
  return (
    <div className="App">
    <Chart />
    </div>
  );
}
export default App;
With the code above, we simply imported and rendered the charts.js component.
Let’s see what we’ve built so far. Try running the server now. If everything goes well, you should see something similar to the image below:
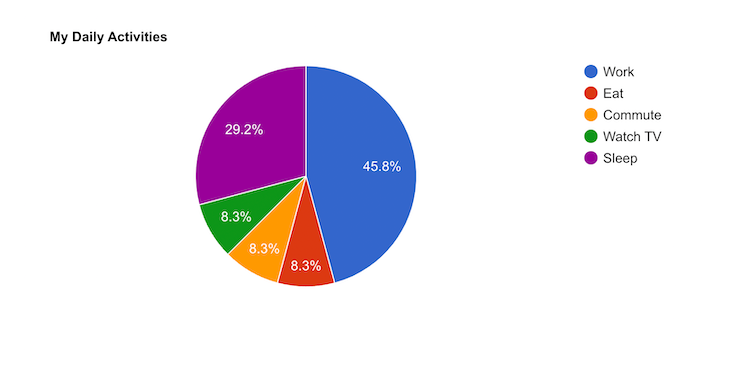
The chart is very interactive, and it was easy to generate with just a few lines of code.
Our previous example only covered a basic use case of quickly creating and displaying a chart. Let’s further expand on this example and see how it plays out in a more complex project with more components and a centralized data source.
To do so, we’ll use React Hooks to keep track of changes, then pass data down as props to components. You can apply the same approach when working with Redux or the Context API.
First, we’ll create a data.json file, which will house the data for the charts. In a real-world application, this data source would be from an API. Then, we’ll create a React useState Hook that keeps track of the data to be passed down to components. Finally, we’ll create a button that fetches this data and updates the Hook. Enough of the talk, let’s get to work!
Create a new file in the root of the project and name it data.json. Add the content below to it:
{
    "version": 1.0,
    "totalCharts": 32,
    "charts": [
        {
            "name": "Pie",
            "chartType": "PieChart",
            "data": [
                ["Task", "Hours per Day"],
                ["Work", 11],
                ["Eat", 2],
                ["Commute", 2],
                ["Watch TV", 2],
                ["Sleep", 7]
            ],
            "options":{
                "title": "I am pie"
            },
            "width": "100%",
            "height": "400px"
        },
        {
            "name": "Bar",
            "chartType": "BarChart",
            "data": [
                ["Task", "Hours per Day"],
                ["Work", 11],
                ["Eat", 2],
                ["Commute", 2],
                ["Watch TV", 2],
                ["Sleep", 7]
            ],
            "options":{
                "title": "I am a bar"
            },
            "width": "100%",
            "height": "400px"
        }
    ]
}
As explained earlier, the code above will be our data source.
App.jsNext, we’ll update the App.js file to include our Hook and also our button component. For that, we’ll create two states, one for storing chart data and one for toggling the visibility of the chart:
import React, { useState, useEffect } from 'react';

function App() {
  const [show, setShow] = useState(false);
  const [data, setData] = useState(false);
}
We’ll use the useEffect Hook to monitor changes to the show variable, after which we’d update the data variable accordingly using setData:
import React, { useState, useEffect } from 'react';
import response from "./data.json"

function App() {
  const [show, setShow] = useState(false);
  const [data, setData] = useState(false);
  useEffect(() => {
    if(show){
      setData(response)
    }
  }, [show]);
The data variable will be the response we get from the data.json file. We’re almost done with the changes. Next, we’ll focus on the components’ return method. We need to add buttons that toggle and show different content based on the show variable’s current value:
return (
    <div className="App">
      { show ?
      <span>
      <h2>Available charts</h2>
      <h5>Charts will be shown here!</h5>
      </span>
      :
      <h2>No charts available </h2>
      }
      <button onClick={() => setShow(!show)}>
      { show ? "Hide data" : "Fetch data" }
      </button>
    </div>
  );
Lastly, we’ll import the charts component and pass the required data to it as props. I’m only showing the required changes below. Later on, we’ll review the complete file:
....
import Chart from './components/charts'
....
 return (
    <div className="App">
      { show ?
      <span>
      <h2>Available charts</h2>
      { show && data && data.charts.map((chartData, i) => (
        <Chart chart={chartData} key={i}/>
      ))}
       .....
  );
We use a map function to loop through the data, pass each chart object as a prop, and show the resulting chart. The complete App.js file would look like the code below. I also added back the App.css file for some basic styling:
import React, { useState, useEffect } from 'react';
import './App.css';
import response from "./data.json"
import Chart from './components/charts'
function App() {
  const [show, setShow] = useState(false);
  const [data, setData] = useState(false);
  useEffect(() => {
    if(show){
      setData(response)
    }
  }, [show]);
  return (
    <div className="App">
      { show ?
      <span>
      <h2>Available charts</h2>
      { show && data && data.charts.map((chartData, i) => (
        <Chart chart={chartData} key={i}/>
      ))}

      </span>
      :

      <h2>No charts available </h2>
      }
      <button onClick={() => setShow(!show)}>
      { show ? "Hide data" : "Fetch data" }
      </button>
    </div>
  );
}
export default App;
Lastly, in the App.js file, we passed a chart prop to the charts component. Therefore, we need to update the charts component to use the prop:
import { Chart } from "react-google-charts";
const charts = (prop) => {
  return (
    <Chart
      chartType={prop.chart.chartType}
      data={prop.chart.data}
      options={prop.chart.options}
      width={prop.chart.width}
      height={prop.chart.height}
    />
  )
}
export default charts
Let’s see what our chart looks like. If you shut down the server, go ahead and run it again. When you view it in a browser, you should see something similar to the images below:

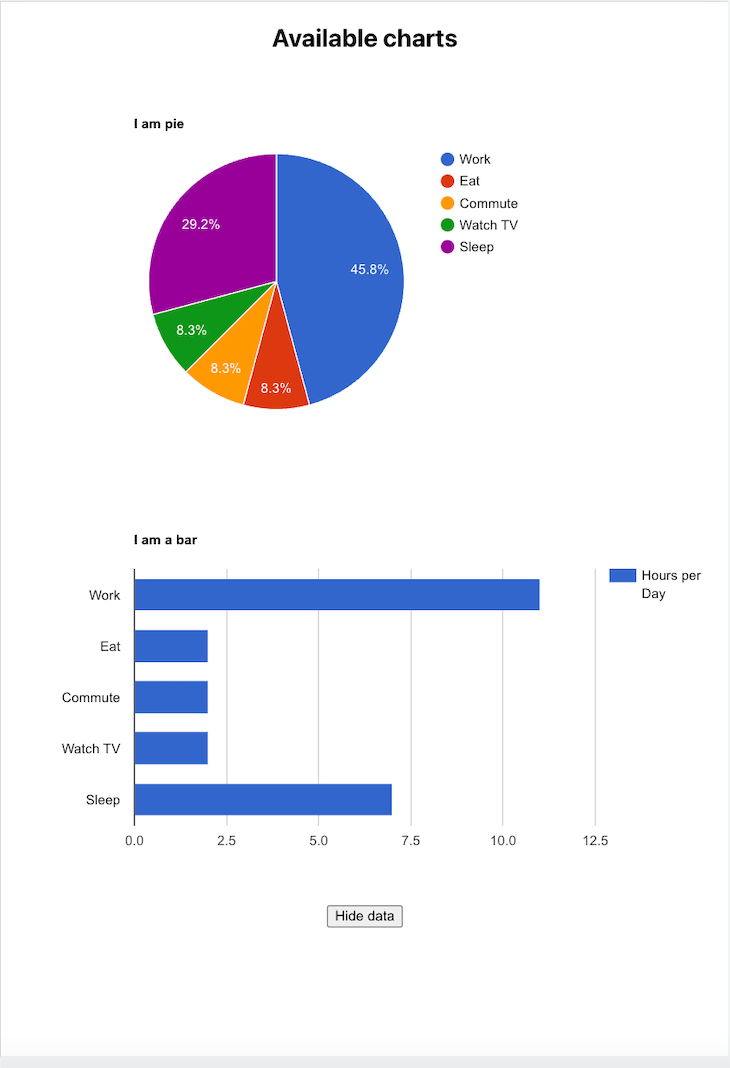
In this tutorial, we learned how to use Google Charts with React. We also further expanded our knowledge by seeing various approaches we could take to build complex applications using both React Hooks and the react-google-charts package. For more detailed documentation, you should visit the Google Chart documentation page. I hope you enjoyed this article, and happy coding!
Install LogRocket via npm or script tag. LogRocket.init() must be called client-side, not
server-side
$ npm i --save logrocket

// Code:

import LogRocket from 'logrocket';
LogRocket.init('app/id');
// Add to your HTML:

<script src="https://cdn.lr-ingest.com/LogRocket.min.js"></script>
<script>window.LogRocket && window.LogRocket.init('app/id');</script>
Hey there, want to help make our blog better?
Join LogRocket’s Content Advisory Board. You’ll help inform the type of content we create and get access to exclusive meetups, social accreditation, and swag.
Sign up now
Not sure if low-code is right for your next project? This guide breaks down when to use it, when to avoid it, and how to make the right call.

Compare Firebase Studio, Lovable, and Replit for AI-powered app building. Find the best tool for your project needs.
Discover how to use Gemini CLI, Google’s new open-source AI agent that brings Gemini directly to your terminal.

This article explores several proven patterns for writing safer, cleaner, and more readable code in React and TypeScript.