Node.js monitoring is crucial to helping maintain the stability, dependability, and performance of your applications. You can rapidly spot any problems that might be harming the performance of your app by keeping an eye on crucial indicators like resource usage, error detection, and response times.
Identifying and resolving issues before they escalate will help you avoid downtime or data loss. Monitoring your Node.js application is key to preserving its stability and health and maintaining a positive user experience.
There are a number of Node.js monitoring tools available, each with a different set of features and functionalities. In this article, we’ll introduce the top 6 tools for Node.js monitoring:
These tools are all full monitoring solutions and include real-time performance tracking, error reporting, and analysis.
Let’s dive right in!
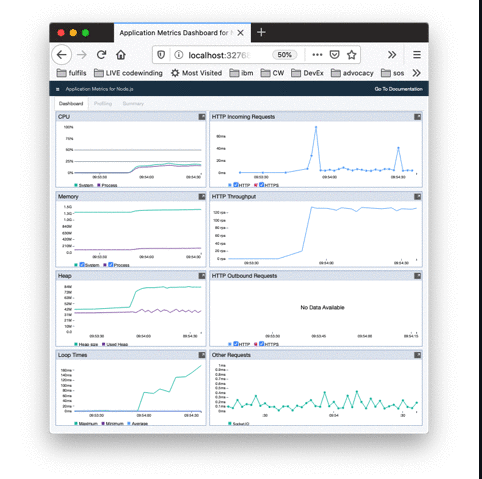
AppMetrics is a monitoring tool for Node.js applications, providing real-time monitoring and data analysis. It allows developers to track important metrics such as response times, error rates, and resource utilization, providing valuable insights into the performance and behavior of their applications.
To install AppMetrics, run the following command:
npm install appmetrics-dash
Then, add the below code snippet to the very beginning of the primary JavaScript source file (e.g., app.js) to create a dashboard for all HTTP servers generated by your application:
require ('appmetrics-dash').attach()
By default, this will establish a new dashboard server with route /appmetrics-dash and port 3001.
The following data will be displayed in the dashboard:
In addition, AppMetrics enables you to build a Node.js report and Heap snapshots directly from its dashboard.
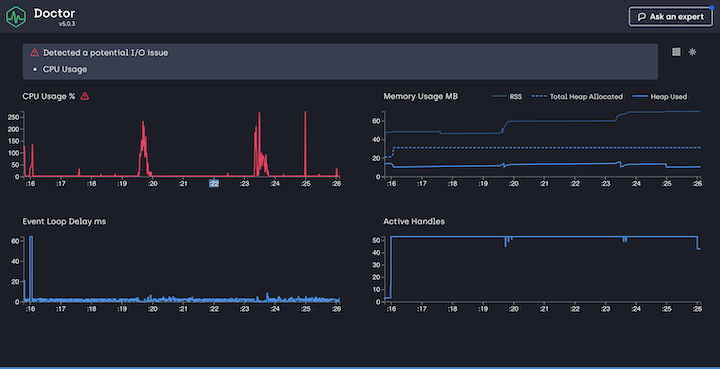
Clinic.js is a Node.js monitoring tool that offers four sub-tools to assist in identifying and resolving performance issues with Node.js applications. To use Clinic.js in your application, install the module:
npm install clinic -g
Once installed, you’ll get to choose any of the below four sub-tools to generate reports:
Clinic.js Doctor identifies the root cause of the app’s performance issues. Its features include:
Clinic.js Bubbleprof is an entirely unique tool for profiling your Node.js code. It offers the following features:
async_hooksClinic.js Flame uses flamegraphs to identify bottlenecks and hot paths in your code. Here are its features:
Clinic.js HeapProfiler uses flamegraphs to reveal memory allocations by functions. It’s features include:
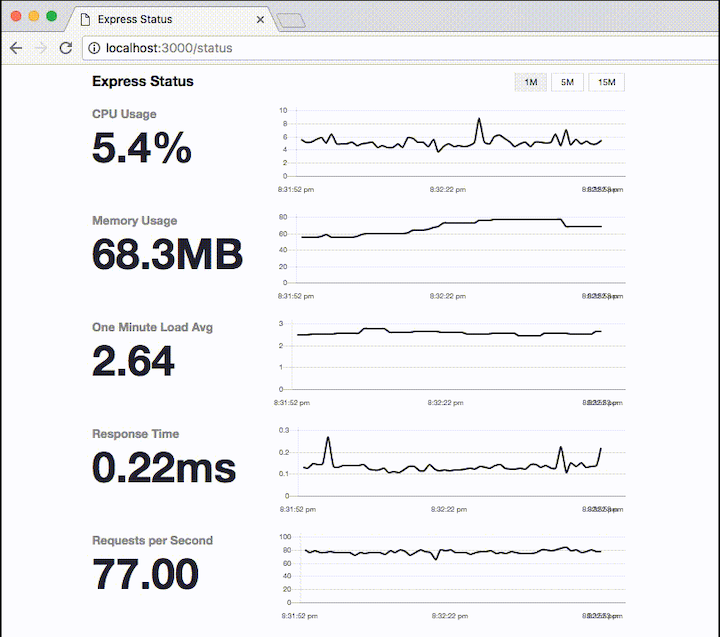
Express Status Monitor is a Node.js monitoring tool developed primarily for the Express.js framework, which is the go-to option for creating Node applications. It is an easy-to-use, self-hosted module that reports real-time server performance metrics for Express-based Node servers via a /status route with the aid of Socket.io and Chart.js.
Install Express Status Monitor with npm by running the following command:
npm install express-status-monitor
Next, add the below code before any other middleware or router:
app.use(require('express-status-monitor')())
Now, run your server and navigate to the /status route to monitor your Node application.
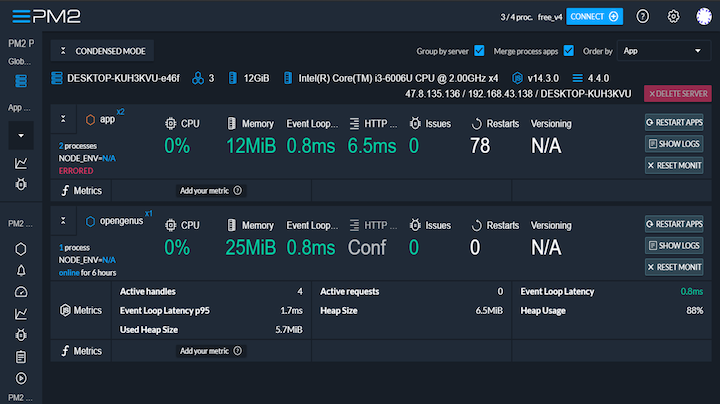
PM2 is a Node.js monitoring tool that enables the monitoring of Node.js application performance in production. It allows you to keep your application running forever, reload without downtime, and facilitate common system admin tasks.
With PM2, you can run applications in cluster mode. Use the following command to install the PM2 module:
npm install pm2 -g
You can daemonize your app by running the application source file (e.g., app.js), like so:
pm2 start app.js
Your application is now being monitored and will be kept running forever.
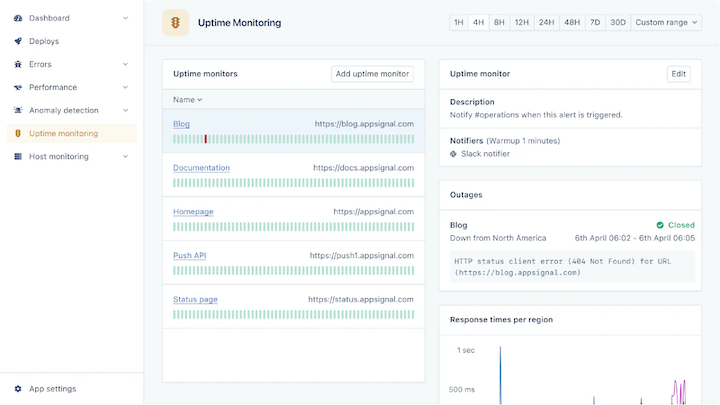
AppSignal is another Node.js monitoring tool. It provides the following features:
To install AppSignal to your application, run the following command:
npm install --save @appsignal/nodejs
Then, create an appsignal.cjs file to require and configure AppSignal. This file may also be placed in another location, like in the src/ directory:
// appsignal.cjs
const { Appsignal } = require("@appsignal/nodejs");

new Appsignal({
  active: true,
  name: "<YOUR APPLICATION NAME>",
  pushApiKey: "<YOUR API KEY>", // Note: renamed from `apiKey` in version 2.2.5
});
Now, you can run your application like you normally would, but use the --require flag to load AppSignal’s instrumentation before any other library:
node --require './appsignal.cjs' index.js
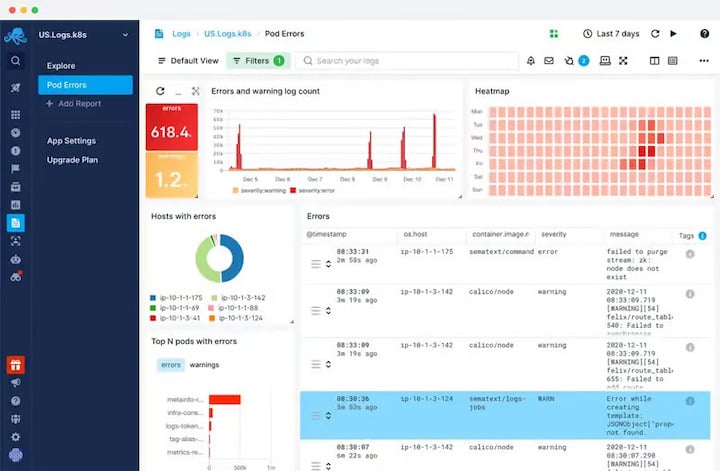
Sematext is a Node.js tool that provides a platform for log analytics, infrastructure management, and performance monitoring. It offers real-time analysis of application, infrastructure, and cloud service logs and performance metrics. Additionally, it provides a centralized area for storing and analyzing log data, making it easier for teams to identify and fix problems.
To install Sematext, run the following command:
npm install spm-agent-nodejs
Then create an .env file and write the following code:
MONITORING_TOKEN=<your-monitoring-token-goes-here>
INFRA_TOKEN=<your-infra-token-goes-here>
Require it at the top of your main file, like so:
// start agent
require('spm-agent-nodejs')
Now, run the following code:
# Terminal
node app.js
Maintaining the stability and performance of your Node.js application requires a robust monitoring solution. In this article, we identified six tools — AppMetric, Clinic.js, Express Status Monitor, PM2, AppSignal, and Sematext — that offer a variety of options to suit the particular requirements of your Node.js application.
The proper monitoring tool can help you rapidly identify and address any problems, improving user experience and enhancing app reliability.
 Monitor failed and slow network requests in production
Deploying a Node-based web app or website is the easy part. Making sure your Node instance continues to serve resources to your app is where things get tougher. If you’re interested in ensuring requests to the backend or third-party services are successful, try LogRocket.
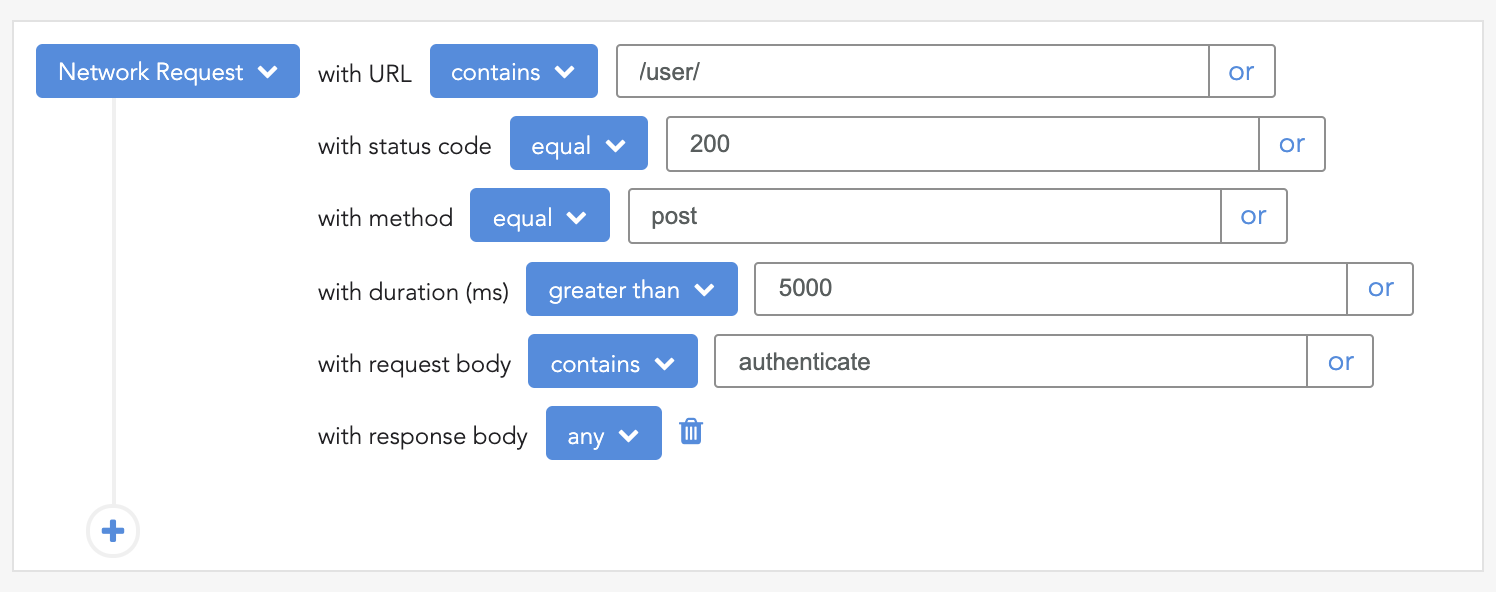
LogRocket lets you replay user sessions, eliminating guesswork around why bugs happen by showing exactly what users experienced. It captures console logs, errors, network requests, and pixel-perfect DOM recordings — compatible with all frameworks.
LogRocket's Galileo AI watches sessions for you, instantly identifying and explaining user struggles with automated monitoring of your entire product experience.
LogRocket instruments your app to record baseline performance timings such as page load time, time to first byte, slow network requests, and also logs Redux, NgRx, and Vuex actions/state. Start monitoring for free.
Would you be interested in joining LogRocket's developer community?
Join LogRocket’s Content Advisory Board. You’ll help inform the type of content we create and get access to exclusive meetups, social accreditation, and swag.
Sign up now
Not sure if low-code is right for your next project? This guide breaks down when to use it, when to avoid it, and how to make the right call.

Compare Firebase Studio, Lovable, and Replit for AI-powered app building. Find the best tool for your project needs.

Discover how to use Gemini CLI, Google’s new open-source AI agent that brings Gemini directly to your terminal.
This article explores several proven patterns for writing safer, cleaner, and more readable code in React and TypeScript.
One Reply to "Top 6 tools for Node.js monitoring"
One of my favorites at the moment is this platform https://github.com/traceo-dev/traceo, he is still in development but the UI and the ability to collect not only errors from the software but also logs or metrics is impressive