
Even though we have faster computers and mobile devices today, we as developers should think about the audience we are building the product for as a whole. Not everybody has access to the same type of fast device or is on the fastest internet network. So we need to have a broader look at performance problems. Performance can be pursued in many different ways, but for this article, we will focus on frontend performance. We look at this aspect more closely and offer suggestions for possible improvements in this area.

The Replay is a weekly newsletter for dev and engineering leaders.
Delivered once a week, it's your curated guide to the most important conversations around frontend dev, emerging AI tools, and the state of modern software.
Frontend performance optimization is critical because it accounts for around 80-90% of user response time. So when a user is waiting for a page to load, around 80-90% of the time is due to frontend related code and assets. The below illustrations shows the ratio of frontend/backend assets to be loaded for LinkedIn.
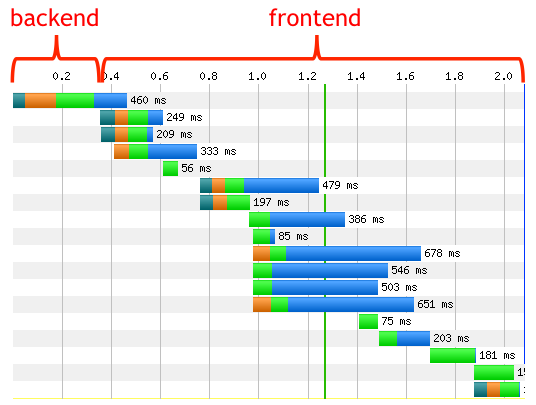
A large part of frontend loading time is spent on executing JavaScript files as well as rendering the page. But a critical part for improving the frontend performance is to reduce the JavaScript bundle size that should be downloaded via the network. The lower the size of the JavaScript bundle, the faster the page can be available to the users.
If we look at historical data, we can see that JavaScript files were on average 2KB in 2010. But with the evolution of JavaScript, the introduction of new JavaScript libraries, like Angular or React, and with the concept of single-page applications, the average JavaScript asset size has increased to 357KB in 2016. We need to use these new technologies for better solutions. But we also need to consider possible ways for improving their performance by doing things like reducing overall JavaScript bundle size. But before diving into that topic, we need to get familiar with JavaScript bundles. What are they exactly?
Your frontend application needs a bunch of JavaScript files to run. These files can be in the format of internal dependency like the JavaScript files you have written yourself. They can also be external dependencies and libraries you use to build your application like React, lodash, or jQuery. So in order for your page to load up the first time, these JavaScript files need to be accessible to the application. So how do we expose them?
In the past, the way of exposing JavaScript files was much more straightforward. Most of the web pages did not need many JavaScript assets. Since we did not have access to a standard way of requiring dependencies, we had to rely on using global dependencies. Imagine that we needed both jQuery as well as a main.js and other.js which hold all of our application JavaScript logic. The way we were able to expose these dependencies looked something like this:
<script src="/js/main.js"></script>
<script src="/js/other.js"></script>
<script src="//code.jquery.com/jquery-1.12.0.min.js"></script>
This was an easy solution for this problem but quickly got out of hand when scaling the application. For example, if main.js changes in a way that depends on the code in other.js, we need to reorder our script tags like this:
<script src="/js/other.js"></script>
<script src="/js/main.js"></script>
<script src="//code.jquery.com/jquery-1.12.0.min.js"></script>
As we can see, managing such a code structure at scale would quickly become a mess. But after a while, there were better solutions for managing this in applications. For example, if you were using NodeJS, you could have relied on NodeJS’s own module system (based on commonJS spec). This would allow you to use the require function for requiring dependencies. So in a Node environment, our above code snippet would look something like this:
<script>
  var jQuery = require('jquery')
  var main = require('./js/main')
  var other = require('./js/other')
</script>
Nowadays, you do not have just a couple of JavaScript files to run your application. The JavaScript dependencies for your application can include several hundred or thousands of files and it is clear listing them like the above snippet is not possible. There are several reasons for this:
require is synchronous, but we want it to be asynchronous and to not block the main thread if the asset is not already downloadedSo the best approach seems to be putting all of the JavaScript code into a single JavaScript file and handling all the dependencies within that. Well, that is the basic job of a JavaScript bundler. Although different bundlers can have different strategies for doing this. Let us explore this a bit further and see how a bundler achieves this. Then we’ll see if there are extra improvements we can make to achieve a smaller bundle size and hence more performance. For the purpose of this article, we will use Webpack as a bundler, which is one of the most famous options out there.
Let’s start by setting up a simple Webpack project. We are going to use the basic packages for kickstarting a simple web application project. React, ReactDOM as UI framework, SWC as a faster alternative to Babel for transpilation, as well as a series of Webpack tools and loaders. This is what ourpackage.json will look like:
// package.json

{
  "name": "project",
  "version": "1.0.0",
  "main": "index.js",
  "scripts": {
    "test": "echo \"Error: no test specified\" && exit 1",
    "build": "rm -rf ./dist && webpack",
    "start": "webpack-dev-server"
  },
  "keywords": [],
  "author": "",
  "license": "MIT",
  "devDependencies": {
    "@swc/core": "^1.1.39",
    "css-loader": "^3.4.0",
    "html-loader": "^0.5.5",
    "html-webpack-plugin": "^3.2.0",
    "sass-loader": "^8.0.0",
    "style-loader": "^1.1.1",
    "swc-loader": "^0.1.9",
    "webpack": "^4.41.4",
    "webpack-cli": "^3.3.10",
    "webpack-dev-server": "^3.10.1"
  },
  "dependencies": {
    "react": "^16.12.0",
    "react-dom": "^16.12.0",
    "regenerator-runtime": "^0.13.5"
  }
}
We are also going to need a webpack.config.js which is the config entry point for our Webpack commands. There are several options in this file, but let’s clarify a few of the important ones:
mode— This is an option for Webpack to know if it should do any optimization, based on the option it is passed to. We will discuss this further lateroutput— This option tells Webpack where it should load or put assembled bundles at a root level. It takes both the path as well as file nameHTMLWebpackPlugin — This option helps us to make serving our HTML files with Webpack bundle easierloaders— These loader add-ons help you transform most of the modern coding language features into understandable code for all browsers// global dependencies
const path = require('path');
const HTMLWebpackPlugin = require("html-webpack-plugin");
module.exports = {
mode: "production",
// DOC: https://webpack.js.org/configuration/output/
output: {
path: path.resolve(__dirname, './dist'),
filename: 'index_bundle.js'
},
// DOC: https://webpack.js.org/configuration/dev-server/
devServer: {
contentBase: path.join(__dirname, 'dist'),
compress: true,
port: 9000
},
module: {
rules: [
{
test: /\.jsx?$/ ,
exclude: /(node_modules|bower_components)/,
use: {
// `.swcrc` in the root can be used to configure swc
loader: "swc-loader"
}
},
{
test: /\.html$/,
use: [
{
loader: "html-loader",
options: { minimize: true }
}
]
},
{
test: /\.scss/i,
use: ["style-loader", "css-loader", "sass-loader"]
}
]
},
plugins: [
// DOC: https://webpack.js.org/plugins/html-webpack-plugin/
new HTMLWebpackPlugin({
filename: "./index.html",
template: path.join(__dirname, 'public/index.html')
})
]
};
Now, it is time to get some initial measurements in place for our Webpack build. When Webpack does the compilation, we need some sort of statistics on the built modules, compilation speed, and the generated dependency graph. Webpack already offers us the tools to get these statistics, by running a simple CLI command:
webpack-cli --profile --json > compilation-stats.json
By passing the --json > compilation-stats.json, we are telling Webpack to generate the build statistics and dependency graph as a json file with our specified name. By passing the --profile flag, we get more detailed build statistics on individual modules. After running this command, you get a json file, including a lot of useful information. But to make things easier, we are going to use a recommended tool that will visualize all of these build statistics. All you need to do is to drag the compilation-stats.json into the specified section in this official analysis tool. After doing this, we get the following results.
We get the following table with general info about Webpack build analysis:
| Version of Webpack used for the compilation | 4.43.0 |
|---|---|
| Compilation specific hash | a770d6c609235bbb24fe |
| Compilation time in milliseconds | 522 |
| Number of modules | 8 |
| Number of chunks | 1 |
| Number of assets | 2 |
If we click on the dependency section, we get a similar diagram and a table that shows different dependencies in our application, detailed information about each dependency, and how they are connected to each other.
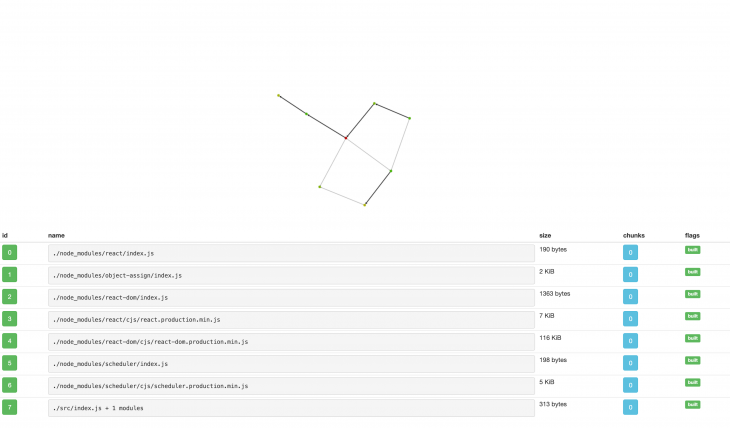
Now, these build statistics are very useful, but since we are going to solely focus on slimming down and optimizing our bundle size, we will use a specialized Webpack tool called webpack-bundle-analyzer. This tool will allow you to visualize the size of Webpack output files and show you an interactive zoomable treemap. Let’s set it up for our project. The first thing is to install the package:
npm install --save-dev webpack-bundle-analyzer
The next thing we need to do is to set the related config in webpack.config.js file:
const BundleAnalyzerPlugin = require('webpack-bundle-analyzer').BundleAnalyzerPlugin;

module.exports = {
  plugins: [
    new BundleAnalyzerPlugin()
  ]
}
Now all you have to do is to hook a script in your package.json for running the analyzer:
"scripts": {
  "bundle-report": "webpack-bundle-analyzer --port 4200 compilation-stats.json"
}
So after running npm run-script bundle-report, we get a visual representation of what is inside our bundle and see which of them are taking most of the size. Here is how this looks for our project:
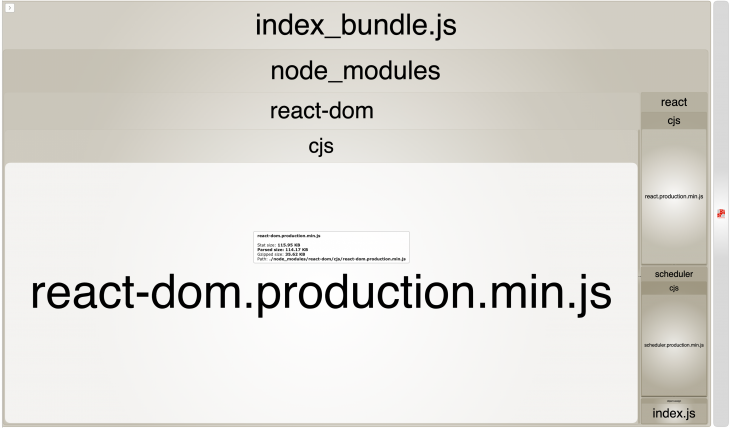
So as we can see, React dependencies are taking up most of the bundle size. Let’s see if there is anything we can do about that, to help us slim down our total bundle size.
This strategy for bundle optimization and slimming down total bundle size is easy and straightforward. Webpack has a production flag (-p) that does few optimizations out of the box. So if we run our build script with the below command, we should get some optimization:
// via command-line
 webpack-cli -p

// via package.json script
"scripts": {
  "build": "rm -rf ./dist && webpack -p",
},
After running this, we can see that our bundle size will decrease from 970KB to 128KB. But how did Webpack manage this drastic optimization with such a simple command? Well, there are mainly two reasons for this:
NODE_ENV to production. This way, some packages like React will not include debugging codeThat is a good step towards slimming down our bundle size and reducing load time for users. Let’s see what else we can do.
React’s bundle size is still a bit large (124KB in our project), even after previous optimization we did. In checking the webpack-bundle-analyzer report, we can see that React has taken a significant amount of our bundle size. So we are going to consider replacing it with a lighter version of React called preact with only 3KB size.
When we install this package as a dependency, we get both React API’s core and DOM support; and as an extra step, we can install preact-compat as a compatibility layer for React with 2KB size. This way, we can just use preact as a drop-in replacement for React in our project. Preact is more performant than React, as we can see in the below performance comparison between different libraries that were used to build a simple “To Do” MVC benchmark:
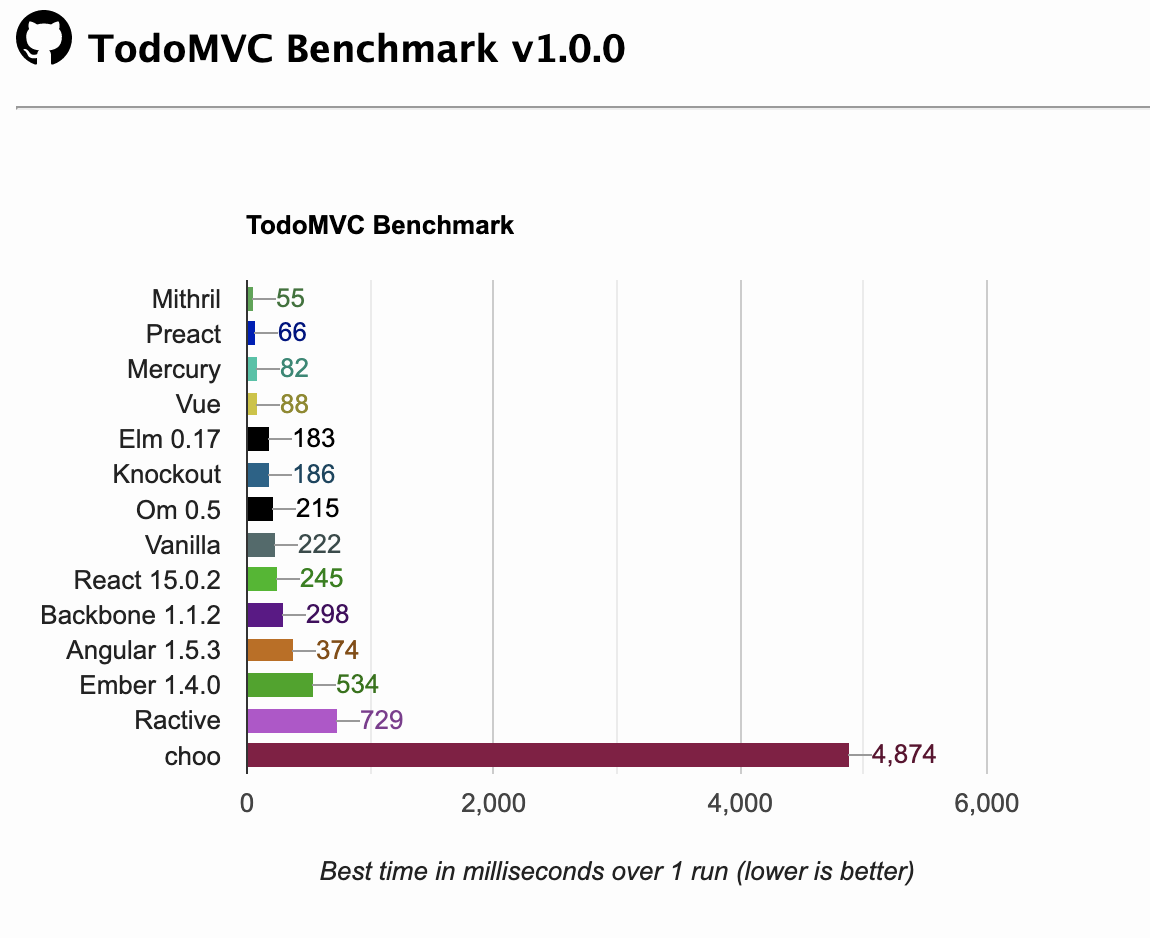
So now, we are going to install Preact for our project and see how it affects our bundle size. We first install preact and preact-compat:
npm install preact preact-compat
And then we only need to set alias config in wepack.config.js, to make the compatibility of this library with all of your React code work:
// webpack.config.js

resolve: {
  alias: {
    "react": "preact-compat",
    "react-dom": "preact-compat"
  }
},
So after this is set up and running our npm run-script bundle-report, we get the following bundle analysis. In this interactive diagram, we can see that React related bundle sizes now shrink to around 23KB compared to what it was before as 124KB. That is a great reduction in bundle size for us:
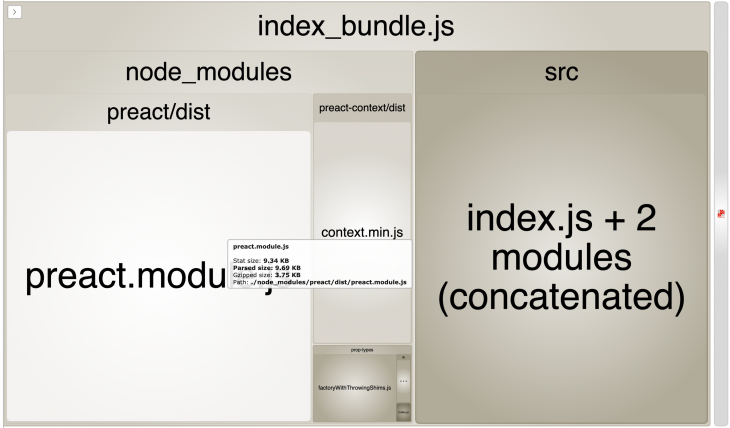
Using the webpack-bundle-analyzer allows us to visually see the packages that are installed in our application. If a package has taken a lot of space, we might consider strategies like replacing it with a lighter version library (like we did above).
So far, we were able to reduce the size of our bundle from 970Kb to 23KB, which is a 42X decrease in our bundle size. Also, remember that our project structure and dependencies were small but taking an initiative in slimming down bundle size for bigger and more complicated projects can be more beneficial.
Here are some potential next steps you can take to decrease your bundle size and load time and increase performance.
Install LogRocket via npm or script tag. LogRocket.init() must be called client-side, not
server-side
$ npm i --save logrocket

// Code:

import LogRocket from 'logrocket';
LogRocket.init('app/id');
// Add to your HTML:

<script src="https://cdn.lr-ingest.com/LogRocket.min.js"></script>
<script>window.LogRocket && window.LogRocket.init('app/id');</script>

Local AI proxy tutorial for detecting, masking, and rehydrating PII before prompts reach cloud LLMs.

Learn how Graph RAG uses connected knowledge structures to improve retrieval beyond simple text similarity.

Learn how sibling-index() enables clean, JavaScript-free stagger animations using native CSS.

useEffect breaks AI streaming responses in ReactSee why useEffect breaks AI streaming in React, and how moving stream state outside React fixes flicker and stale updates.
Hey there, want to help make our blog better?
Join LogRocket’s Content Advisory Board. You’ll help inform the type of content we create and get access to exclusive meetups, social accreditation, and swag.
Sign up now