The Graph is one of the most compelling new Web3 technologies to grow in 2021, offering promises of being the next decentralized Google.
A network of incentivized players help curate, sort, secure, and source data to make it all available via a universally accessible API that is tracked per query and made available to developers around the world.
In this guide, we’ll review four major roles in The Graph. But if you already feel comfortable with the basics, feel free to jump straight to the tutorial part.
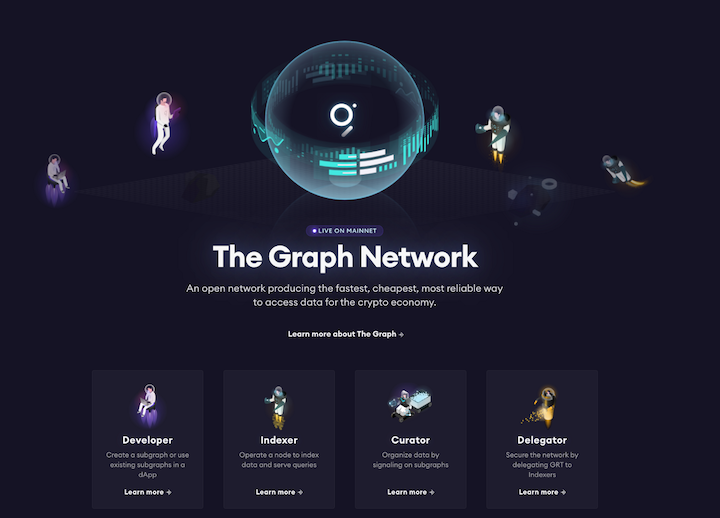
The Graph’s mission statement revolves around serving data from the blockchain to app developers in a fast, efficient, reliable, and, most importantly, decentralized way.
There are four major roles participants in the network can play to enable this search infrastructure to run:
Here’s the plan; we’ll explain in more detail below:
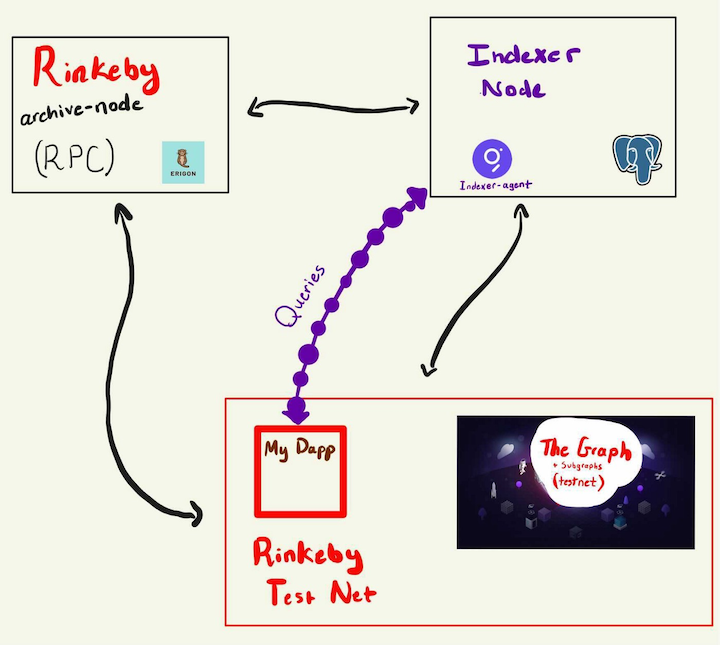
Let’s remind ourselves what we’re doing here: serving queries on blockchain data. This means we need to have an API running and a data source.
Formally, our API will be running with the indexer software from The Graph, wrapped in a nice docker-compose by trader-payne on GitHub. Postgres will also be running on the Indexer, part of docker-compose, among a few other prepackaged utilities, such as InfluxDB.
Our Indexer will talk to an archive node we set up on the Rinkeby test network for Ethereum to provide up-to-date data on the latest blocks on that blockchain. This way, developers can deploy subgraphs to The Graph’s test network on Rinkeby and those subgraphs can be picked up by our Indexer node.
Information from those subgraphs will be stored in Postgres so that queries coming from Rinkeby DAaps can quickly grab information from us, the Indexers, to run their services. When I first set this up, I ran the Rinkeby archive on an old laptop and my Indexer on an old PC.
Let’s get everything set up.
We’ll use Erigon to scan the blockchain and run 24/7 to keep our datastore of blocks up to date. You will need at least 400GiB of SSD storage available.
To follow this tutorial, you should have Docker installed. However, it is not required if you want to just use bare metal your own way because Erigon is written in Go.
Once you have a node/computer ready to go with the required storage, clone the Erigon repo with the following command:
git clone — recurse-submodules -j8 https://github.com/ledgerwatch/erigon.git
Next, cd into the directory and build the binary:
cd erigon
make erigon
Normally, Erigon will store all the blockchain data in ~/.local/share/erigon. If you want to change this, export the environment variable XDG_DATA_HOME to your preferred directory.
We should now be able to run Erigon on our machine. We will run it in Docker, though, since the repo comes with a prebuilt, beautiful docker-compose that ships with a Grafana dashboard.
Before we do that, we need to tell Erigon to scrape the Rinkeby chain instead of the Main Ethereum chain and tell the RPC client that our Indexer talks to that it should look for a Rinkeby set of data, not Ethereum.
To do this, do the following in docker-compose.yml :
— chain rinkeby to the end of the command for the erigon servicerpcdaemon service, set the volumes line to ${XDG_DATA_HOME:-~/.local/share}/erigon/rinkeby:/home/erigon/.local/share/erigon. As you can see, we added /rinkeby to the path, telling the RPC client to look for a Rinkeby chain folder instead of the default Main network folderOnce those items have been added, fire it up with docker-compose up -d. You should then be able to visit localhost:3000 and see a dashboard of the sync progress.
Ah, yes — behold the beauty:
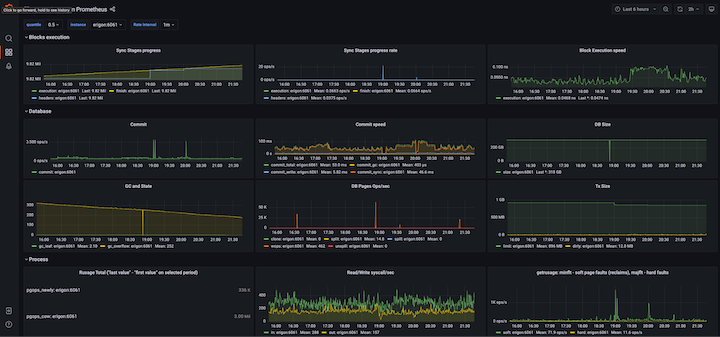
This might take between an hour and a day to complete; be patient and wait for the DB size to flatline.
While this is syncing, you should do one more thing: get an Ethereum Main Network RPC endpoint.
Yes, I know we just did all that work spinning up and endpoint for Rinkeby. But we need one for Ethereum Main Network as well to interact with the Graph on mainnet.
Ethereum nodes are much heavier to run, so let’s use Infura for the light amount of calls we will need, since it is free.
Head over to the official Infura website, create an account, make an Ethereum Mainnet Node, and be ready to copy the connection info from Project Settings in a moment.
For the Indexer to interact with Rinkeby network smart contracts, it needs a wallet to hold and sign transactions with. If you don’t already have MetaMask, install the browser extension here.
Head here to generate a 15-word phrase if you need one. At the bottom of the page, you will see a few private key pairs tied to that phrase. Copy one of those private keys (make note of the public key beginning with 0x!) and import it to MetaMask.
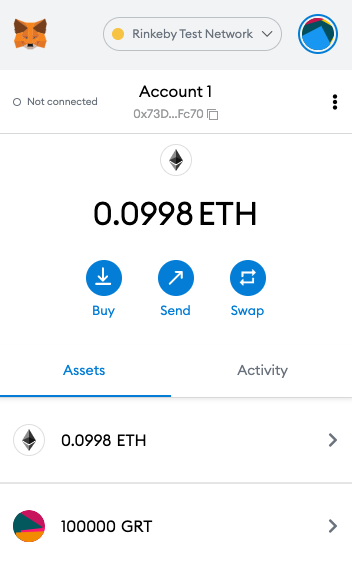
In MetaMask, make sure you are on the Rinkeby Test Network. You will need some practice Ethereum, which you can grab here. If that faucet is down, try here.
You will also need some practice GRT tokens. You can get these by hopping in the Graph’s Discord Channel and requesting GRT with !grt [address] in the #testnet-faucet channel.
Look, I’m rich now!
Once we have our tokens ready for the Indexer, let’s pull down the docker-compose stuff and input our settings:
git clone https://github.com/StakeSquid/graphprotocol-testnet-docker
Next, you need a domain name that you can point at your Indexer’s IP address for SSL generation. I used GoDaddy, but you can also use FreeNom for a free 12-month name — pretty neat! You will want to register three subdomains under your domain:
Now that you have the code downloaded, your domain set up, your wallet with coins, and your Rinkeby and Mainnet RPC nodes available, let’s input our Indexer settings, which are located in the the file start:
EMAIL=your@email \
INDEX_HOST=index.[my-domain] \
QUERY_HOST=query.[my-domain] \
GRAFANA_HOST=dashboard.[my-domain] \
ADMIN_USER=paul \
ADMIN_PASSWORD=some_password \
DB_USER=arbitrary \
DB_PASS=also_arbitrary \
GRAPH_NODE_DB_NAME=arbitrary \
AGENT_DB_NAME=arbitrary \
MAINNET_RPC_0="[INFURA RPC ENDPOINT]" \
MAINNET_RPC_1="[THE SAME INFURA RPC ENDPOINT]" \
RINKEBY_RPC="[http://your.rinkeby.node.adress]" \
OPERATOR_SEED_PHRASE="[pneumonic for your wallet we set up]" \
STAKING_WALLET_ADDRESS=[wallet address] \
GEO_COORDINATES="69.69 69.69" \
Now it’s finally time to start this all up — how exciting! Hit the big green button by running bash start.
Note that you will see a lot of red during this process. That’s OK — buy the dip and hold, as they say. Let it run; it will take a little while, but things will finish and soon you will smile.
Once the red is away and things look green, we can check the status of our Indexer deployment by entering the shell, ./shell cli.
Then, ask the indexer for its status by polling its current rules:
graph indexer rules get all
If this command succeeds, you have succeeded!
Now that we have the Indexer running, we should give it some subgraphs to actually work off of.
First, you should find a subgraph that you think will be worth your while from the Graph’s subgraph explorer. Note the IPFS hash of this subgraph.
IPFS is a decentralized object file store, sort of like S3. Subgraph code is stored here and we can pull it via its unique hash, which is what we are referring to when we mention a subgraph’s hash. Read more about the game-changing IPFS network.
Next, hop over to your Indexer in the ./shell cli tool and run this command to allocate 1000 $GRT to this Subgraph:
graph indexer rules set {IPFS_HASH} allocationAmount 1000 decisionBasis always
If you want to check on your allocations at any given time, you can do so with graph indexer rules get {IPFS_HASH}.
The graph Indexer has a variety of ways to assign it subgraphs to index, and you can do things such as only pick up a subgraph if it has a certain Curator Signal. Or, you could do things such as allocate 1,000 $GRT to subgraph X and 1,000 $GRT to subgraph Y. You can read more about the Indexer CLI.
Congratulations — you just spun up a Graph Rinkeby Network Indexer Node! Now is a great time to get familiar with the logs, the CLI, and ask questions in the discord before making it over to Mainnet. Happy Indexing!
As a final note on our Graph review, we should remember that all aforementioned parties profit off of the fast, efficient, and reliable serving of queries on the network. This is the goal. Cost models vary throughout Indexer. You can read more about it in the Graph’s official documentation.
Client-side issues that impact users’ ability to activate and transact in your apps can drastically affect your bottom line. If you’re interested in monitoring UX issues, automatically surfacing JavaScript errors, and tracking slow network requests and component load time, try LogRocket.
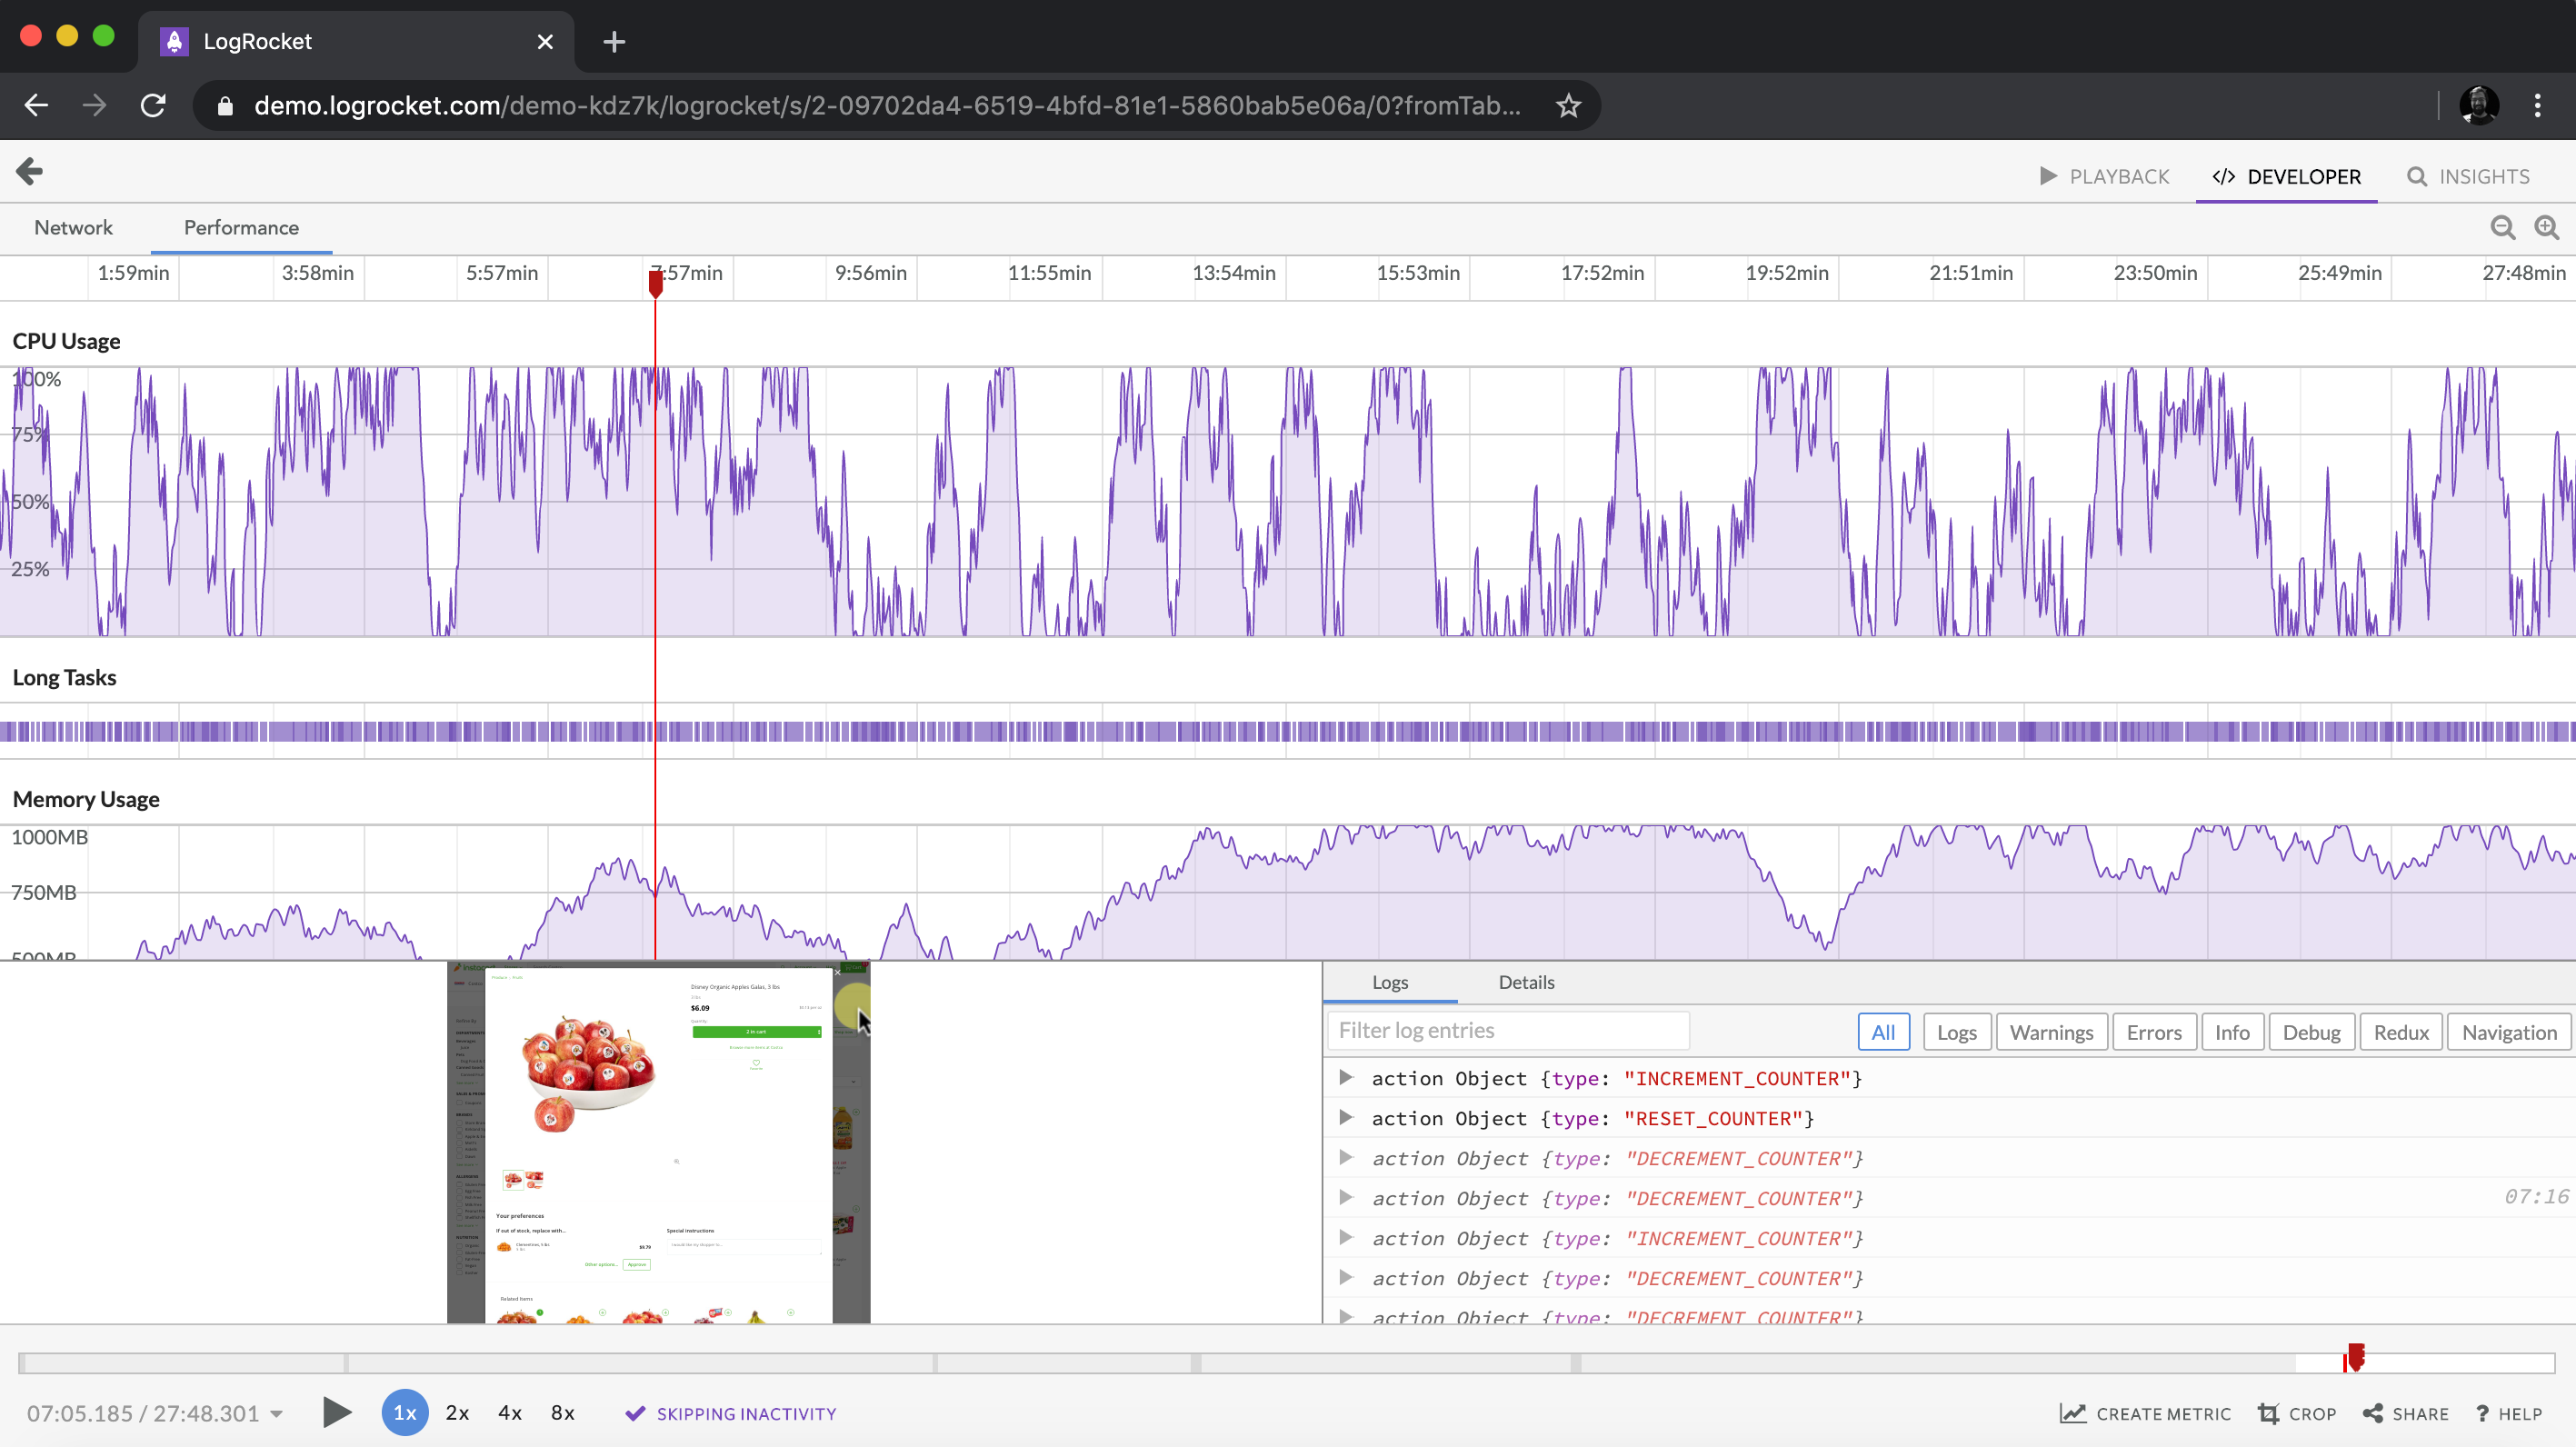
LogRocket lets you replay user sessions, eliminating guesswork around why bugs happen by showing exactly what users experienced. It captures console logs, errors, network requests, and pixel-perfect DOM recordings — compatible with all frameworks.
LogRocket's Galileo AI watches sessions for you, instantly identifying and explaining user struggles with automated monitoring of your entire product experience.
Modernize how you debug web and mobile apps — start monitoring for free.
Would you be interested in joining LogRocket's developer community?
Join LogRocket’s Content Advisory Board. You’ll help inform the type of content we create and get access to exclusive meetups, social accreditation, and swag.
Sign up now
Discover how to use Gemini CLI, Google’s new open-source AI agent that brings Gemini directly to your terminal.
This article explores several proven patterns for writing safer, cleaner, and more readable code in React and TypeScript.
A breakdown of the wrapper and container CSS classes, how they’re used in real-world code, and when it makes sense to use one over the other.
This guide walks you through creating a web UI for an AI agent that browses, clicks, and extracts info from websites powered by Stagehand and Gemini.