Show me a PM without business sense, and I’ll show you a big clunky product that’s collecting dust on a shelf.

It’s pretty easy to ship features. With the right setup, it’s also not hard to ship them fast. The difficulty lies in shipping the right features that customers want and driving a business impact. Failing to do this has severe consequences:
As a senior PM or product lead, it’s your responsibility to trim the fat. But identifying the opportunities worth pursuing takes practice and a deep business understanding.
In this article, I outline the structured approach I’ve used with various clients, from small and bootstrapped to big corporations, to help their senior product staff and leadership teams identify opportunities that drive business results.
A little heads up: this one’s all about focus, focus, focus.
Before diving into each step on a granular level, let’s look at the picture as a whole.
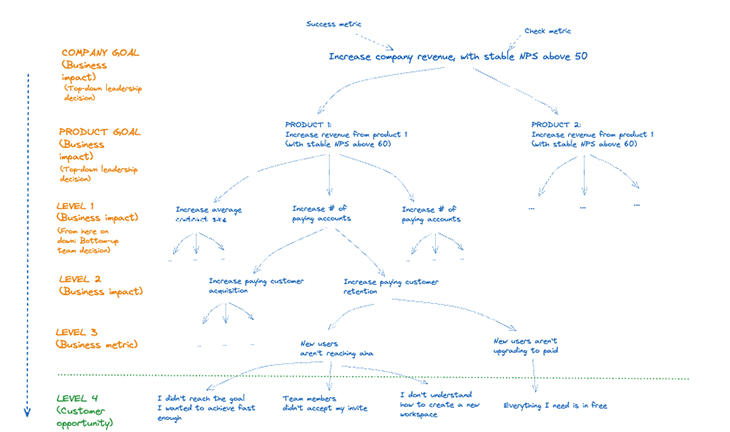
You’ll work from top to bottom, starting with the company and product goals you are trying to achieve. These should come from the leadership team. Individual teams usually lack the high-level, complete business view to be able to set the right goals, and a top-down definition of company and product goals is necessary to align everyone. Of course, this doesn’t mean that the leadership team shouldn’t work hard to get the rest of the team on board.
The next step usually happens on the team level. The team works together to break down the company and product goals into business goals (levels 1–3). The company goal is the main thing your entire business is trying to achieve, usually driven by key product metrics that sit below.
For each product metric, the team asks itself: which 3–5 main metrics have the biggest impact on this product metric? These main metrics should be mutually exclusive and collectively exhaustive (MECE).
An important rule is that there may only be one parent/child relationship in each branch of the tree. Each arrow should lead to only one box, up or down. If this isn’t the case, you’re probably not prioritizing ruthlessly enough — you shouldn’t attach any metric that could move the metric one level up, but only the primary drivers.
This first part of the tree is inspired by the Hierarchy of Metrics (check out this article by Michael Karpov, CPO at Skyeng). After laying out this part of the tree and — very importantly! — creating a case and internal alignment on which goals and metrics to go after first, we move down to level 4.
This is where the magic happens: Where we combine business outcomes and metrics with customer opportunities. From here, the tree folds into Theresa Torres’ famous opportunity solution tree, which I will dive deeper into later:
So let’s get granular and start at the top of the tree. Your primary company goal. As mentioned, internal alignment and a deep business understanding are essential here. The leadership team should define it.
In many cases, the primary goal will be revenue. Don’t worry about this sounding generic, it’s usually the most honest answer. You’ll get more precise when you work your way down the tree.
I’d recommend setting a boundary or check metric, as well to ensure that you’re not over-indexing on that #1 business goal. It’s relatively easy to increase revenue by lying to your customers about what your product can do, but this probably isn’t a great idea in the long run (never mind ethics).
An example boundary could be “with an average NPS above 50.”
Your #1 company goal will likely be driven by various revenue streams, for example by the different products, modules, or services.
This is the time for your leadership team to review and decide:

If you have multiple products driving revenue, this creates necessary internal alignment and ensures you’re prioritizing the right ideas and using resources wisely. In some cases, it can also make sense to assign specific teams to the different product outcomes.
The tree isn’t set in stone. You should always be reviewing, learning, and adapting.
If you divide the product goals over separate teams, each team can establish its business metrics from the bottom up (but in alignment with the leadership team). Letting teams define their metrics leads to more buy-in and commitment — a general feeling that what we’re working on makes sense.
If the company and product goals have been well-defined and explained by the leadership team, a strong team with enough context and business understanding should be able to identify which 3–5 metrics have the biggest impact on the product metric.
If you need to drill deeper you can add a fourth level, I find that three levels usually give me the desired level of precision.
You can draw this part of the tree from gut feeling or internal knowledge. You can logically brainstorm which 3–5 metrics are driving each metric one level above.
The next step will be to identify and support the importance level of each metric with proof points. For example: is our paying customer growth rate far below industry benchmarks? Or do we have more issues with retaining customers?
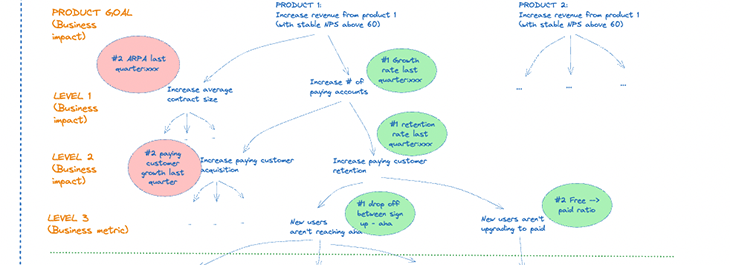
For each of these metrics, you analyze which business impact a (reasonable) fix in this metric would likely have on your company’s #1 goal (to keep things simple, let’s stick with revenue).
Many businesses overlook that customer retention or net revenue retention are far stronger levers than increasing customer acquisition. This Harvard Business Review article outlines how increasing customer retention rates by 5 percent has the potential to increase profits by 25–29 percent, and this Paddle article talks about the importance of retention and monetization (vs. new customer acquisition).
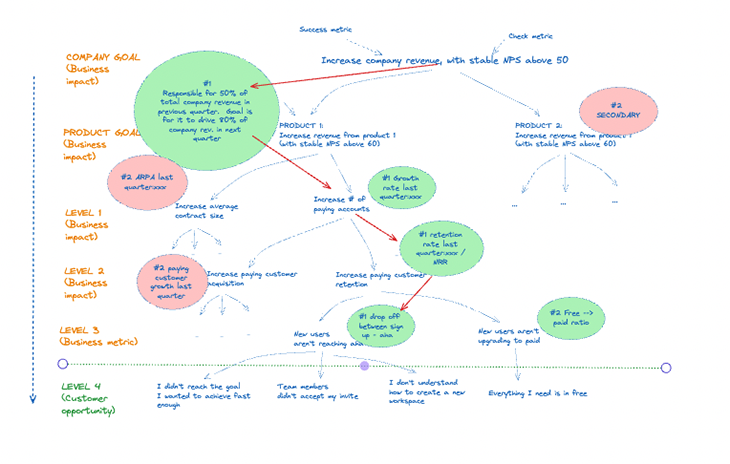
Now that you’ve identified which business impact metrics are the most important, you can go down in your tree following the right branch — the branch that will have the biggest impact on your company goal. By backing up your tree with a business case and supporting evidence, you create a map for yourself:
Assuming that your business goals are largely aligned with your customers’ interests, now it’s time to link your business metrics to customer opportunities.
This is the step where the Hierarchy of Metrics logic is merged with an Opportunity Solution Tree, as described at length in Teresa Torres’ book Continuous Discovery Habits (and in shorter form in this Product Talk article).
Again at first, you can map out your opportunities based on gut feeling or knowledge of your product.
For example, let’s dig into the business metric “sign up → aha” conversion rate. The underlying issue you are tackling is the fact that new users aren’t reaching their aha moment, they don’t achieve what they set out to do within your product within a short enough time frame (time to value). Now ask yourself: why are users failing to get here?
Examples might be:
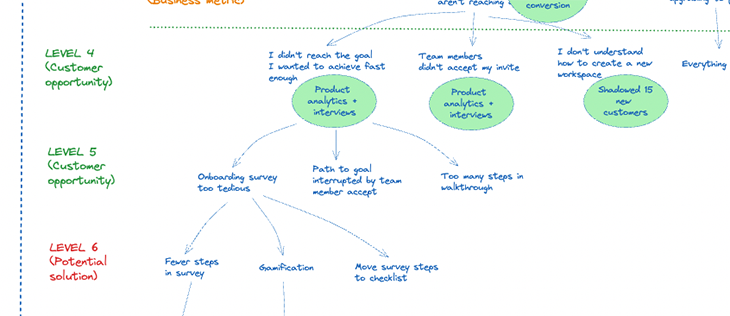
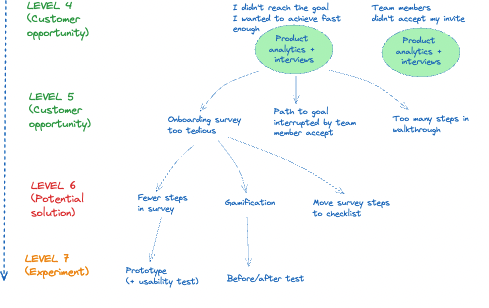
From each opportunity, drill deeper down by asking why over and over. Why aren’t users able to get to their goal fast enough? Because the onboarding survey is too long; because the path to their goal is interrupted; because they don’t know what to do with step x? And why is that?
In the second step, you’ll back up each of these customer opportunities with proof points, such as insights extracted from customer interviews, surveys, shadowing, product analytics data, etc.:

Now that you’ve used both gut feeling and real proof points to identify the most important customer opportunities that link neatly to business outcomes, which, in turn, will likely have the biggest impact on your company goal, you can finally dip your toes into the solution space.
Always make sure to think of your ideas as potential solutions. Nothing is set in stone, and it’s important to draft each solution idea in a lightweight way. Don’t get lost in the rabbit hole of drawing up the first solution you imagine to perfection — describing each potential solution in 1–3 sentences is enough:
A fast, simple way to make a first cut in your solution ideas is with an impact/risk matrix. I would recommend co-creating this matrix with your teammates. This team can be the product team, the cross-functional project or growth team, or the leadership team — whichever shoe fits.
This process can be quite rudimentary or gut-feeling-based, it’s just to make a first rough cut. Rule of thumb: inviting outsiders into your process (especially from different disciplines) will likely improve your results:
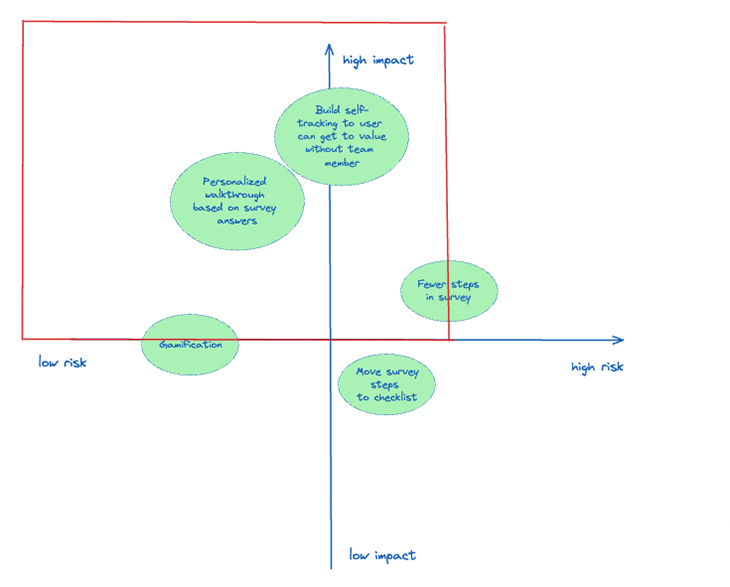
Now that you’ve identified your most promising (relatively low-risk/high-impact) solution ideas, it’s time to think about how you can validate them in the most lightweight way. You’re looking for a minimum viable test. The trick here is to hit both the minimum and viable marks.
Overshooting on the minimum means spending a disproportionate amount of resources, time, and effort to validate or falsify your solution idea. This is wasteful and doesn’t make business sense. An example would be spending six months to build, launch, and market a fully-fledged product with all bells and whistles to see if anyone will buy it.
Undershooting on the minimum means failing to attain the quality level to be able to assign the test result to your idea or assumption. An example would be creating a prototype that is of too low quality so that you can’t tell for sure whether any usability issues are due to your idea not working or the prototype simply being unusable.
Keeping this in mind, you’ll add your experimentation methods below your potential solutions in the opportunity solution tree:
You’ve gone through the entire tree from company goals, product goals, business impact, customer opportunities, and solution ideas. You’ve run experiments, identified the winning solution, and rolled out a v1.0.
Most businesses forget to take the final, important step: checking whether the change lived up to its promise through ex-post analysis.
It’s one thing to estimate whether a feature will be successful and drive your business goals upfront through lightweight experimentation. It’s another to check whether it moved the needle in the real world.
Of course, it depends entirely on the feature/change and your business model for how long you should wait until you can get meaningful results. This could be after a few weeks or after several months. And if you fail to tell your users about the new feature (through a public launch, an in-app notification, or otherwise), don’t expect any impact on your business metrics:
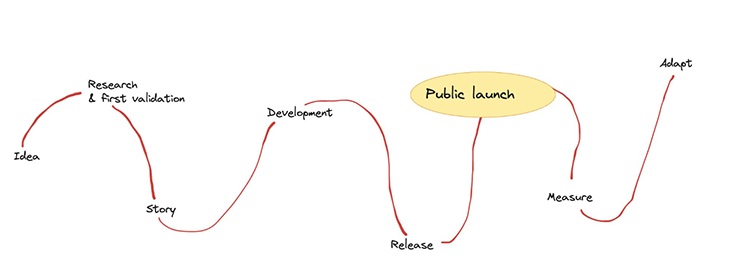
In this step, you’ll be answering two key questions:
Always ask yourself “Why?” or “Why not?” Just knowing that a feature is or isn’t being adopted isn’t enough. The real learnings come from extracting the why.
This might be tricky since in the real world multiple factors could be impacting the business metric. But just because something is hard, this doesn’t mean you should disregard it altogether. You can do this by interviewing customers, performing usability tests, etc.
As said in the introduction, it’s far more difficult to ship features that have a business impact than to just ship whatever your stakeholders are asking for.
But believe me, it feels pretty good to look back at your company’s growth and say with confidence, “Myy decisions played a big part in that.”
LogRocket identifies friction points in the user experience so you can make informed decisions about product and design changes that must happen to hit your goals.
With LogRocket, you can understand the scope of the issues affecting your product and prioritize the changes that need to be made. LogRocket simplifies workflows by allowing Engineering, Product, UX, and Design teams to work from the same data as you, eliminating any confusion about what needs to be done.
Get your teams on the same page — try LogRocket today.

Trey Courtney talks about his process for evaluating partnerships or acquisitions and how he successfully implements these initiatives.

Asma Syeda shares the importance of responsible AI and best practices for companies to ensure their AI technology remains ethical.

What hard skills do PMs need in 2025? Learn how AI tools can help you level up in SQL, Figma, A/B testing, and more.

Paul Weston talks about “quantifying the unquantifiable,” i.e., bringing in objective data for things that otherwise seem hard to measure.