
Every product roadmap is also a set of financial decisions. The choices you make about pricing, development, infrastructure, and support eventually affect revenue, costs, or profitability, even when those figures never appear on a product dashboard.

A profit and loss (P&L) statement gives product managers the financial context behind those decisions. Learning to read one can help you understand what it costs to deliver your product, build stronger business cases, and align product investments with company priorities.
In this guide, you’ll learn how P&L statements work, what their main components mean, and how single-step and multistep statements are calculated. We’ll also examine real-world examples, explain how product managers can apply P&L insights, and provide a customizable template.
Editor’s note: This blog was updated 2 September 2026 by Bartosz Jaworski to expand its guidance on how product managers can interpret and use P&L statements, including updated real-world examples, product-level applications, a refreshed template, and a new FAQ section.
A profit and loss (P&L) statement, also called an income statement, statement of earnings, or statement of operations, summarizes a company’s revenue, costs, and expenses over a set period, such as a month, quarter, or fiscal year. It shows whether the company generated a net profit or incurred a net loss and explains how its revenue and spending contributed to that result.
Executives, investors, and business owners use P&L statements to evaluate profitability, compare performance over time, and identify areas for improvement. As a product manager, you can use the same information to assess product costs, inform pricing and investment decisions, and understand how your products contribute to the company’s financial performance.
A P&L statement works by recording the revenue a company earned during a specific period and subtracting the costs and expenses it incurred. The result shows whether the company generated a profit or incurred a loss, as well as the financial factors that contributed to that outcome.
Although formats vary, most P&L statements center on three components: revenue, expenses, and net income.
Revenue is the amount a company earns from selling its products or services before accounting for costs and expenses. Depending on the business model, companies might estimate revenue using calculations such as:
A company with multiple products or revenue streams may report each one separately before calculating total revenue. It may also report net revenue, which is gross revenue minus adjustments such as returns, refunds, discounts, and allowances.
Expenses represent the costs a company incurs to generate revenue and operate the business. P&L statements typically divide them into two broad groups:
Separating these categories helps companies determine whether costs come from delivering the product itself or operating the broader business.
Net income, also called net profit, is the amount remaining after all costs and expenses have been subtracted from revenue. A positive result represents a net profit, while a negative result represents a net loss.
A multistep P&L statement also includes intermediate measures of profitability:
These figures help stakeholders identify where a company is generating profit and where rising costs may be affecting its financial performance.
A P&L statement measures financial performance over a period, whereas a balance sheet provides a snapshot of a company’s financial position at a specific point in time. The P&L statement reports revenue, expenses, and profit or loss, while the balance sheet reports assets, liabilities, and shareholders’ equity.
The documents answer different but complementary questions. A P&L statement shows whether the company was profitable during a period. A balance sheet on the other hand shows what the company owns, what it owes, and the equity remaining at a particular date.
A company can prepare a P&L statement using either cash-basis or accrual accounting. The selected method determines when revenue and expenses appear on the statement, which can significantly affect the results reported for a given period.
For example, suppose a company completes a project and invoices the customer in March but doesn’t receive payment until April. Under cash-basis accounting, the revenue appears in April. Under accrual accounting, it appears in March, when the company earned it.
The accounting method changes the timing of when activity is reported, not the underlying economics of the transaction. As a result, a cash-basis P&L may fluctuate based on payment timing, while an accrual P&L generally provides a more complete view of performance during each period.
Calculating a P&L statement involves adding the revenue earned during a period and subtracting the associated costs and expenses. The specific calculation depends on whether the company uses a single-step or multistep format.
Both formats arrive at net income, but a multistep P&L includes additional calculations that reveal where profit is being generated or lost.
A single-step P&L combines all sources of revenue and all expenses into two categories. Net income is calculated using one formula:
Net income = Total revenue − total expenses
For example, if a company generates $500,000 in revenue and incurs $420,000 in expenses, it has a net profit of $80,000. If expenses exceed revenue, the result is a net loss.
The single-step format is relatively easy to prepare and is commonly used by small businesses and service providers with straightforward cost structures. However, it provides limited detail because it doesn’t separate operating activity from other income and expenses or show intermediate measures such as gross profit.
A multistep P&L separates revenue and expenses into categories before calculating net income. This format shows multiple levels of profitability, making it easier to understand what’s driving the company’s financial performance.
The calculation typically follows four steps:
A multistep P&L should produce the same net income as a single-step statement based on the same financial data. Its advantage is greater visibility into gross profit, operating performance, and the factors affecting the bottom line.
PMs generally don’t prepare their company’s official P&L statement, but understanding these calculations helps you identify which financial measures your decisions affect. You might also use a simplified product- or feature-level model to support a business case, although that model shouldn’t be treated as a formal accounting statement.
P&L statements can look different depending on a company’s size, business model, accounting method, and reporting requirements. Large public companies typically use detailed multistep statements, while smaller or internal P&Ls may condense the same calculations into a handful of rows.
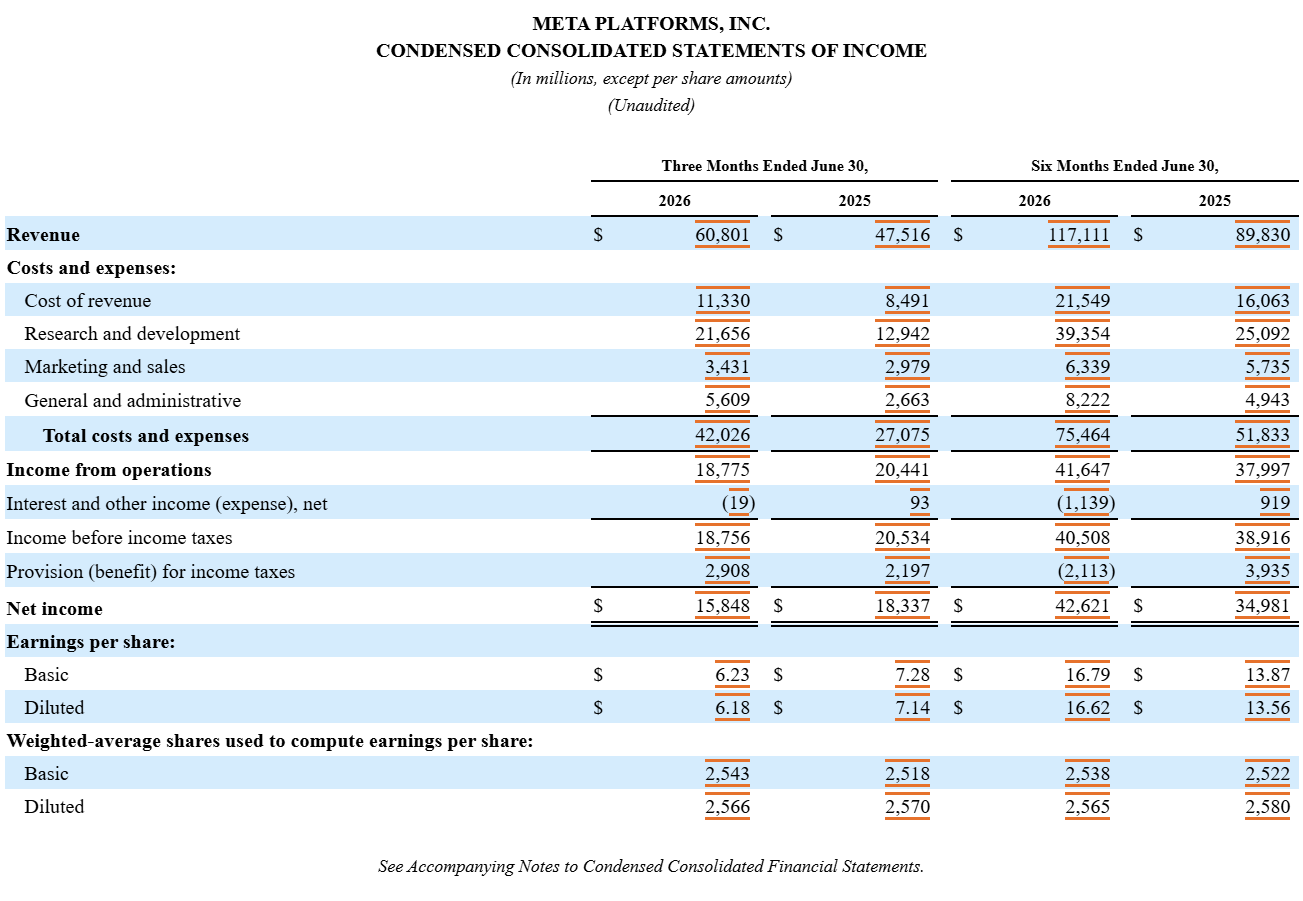
The following example comes from Meta Platforms’ Form 10-Q for the quarter ended June 30, 2026. It compares results from 2026 and 2025, with all figures reported in millions of dollars.
Source: Meta Platforms, Inc. 10-K filing
Rather than trying to interpret every line at once, follow the statement from top to bottom. For the three months ended June 30, 2026, Meta reported $60.801 billion in revenue and $42.026 billion in total costs and expenses, producing $18.775 billion in operating income.
After accounting for interest, other income or expenses, and taxes, Meta reported $15.848 billion in net income. The comparative columns also show that revenue increased from the same quarter in 2025, but costs and expenses increased more sharply, contributing to lower operating and net income.
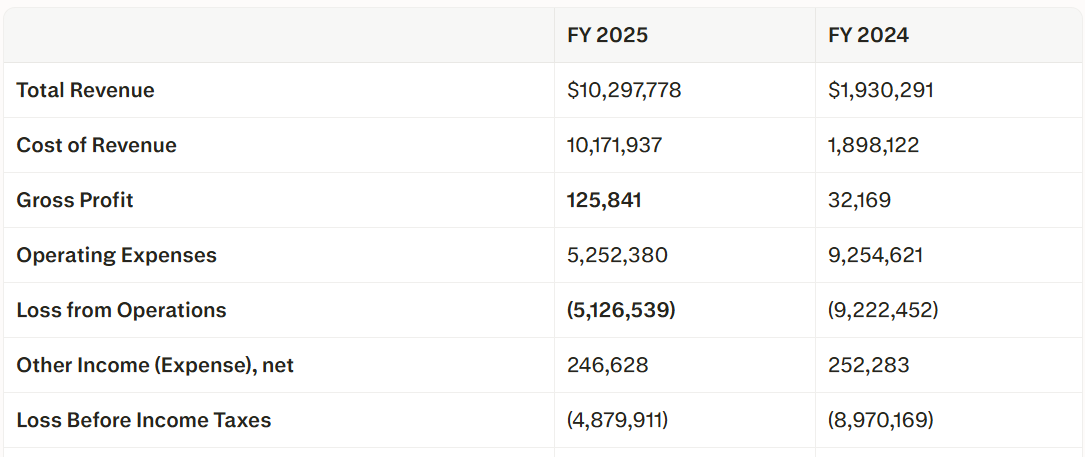
The following table presents the same basic flow in a more condensed format using figures from CIMG Inc. Instead of separating every expense, it highlights the primary calculations that move the company from revenue to its bottom-line result.
Source: CIMG, Inc. 10-K filing
For fiscal year 2025, the table starts with approximately $10.3 million in revenue. Subtracting $10.2 million in cost of revenue leaves $125,841 in gross profit.
Operating expenses then turn that gross profit into a $5.1 million operating loss. After accounting for other income and expenses, the company arrives at a loss before income taxes of approximately $4.9 million.
Together, these examples show that the amount of detail may vary, but the underlying progression remains consistent: revenue flows through costs and expenses to produce a profit or loss.
Investors use P&L statements to evaluate a company’s financial performance. Product managers use them to understand how product decisions contribute to revenue, costs, and profitability.
Although you probably won’t prepare a company’s formal P&L, your decisions can affect many of its underlying figures. Reading the statement provides a financial lens for evaluating investments, prioritizing roadmap initiatives, and communicating with finance and business leaders.
Every product initiative should identify its expected financial impact. Depending on the proposal, that impact might involve:
“Users will love this feature” doesn’t explain how an initiative will affect the business. A statement such as “Reducing our three largest support-ticket drivers could lower support costs by 35 percent” connects a product outcome to a measurable financial result.
This doesn’t guarantee that an initiative will receive funding, but it gives finance and leadership a clearer basis for evaluating the proposal. It also turns the business case into a hypothesis that the team can measure after launch.
Unit economics describe the revenue and costs associated with one unit of the business, such as a customer, subscription, transaction, or order. Hosting, third-party APIs, payment processing, customer support, and AI inference can all contribute to a product’s cost of revenue.
Tracking those costs helps you understand whether a product becomes more or less profitable as it grows. A product can increase adoption while weakening gross margin if the cost of serving each user grows faster than the revenue that usage generates.
This is particularly relevant for AI features, where inference costs can scale directly with usage. PMs should therefore evaluate adoption alongside metrics such as cost per request, cost per active user, and gross margin.
Changes in revenue, gross margin, and operating expenses can provide clues about the company’s current priorities. Strong investment relative to revenue may indicate an emphasis on growth, while tighter spending and margin targets may signal a shift toward efficiency.
The P&L shouldn’t be interpreted in isolation. You should consider it alongside company strategy, budgets, financial guidance, and leadership priorities when deciding how to adjust the roadmap.
During a growth period, the company may prioritize acquisition, new markets, or product expansion. During an efficiency push, retention, monetization, reliability, and cost reduction may become more important. Aligning your product strategy with the company’s financial goals begins with understanding which outcomes the business currently values.
When financial data is available at the product or plan level, PMs can compare revenue, direct costs, and gross margin across different offerings. This can reveal whether pricing covers the cost of delivering the product, whether a free tier is financially sustainable, or whether certain features consume disproportionate resources.
The same analysis can support portfolio decisions by showing which products generate profit and which require continued investment. Financial performance should still be considered alongside customer adoption, retention, and strategic value because not every valuable product or feature generates revenue directly.
A company-level P&L rarely provides feature-level detail. Product managers can work with finance, data, and engineering partners to build a simplified model that estimates:
The model should document its assumptions and use ranges when the precise financial impact is uncertain. Think of it as a decision-making tool rather than a formal accounting statement..
A product-level P&L model can support decisions about continued investment, maintenance, experimentation, or retirement. You can use the template in the next section as a starting point and adapt its categories to your product or feature.
Use this profit and loss statement template to organize your financial data and calculate gross profit, operating income, and net income. Before entering data, select a reporting period, such as a month, quarter, or fiscal year, and apply the same accounting method throughout the statement.
| Line item | Amount or formula |
| Revenue | [Enter revenue amount] |
| Cost of goods sold (COGS) or cost of revenue | [Enter COGS amount] |
| Operating expenses | [Enter operating expenses amount] |
| Gross profit | = Revenue – COGS |
| Other income | [Enter other income amount] |
| Other expenses | [Enter other expenses amount] |
| Net operating income | = Gross profit + (Other income – Other expenses) |
| Interest expense | [Enter interest expense amount] |
| Taxes | [Enter taxes amount] |
| Net profit | = Net operating income – interest expense – taxes |
The customizable Google Sheets version automatically calculates each profit measure as you enter your revenue, costs, and expenses. You can use it for a company, business line, or product-level analysis, although a product-level version may rely on estimates rather than formal accounting data.
To use the template, open the spreadsheet and select File > Make a copy. Save the copy to your Google Drive, then replace the placeholder values with your financial data.
These FAQs explain common terminology, how often you should review a P&L, and which profit measures are most relevant to product decisions.
Yes. A P&L statement and an income statement are two names for the same financial document. Companies may also call it a statement of earnings or statement of operations, but each summarizes revenue, expenses, and profit or loss over a specific period.
A product manager should generally review the company’s P&L at least quarterly or whenever the organization reports financial results. If finance produces monthly statements and your role directly affects revenue, pricing, or costs, a monthly review may be more useful.
PMs with responsibility for a product line, business unit, or cost-intensive product may need to review financial performance more frequently. Other PMs can use quarterly planning cycles and major investment decisions as natural opportunities to revisit the statement.
The goal is to understand important trends and variances, not to monitor every accounting line. For day-to-day product decisions, a product-level financial model may be more actionable than the company’s formal P&L.
Gross profit is net revenue minus COGS or cost of revenue. Gross margin expresses that profit as a percentage of revenue. Net profit, also called net income, is what remains after operating expenses, interest, taxes, and other income or expenses have been accounted for.
You can often influence gross profit more directly through decisions involving pricing, packaging, infrastructure, third-party services, and the cost of delivering the product. Net profit provides broader context about the company’s overall performance, but it includes many expenses that fall outside a product manager’s control.
For most PMs, gross profit and gross margin are the more actionable measures, while net profit helps place roadmap decisions within the company’s wider financial priorities. This distinction is especially important for AI features, which can increase usage and customer value while reducing gross margin if inference costs grow faster than revenue.
As a product manager, you don’t need to be an accountant to use a P&L effectively. Understanding revenue, costs, expenses, and the difference between gross and net profit is enough to begin translating product decisions into financial terms.
A P&L can help you build stronger business cases, evaluate unit economics, inform pricing and packaging, and align roadmap investments with company priorities. When the company statement lacks product-level detail, a simplified financial model can make assumptions explicit and provide a shared basis for comparing opportunities.
That financial context also strengthens related responsibilities, from managing a product budget to conducting a feasibility study. It helps you explain not only what your teams want to build, but also how those investments could affect the business.
Remember a P&L doesn’t replace customer research, product analytics, or strategic judgment. You should think of it as providing another lens for determining whether a product creates sustainable value, and the strongest product decisions account for both customer outcomes and financial reality.
Featured image source: IconScout
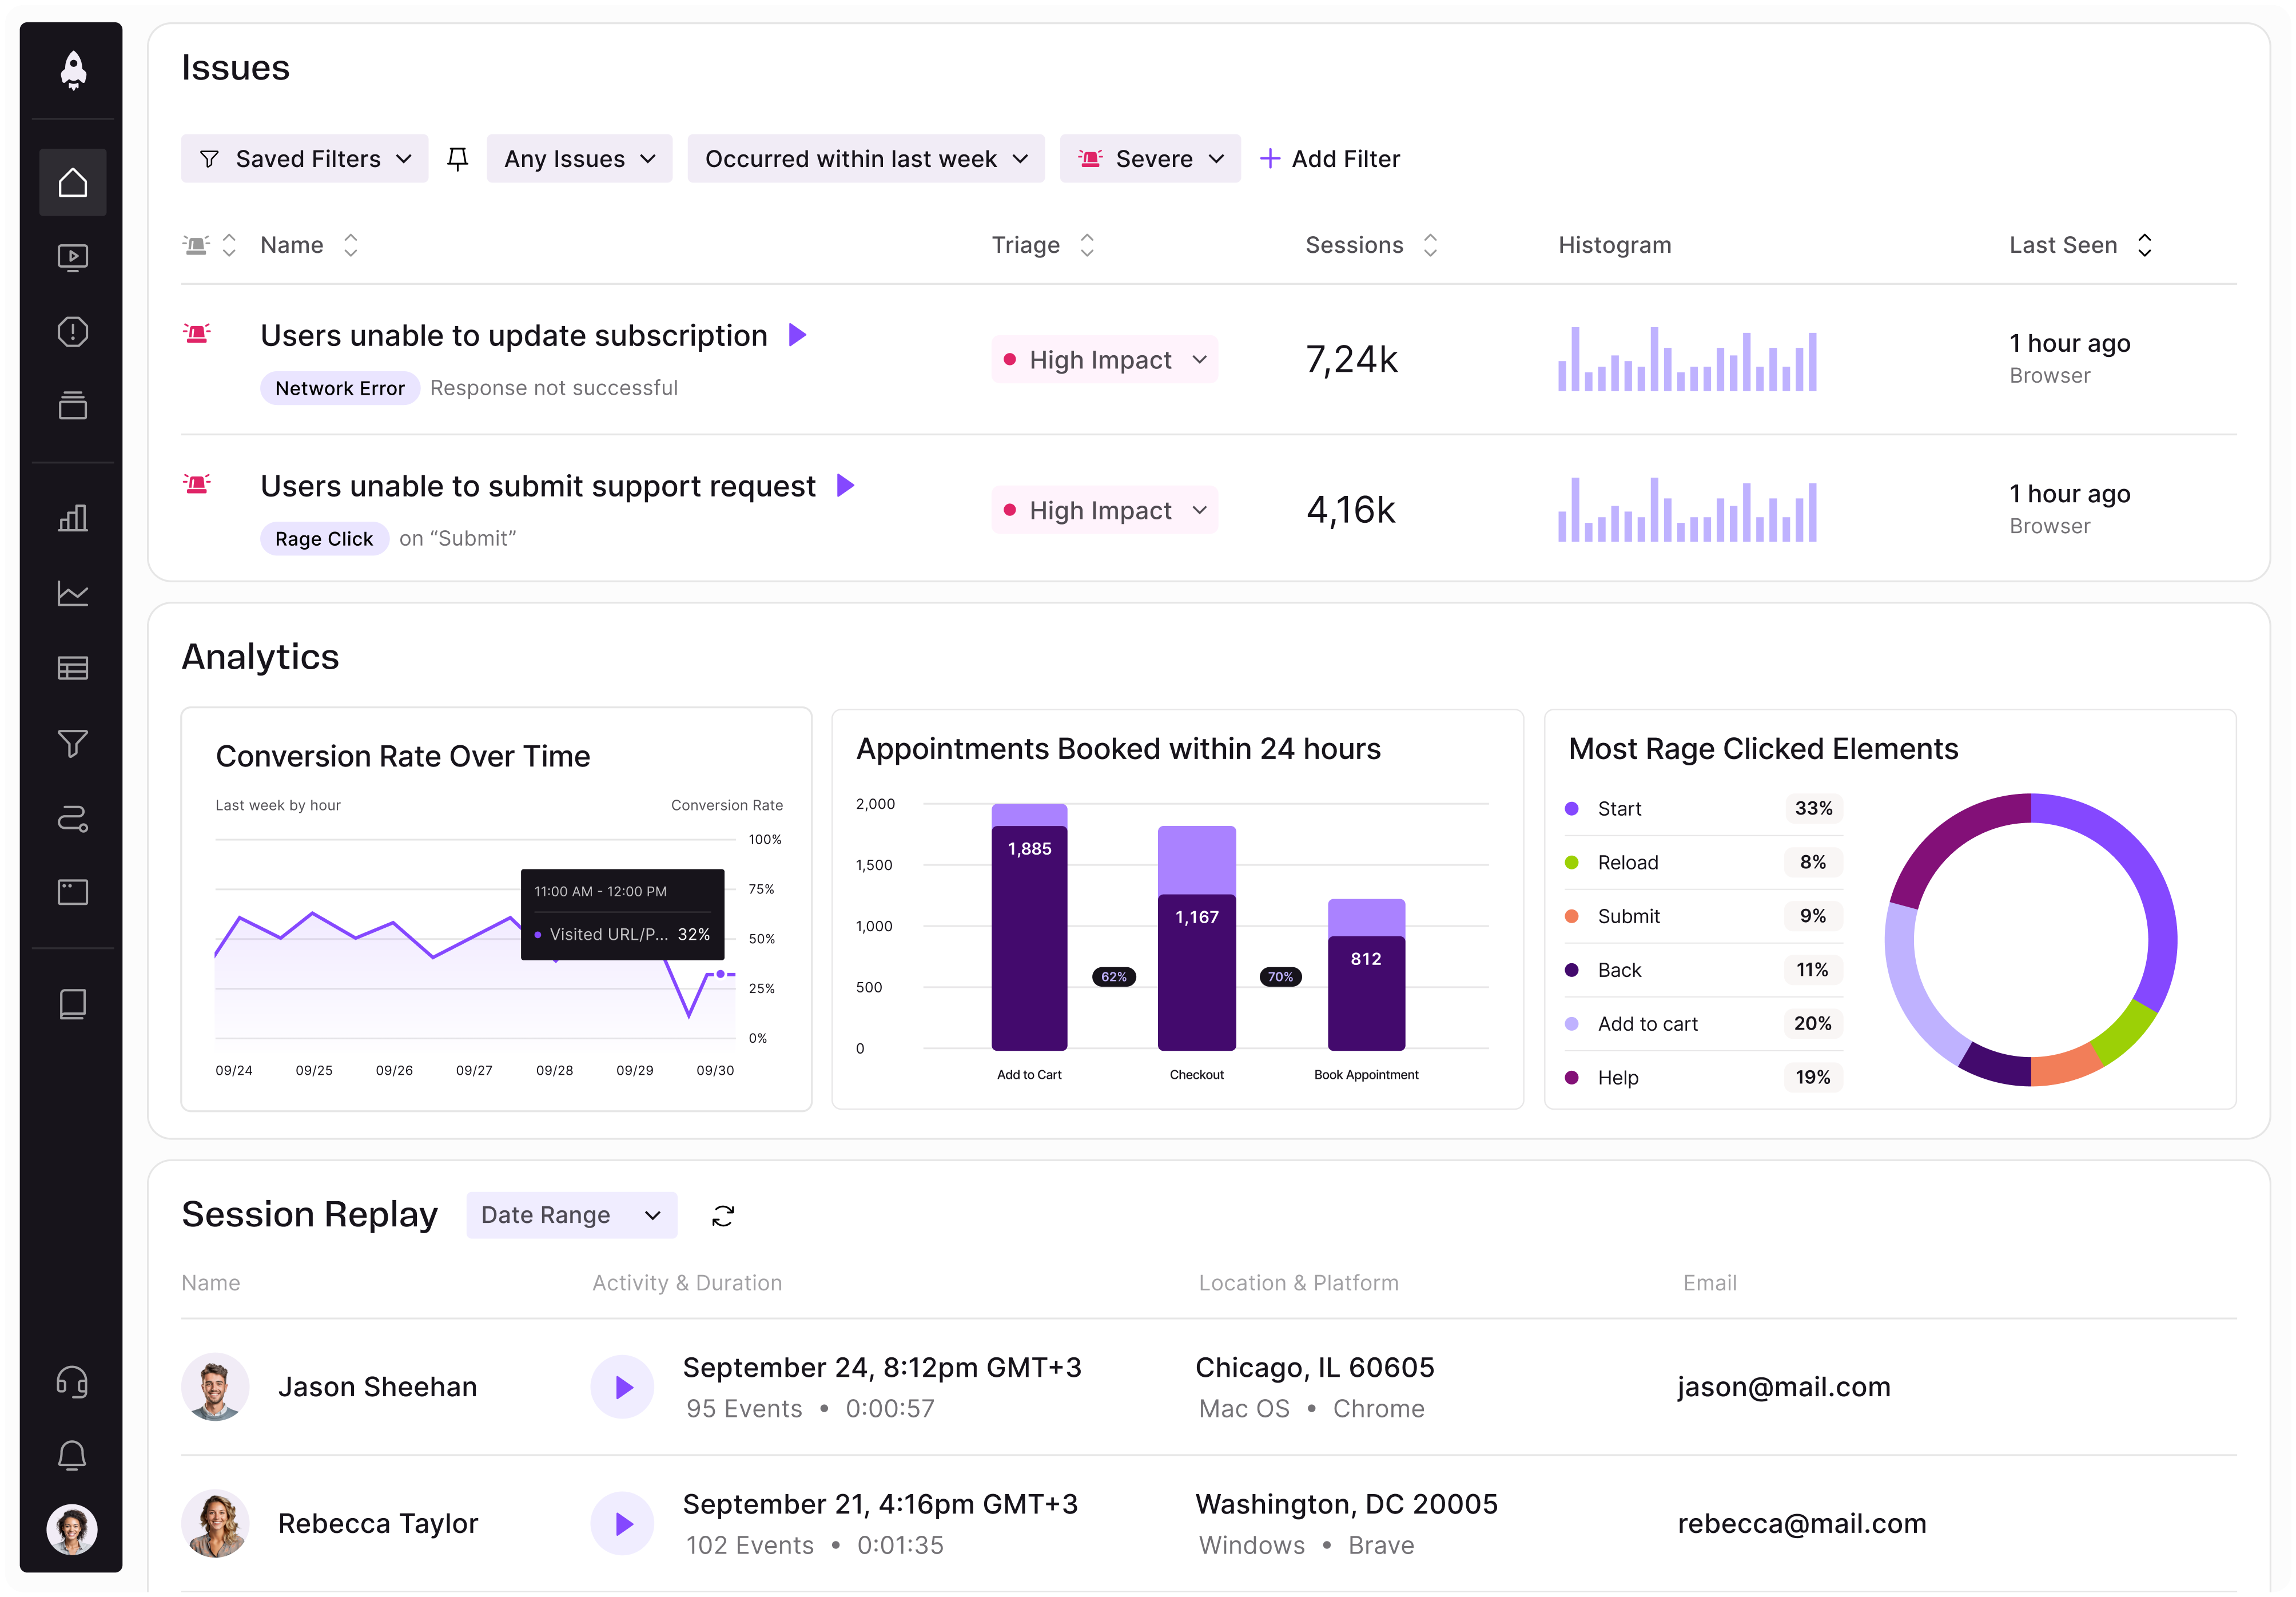
LogRocket identifies friction points in the user experience so you can make informed decisions about product and design changes that must happen to hit your goals.
With LogRocket, you can understand the scope of the issues affecting your product and prioritize the changes that need to be made. LogRocket simplifies workflows by allowing Engineering, Product, UX, and Design teams to work from the same data as you, eliminating any confusion about what needs to be done.
Get your teams on the same page — try LogRocket today.

Discover how Meilisearch uses LogRocket’s MCP and Galileo to improve free trial conversion and adoption of newly shipped features across its Cloud product.

Resolve cross-functional conflict in AI product development with a 3-step framework to clarify risks, assign owners, and align teams to act.

Learn when prompt-first UX adds friction and how product managers can choose AI interfaces that balance flexibility, structure, and control.

Is the foldable iPhone true product innovation? See how PMs can assess user needs, weigh costs, and separate real value from technical hype.


 Learn more →