
Editor’s note: This article was updated on 14 April 2022 to reflect the most recent information for Node.js logging best practices, including information about Pino and Bunyan and health monitoring tools.
Logging is one of the most important and useful steps a developer can take when working in Node.js. In fact, it’s one of the most useful steps a developer can take regardless of their runtime environment! Logging helps developers know what it is that their code is actually doing, and can help developers save hours of debugging work.
One of the key purposes of logging is to save information about each flow or runtime. This is the same information that a developer uses to understand their application. For example, if there is a bug in the database section of an app, a log will point to where the failure takes place, helping you to identify the cause of the problem.
In this article, we’ll cover some of the best practices for logging in Node.js and see why logging is a good idea. I will also share my recommendations for the best monitoring tools for Node.js applications.
Jump ahead:
console.logThe Replay is a weekly newsletter for dev and engineering leaders.
Delivered once a week, it's your curated guide to the most important conversations around frontend dev, emerging AI tools, and the state of modern software.
Before we review best practices for logging in Node, it’s important to remember that not all information should be logged. For example, personal data, like user information, and delicate data, like passwords and credit card information, should not be logged. Also worth noting is that the tool you use to log is far less important than your approach to logging.
In the following sections, we will explain the most effective approaches as a part of logging best practices in Node.js.
console.logSome would argue that it should be regular practice when building a side project to have console.log around your applications. Other console methods include console.group, console.info, and less common methods like console.error:
console.error('Error!');
When running console.log, you may notice a negligible decrease in performance. To avoid negatively impacting performance, I recommend switching to a logging library when your project begins to expand.
Logging libraries help developers create and manage log events, which can increase the overall efficiency and functionality of your application. Some of the most popular logging libraries for Node are Winston, Pino, Bunyan, and Log4js.
While you should almost always use a standard console.log, a logging library can be more functional and help avoid decreases in app performance.
If you want to store your error log in a remote location or separate database, Winston might be the best choice because it supports multiple transports. Alternatively, Log4js supports log streams, like logging to a console, and log aggregators like Loggly (using an appender).
Below is an example of how to set up a logging library using Winston:
const winston = require('winston');
const config = require('./config');

const enumerateErrorFormat = winston.format((info) => {
  if (info instanceof Error) {
    Object.assign(info, { message: info.stack });
  }
  return info;
});

const logger = winston.createLogger({
  level: config.env === 'development' ? 'debug' : 'info',
  format: winston.format.combine(
    enumerateErrorFormat(),
    config.env === 'development' ? winston.format.colorize() : winston.format.uncolorize(),
    winston.format.splat(),
    winston.format.printf(({ level, message }) => `${level}: ${message}`)
  ),
  transports: [
    new winston.transports.Console({
      stderrLevels: ['error'],
    }),
  ],
});

module.exports = logger;
This logging library is very popular for its low overhead and minimalism. It uses less resources for logging by using a worker thread for processing.
const pino = require('pino');

// Create a logging instance
const logger = pino({
level: process.env.NODE_ENV === 'production' ? 'info' : 'debug',
});


logger.info('Application started!');
Using Pino with web frameworks has recently been made easier. For example, Fastify comes with Pino by default, and others have a specific library for Pino. For more information on how to use Pino, refer to this article.
Bunyan is another fast JSON logging library that supports multiple transports and uses a CLI for filtering the logs. It has a refined method that produces what they should do. My favorite feature about Bunyan is the log snooping, which helps in debugging failures in production.
const bunyan = require('bunyan');
const log = bunyan.createLogger({name: 'myapp'});
log.info('My App');


{"name":"myapp","hostname":"banana.local","pid":40161,"level":30,"msg":"My App","time":"2022-04-04T18:24:23.851Z","v":0}
Other cool features of Bunyan are a stream system for controlling where logs are located, support for environments aside from Node.js, and that JSON objects are serialized by default.
Another best practice is to log your HTTP request in your Node.js application. One of the most used tools to accomplish this is Morgan, which gets the server logs and systematizes them to make them more readable.
To use Morgan, simply set the format string:
const morgan = require('morgan');
app.use(morgan('dev'));
For reference, the predefined format string is:
morgan('tiny')
Below is the expected output:
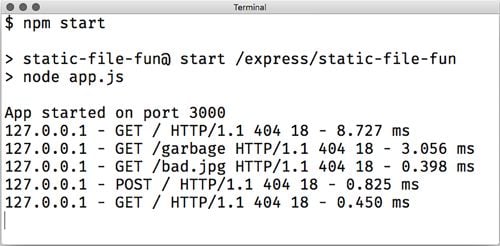
If you choose to use the Winston library, then you can easily configure with Morgan:
const morgan = require('morgan');
const config = require('./config');
const logger = require('./logger');

morgan.token('message', (req, res) => res.locals.errorMessage || '');

const getIpFormat = () => (config.env === 'production' ? ':remote-addr - ' : '');
const successResponseFormat = `${getIpFormat()}:method :url :status - :response-time ms`;
const errorResponseFormat = `${getIpFormat()}:method :url :status - :response-time ms - message: :message`;

const successHandler = morgan(successResponseFormat, {
  skip: (req, res) => res.statusCode >= 400,
  stream: { write: (message) => logger.info(message.trim()) },
});

const errorHandler = morgan(errorResponseFormat, {
  skip: (req, res) => res.statusCode < 400,
  stream: { write: (message) => logger.error(message.trim()) },
});

module.exports = {
  successHandler,
  errorHandler,
};
As you can see in the above example, to configure Winston with Morgan, you just have to set up Winston to pass the output of Morgan back to it.
Before embarking on a build with your development team, it is very important to define your log levels in order to differentiate between log events. Managing log events in an orderly and consistent manner makes it easier to get necessary information at a glance.
There are several log levels and it is important to know them and their uses. Each log level gives a rough direction about the importance and urgency of the message:
The developer should be able to see a detailed event and determine if it should be fixed immediately.
Depending on how big your application is, it may be helpful to pull the logs out of your application and manage them separately using a log management system.
Log management systems allow you to track and analyze logs as they happen in real time, which in turn can help improve your code. As you can see in the example below, a log management system can help you keep track of useful data including backend errors, anomalies, log sources, and production errors.
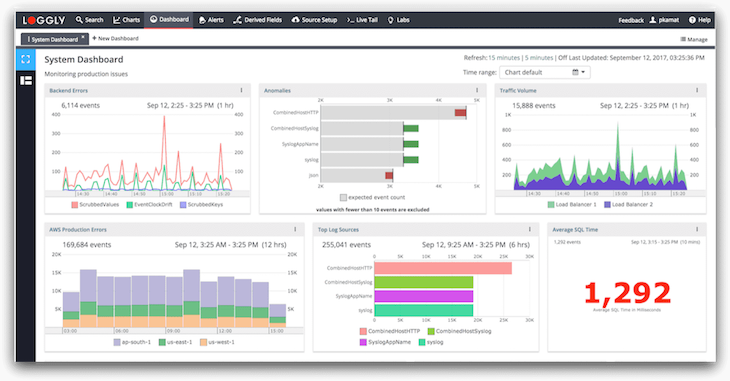
For log analysis and log management tools, I recommend Sentry, Loggly, McAfee Enterprise, Graylog, Splunk, Logmatic (acquired by Datadog at the time of writing), or Logstash.
Health monitoring tools are a good way to keep track of your server performance and identify causes of application crashes or downtime. Most health monitoring tools offer error tracking as well as alerts and general performance monitoring. Some developers find error tracking particularly frustrating in Node.js, so using a health monitoring tool can help alleviate some of those difficulties.
Below are few popular monitoring tools for Node.js:
In this article, we looked at how important logging is and how it can help developers better understand their applications. We also discussed logging best practices in Node.js, including using a log library, logging HTTP requests, defining log levels, and using a log management system.
A few of the popular logging libraries like Winston, Pino, and Bunyan are actually fair to work with and lightweight meaning that they won’t be a bottleneck on your Node.js application.
While no infrastructure is completely safe or entirely error free, logging is a necessary step for developers who want to monitor production and cut down on errors.
Logging can also be useful for other team members including QA, Support, and new programmers, as it saves valuable information to learn from and build on.
 Monitor failed and slow network requests in production
Deploying a Node-based web app or website is the easy part. Making sure your Node instance continues to serve resources to your app is where things get tougher. If you’re interested in ensuring requests to the backend or third-party services are successful, try LogRocket.
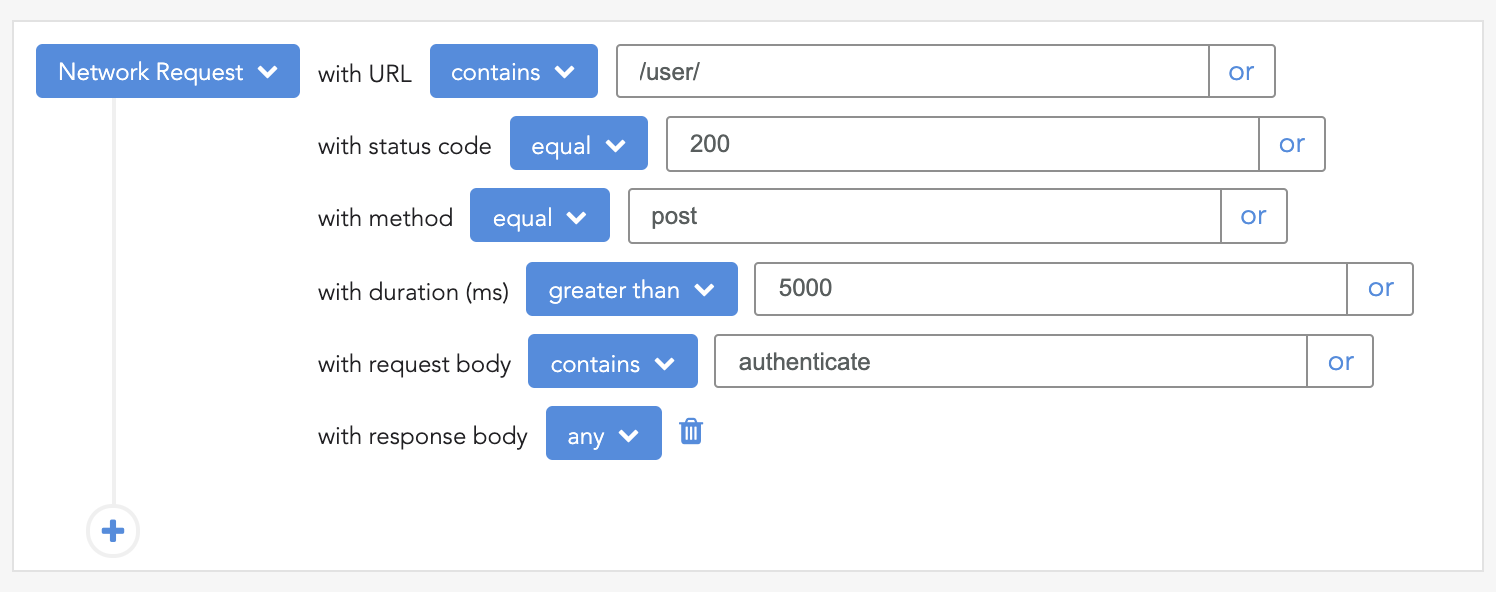
LogRocket lets you replay user sessions, eliminating guesswork around why bugs happen by showing exactly what users experienced. It captures console logs, errors, network requests, and pixel-perfect DOM recordings — compatible with all frameworks.
LogRocket's Galileo AI watches sessions for you, instantly identifying and explaining user struggles with automated monitoring of your entire product experience.
LogRocket instruments your app to record baseline performance timings such as page load time, time to first byte, slow network requests, and also logs Redux, NgRx, and Vuex actions/state. Start monitoring for free.

Why the future of DX might come from the web platform itself, not more tools or frameworks.
A hands-on test of Claude Code Review across real PRs, breaking down what it flagged, what slipped through, and how the pipeline actually performs in practice.

CSS art once made frontend feel playful and accessible. Here’s why it faded as the web became more practical and prestige-driven.

Learn how inline props break React.memo, trigger unnecessary re-renders, and hurt React performance — plus how to fix them.
Would you be interested in joining LogRocket's developer community?
Join LogRocket’s Content Advisory Board. You’ll help inform the type of content we create and get access to exclusive meetups, social accreditation, and swag.
Sign up now