One of the biggest benefits for teams using Node.js is the ability to use JavaScript on both the client and the server. But how do we ensure that we don’t write unoptimized JavaScript code in Node.js? Also, how do you test the performance of your application both during development and after it’s deployed to production?
In this article, we’ll look at some best practices for writing and testing your Node.js code, then put them to use with some examples.
First, let’s start with some best practices to incorporate into your code when it comes to CPU resources.
Despite being single threaded, Node.js can spawn child processes to take care of tasks. Though helpful when used sparingly, an overabundance of child processes will drastically reduce the performance of your code. A child process comes with overhead on your CPU like memory consumption, which uses your machine’s limited resources. Therefore, it’s important not to spawn more child processes than you have cores in your machine.
Below is an example of a Node.js script spawning child processes using the cpuCount variable, which determines whether or not it needs to spawn more child processes:
var counter = 0;
fn: async (inputs, exits) {
  const os = require('os')
  // Get number of CPU cores
  const cpuCount = os.cpus().length
  if (counter > cpuCount) throw new Error('Can\'t spawn any more child processes')
  var fork = require('child_process').fork;
  var child = fork('./test');
  console.log('Test Started....');
  counter++; // note this line
}
Workers, or worker threads, are useful for performing CPU-intensive JavaScript operations. However, do not use them for input/output intensive operations. Node.js handles async input/output more efficiently than you can with workers, as described in the Node.js documentation.
In the code snippet below, we are creating an instance of the Worker constructor when we are on the main application thread. Afterwards, we will perform CPU-intensive tasks in the else block and pass a message back to the main thread with parentPort.postMessage('Hello world!'):
const { Worker, isMainThread, parentPort } = require('worker_threads');
if (isMainThread) {
  // This code is executed in the main thread and not in the worker.
  // Create an instance of Worker
  const worker = new Worker(__filename);
  // Listen for messages from the worker and print them.
  worker.on('message', (msg) => { console.log(msg); });
} else {
  // This code is executed in the worker and not in the main thread.
  // Send a message to the main thread.
  // In here you perform CPU-intensive tasks
  parentPort.postMessage('Hello world!');
}
PM2 is a process manager for production Node.js applications. It assists in scaling web applications over multiple local processes, improves the performance of your application, and also helps with monitoring. Install PM2 by running the following command in your terminal:
npm install -g pm2
Start your application by running the following code where app.js is the entry point:
pm2 start app.js
PM2 allows you to take advantage of multi-core systems by running your application in clusters,making it easy to scale your application up or down. We can tell PM2 to run our application on two instances:
pm2 start app.js -i 2
Recall that PM2 runs in the background, which means you can easily forget to close it when you are not using it. Add the following code to see what processes are running:
pm2 list
Close the running process by using:
pm2 kill
Node.js allocates enough memory to keep all objects in the current scope. By default, the memory is limited to 512 MB. As memory consumption approaches its limit, V8 will spend more time in garbage collection, which will, in turn, affect the performance of your application.
You can increase the memory limit with the --max-old-space-size switch. The --max-old-space-size is a Node.js V8 CLI option that allows you to override the default memory size.
To use the --max-old-space-size option, pass it as an option when starting Node.js and give it a size in megabytes. For example, the code snippet below will increase the memory size to 1536 MB (1.5 GB):
node --max-old-space-size=1536 index.js
Most objects in a Node.js application have a short lifecycle, therefore, it’s best to reuse objects whenever possible. Creating too many new objects will slow down your application because you’ll have to run the Node.js garbage collector frequently.
To check memory usage in your application, you can use the process.memoryUsage() method:
process.memoryUsage().heapTotal // Gets available memory heap toal in bytes
process.memoryUsage().heapUsed // Gets used memory heap in bytes
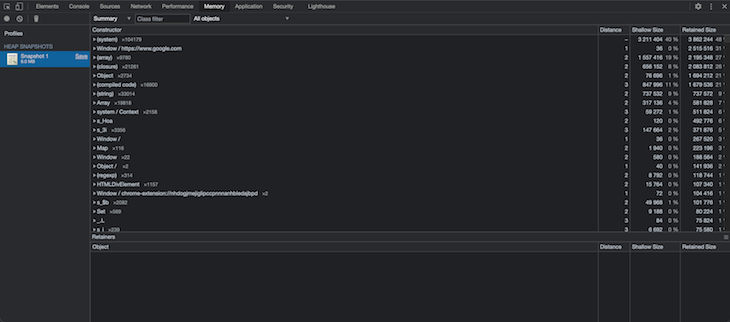
It’s important to avoid running the garbage collector in production because it will constantly log the values of running those two functions to your production logging environment. This process is, however, suitable for a development environment. You can monitor the memory usage in your application on Chrome Developer Tools (DevTools) in the Memory tabs section.
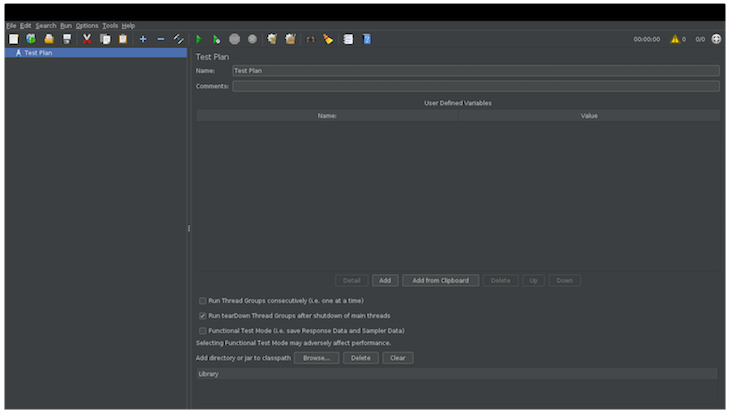
After building your Node.js application, it’s a good idea to perform a load test. A load test determines the number of requests your application can handle efficiently at a time and how the application will behave with large requests. It will also help you decide how to scale your application. For load testing, you can use Apache JMeter.
According to its site, Apache JMeter is an open-source, pure Java application designed to load test functional behavior and performance measurement. You can download JMeter and follow the Getting Started guide to use it for load testing.
With Apache JMeter, you can record any behavior on your Node.js application, like file uploads and client sessions. You can also batch requests to load test your application, then watch and monitor for performance bottlenecks.
Now, you know some best practices for creating Node.js applications. However, you should still check that your code is as performant as possible. In the next section, we’ll go over some performance analytics for Node.js.
A slow Node.js application is usually a result of running out of resources. Although there are other resources, like the network and hard drive, we’ll focus on these two:
Node.js comes out of the box with several tools that allow you to monitor resource utilization.
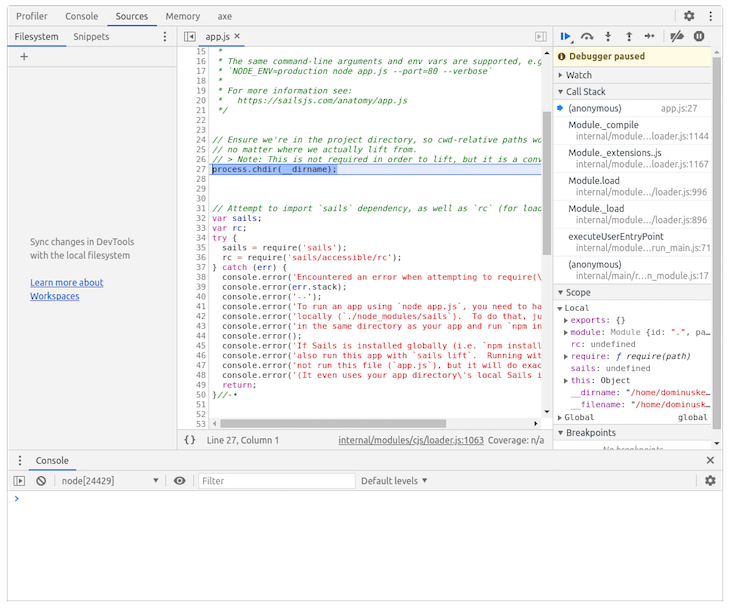
When you start your Node.js application with the --inspect or --inspect-brk switch, the Node.js process will listen for a debugging client. It allows you to debug your Node.js code using a tool you are familiar with for debugging client side JavaScript, which is Chrome Dev tools in our case.
To use the Inspector, run your Node.js script with the node ---inspect-brk app.js command, which will:
IP address: 127.0.0.1port 9229After running the command, head over to the Google Chrome browser. It runs the same JavaScript engine as Node.js, the V8 engine. Type about:inspect in the address bar and it will redirect you to chrome://inspect.
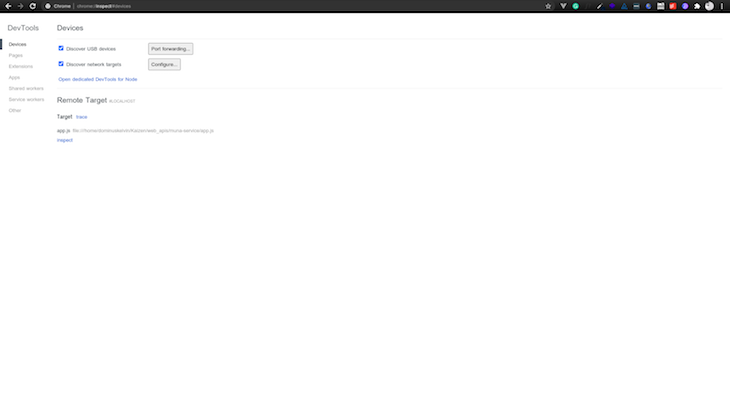
To debug your Node.js session, click on the inspect link to launch a pop-up window with Chrome developer tools. If you already know how to use the Chrome developer tools, you can proceed to profile your application and see resource consumption. You can read more on debugging JavaScript in Chrome.
As previously mentioned, it’s important to remember that Node.js is single threaded, which means that you have only one execution process to work with. Imagine millions of clients working with that single thread! That’s a very limited resource.
Though this single threaded approach keeps Node.js simple so that we don’t have to deal with things like thread safety, it just doesn’t scale.
Node uses asynchronous input/output to schedule reading and writing operations, which won’t block the execution process. However, if your code is written without following best practices, it’s capable of using 100 percent of the CPU and will block the Node.js execution process.
Let’s see an example of a code that can block the execution thread:
function blockProcess() {
        while(true) {
                console.log("Blocking process")
        }
}
While this is a superficial example, if you run the blockProcess function and monitor your CPU, you will see how it raises the CPU consumption to almost 100 percent. Therefore, it’s smart to avoid writing code that blocks processes like this.
You’ll need to measure the CPU load to analyze if you have a high CPU load issue. One way to check is by using Chrome Developer Tools with the Node.js process session running.
Go to the profiling tool section of the Chrome Developer Tools, which gives you a CPU profile that tells you how much time a certain function, subprocess, or resource takes. Next, look for a file that has a high CPU consumption time. Click on it to find out which function/statement is causing the high CPU load so that you can work on fixing the problem.
Execution time is the amount of time it takes certain blocks of our application to execute from start to finish. To measure execution time, wrap the block of code you want to measure using the
console.time and console.timeEnd methods. As an example, the code below is making a network request in a Sails.js web application:
fn:  async function(inputs, exits) {
var wavesNGNPrice = await sails.helpers.fetch('https://waves-africa-api.herokuapp.com/ngn');
exits.success(wavesNGNPrice)
}
The implementation of the function isn’t all that important for what we want to achieve right now, but let’s say we want to know how long the first line of the function takes to execute. We would wrap it like this:
fn:  async function(inputs, exits) {
console.time(‘waiting’)
var wavesNGNPrice = await sails.helpers.fetch('https://waves-africa-api.herokuapp.com/ngn');
console.timeEnd(‘waiting’)

exits.success(wavesNGNPrice)
}
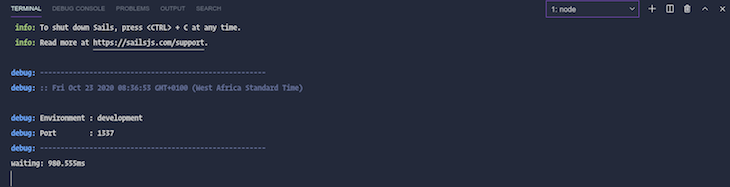
When we start the application, we’ll see an output in the console displaying the amount of time in milliseconds the code takes to run. We can use this output to see what could be blocking our code and making the application slow.
Another Node.js tool for measuring performance is the perf_hooks module, which allows you to measure the performance of different aspects of your application when you create markers in your code.
Let’s see it in action by using it to measure the same code block we did above. First, we need to import PerformanceObserver and performance from the perf_hooks module:
const { PerformanceObserver, performance } = require(‘perf_hooks’)
Next, we’ll create a new observer object:
const obs = new PerformanceObserver(items => {
        console.log(items.getEntries()[0].name, items,getEntries()[0].duration);
performance.clearMarks();
});
Then, we’ll call the observer method on the object telling it what entry types we want:
obs.observe({ entryTypes: [‘measure’] });
Finally, we’ll wrap the code with the performance.mark method and output the measurement by running performance.measure:
fn:  async function(inputs, exits) {

performance.mark(‘start waiting’)
var wavesNGNPrice = await sails.helpers.fetch('https://waves-africa-api.herokuapp.com/ngn');
performance.mark(‘end waiting’)

performance.mark(‘waiting period’, ‘start waiting’, ‘end waiting’)

exits.success(wavesNGNPrice)
}
You should get an output similar to the one shown below:
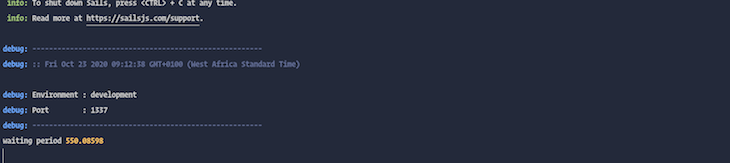
In the above implementation of the PerformanceObserver, we are logging the execution time to the console. The Node.js documentation on Performance measurement APIs will be useful to get a deeper understanding of this functionality.
The perf_hooks module has no side effects, therefore it won’t change anything when you put it in your code. It comes in handy when you suspect a particular line to be the culprit for the slow state of your Node.js application.
If you are experiencing any performance issues, the perf_hooks observer can be included in production to measure performance analytics on a live project. However, you shouldn’t turn it on in every case in production because it may cause your app to lag.
Let’s review the best practices we covered for measuring the performance of your code.
Because our Node.js application’s performance affects our users directly, a good developer knows to ensure that applications are performant and optimized!
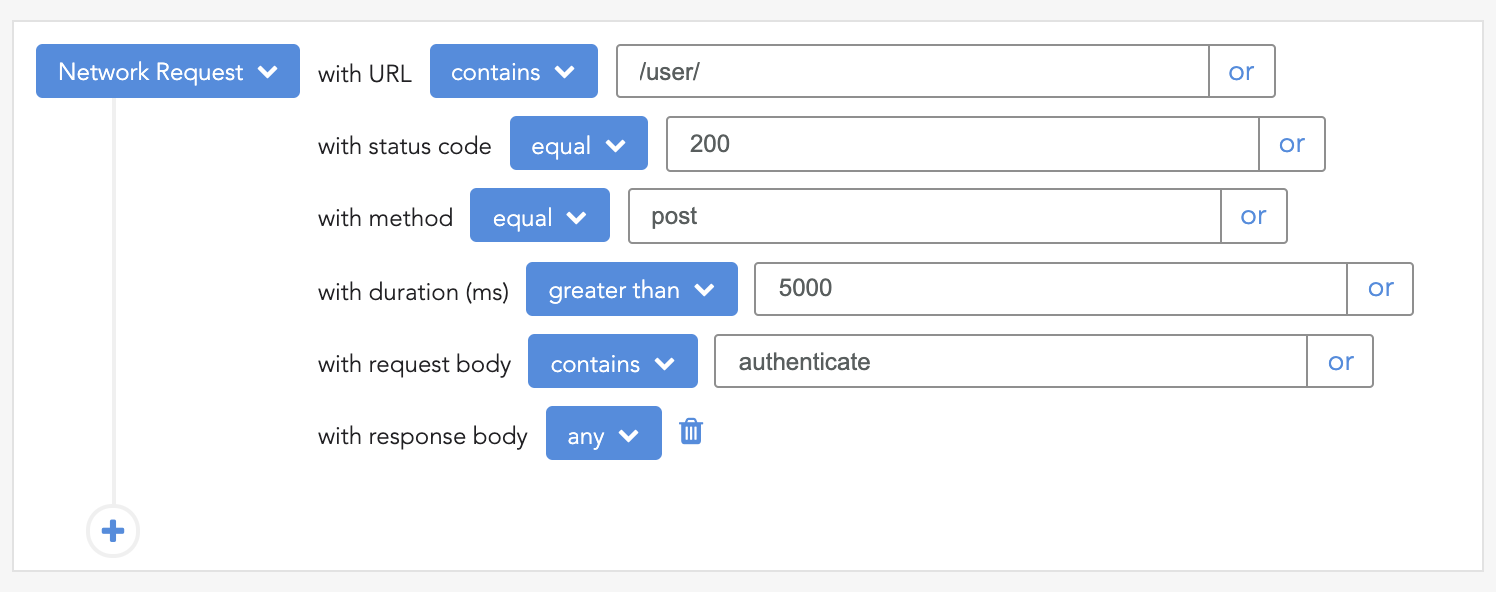
 Monitor failed and slow network requests in production
Deploying a Node-based web app or website is the easy part. Making sure your Node instance continues to serve resources to your app is where things get tougher. If you’re interested in ensuring requests to the backend or third-party services are successful, try LogRocket.
LogRocket lets you replay user sessions, eliminating guesswork around why bugs happen by showing exactly what users experienced. It captures console logs, errors, network requests, and pixel-perfect DOM recordings — compatible with all frameworks.
LogRocket's Galileo AI watches sessions for you, instantly identifying and explaining user struggles with automated monitoring of your entire product experience.
LogRocket instruments your app to record baseline performance timings such as page load time, time to first byte, slow network requests, and also logs Redux, NgRx, and Vuex actions/state. Start monitoring for free.

Debug RSC hydration mismatches in production with Next.js instrumentation, Suspense isolation, HTML diffing, and CI smoke tests.
Explore why npm dependencies are a major supply chain security risk and how to protect JavaScript apps from compromised packages and transitive threats.

Enabled React Compiler v1.0 on a production Next.js app. Here’s every warning, breakage, and silent opt-out I documented — and what actually worked.

We built the same app in TanStack Start RSC and Next.js RSC. TanStack shipped 40% less JS and built 4x faster — but Next.js is still the safer production bet.
Hey there, want to help make our blog better?
Join LogRocket’s Content Advisory Board. You’ll help inform the type of content we create and get access to exclusive meetups, social accreditation, and swag.
Sign up now