When memory used by your program isn’t needed anymore, it’s supposed to be returned to the pool of free memory available to your operating system so that it can be reused. When your program doesn’t release this unused memory, you have what’s called a “memory leak” on your hands. Memory leaks can slow down your app and may eventually cause it to crash. They’re a common cause of performance issues in complex JavaScript apps.
Tracking down the root cause of a memory leak can be difficult. I’ve learned this the hard way at LogRocket while working to improve the performance and memory usage of our JavaScript SDK.
JavaScript is a garbage collected language. It will automatically attempt to free memory that isn’t being referred to by your program anymore. When memory can’t be freed, it means you’ve kept a reference to it somewhere in your code. These unwanted references are often subtle. Finding them by reading through your code can take hours.
Fortunately, there are better ways of approaching this problem. In particular, Chrome’s Allocation Timeline is a great tool for isolating and investigating memory leaks in your app.
The Allocation Timeline will show you stack traces that can help you identify which part of your code is responsible for allocating particular objects. To use this feature, you need to enable a DevTools setting that is disabled by default. Open your DevTools settings, find the Performance section, and check “Record heap allocation stack traces.”

With that out of the way, let’s run through our example. We’ll work with the following page:
<!doctype html>
<html lang="en">
<head>
  <meta charset="UTF-8">
  <title>Leak</title>
</head>
<body>
  <button id="allocate">Allocate</button>
  <button id="release">Release</button>


  const allocate = document.getElementById("allocate");
  const release = document.getElementById("release");
  let strings = [];
  let interval;

  randomInteger = (min, max) => {
    // Min is inclusive, max is exclusive.
    min = Math.ceil(min);
    max = Math.floor(max);

    return Math.floor(Math.random() * (max - min)) + min;
  }

  storeString = (size) => {
    const s = new Array(size).join('s')
    strings.push(s);
  }

  leak = () => {
    // Allocate 1-3 MB.
    const size = randomInteger(1e6, 3e6);
    storeString(size);
  }

  allocate.onclick = () => {
    interval = setInterval(leak, 500);
  };

  release.onclick = () => {
    clearInterval(interval);
    strings = [];
  };

</body>
</html>
Here’s a version you can play with in your browser. When the “Allocate” button is clicked, the script on the page repeatedly allocates 1–3 MB of memory with which to store a string. References to these strings accumulate in the strings array until the “Release” button is clicked.
Open Chrome’s Task Manager and let the script run for several seconds. You should see the page consume an increasing amount of memory.

Keeping references to the strings we’re creating in an array simulates what happens during a memory leak by preventing JavaScript’s garbage collector from cleaning them up. The memory used to store each string is never released, causing our script’s memory usage to climb.
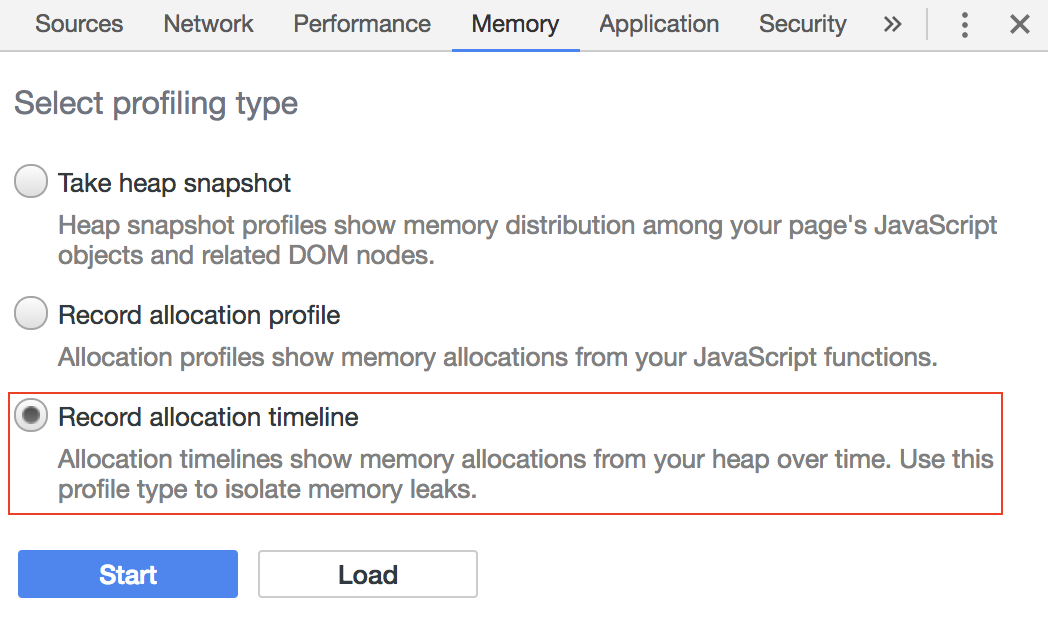
Now pretend we don’t already know the cause of this elevated memory usage. The Allocation Timeline can help us find the source of our leak (i.e., what’s using the memory that can’t be freed). To use it, select “Record allocation timeline,” located under the DevTools’ Memory tab.
Click the “Start” button to run the profiler, then click the “Allocate” button on our example page. You’ll see blue bars appear on the timeline.
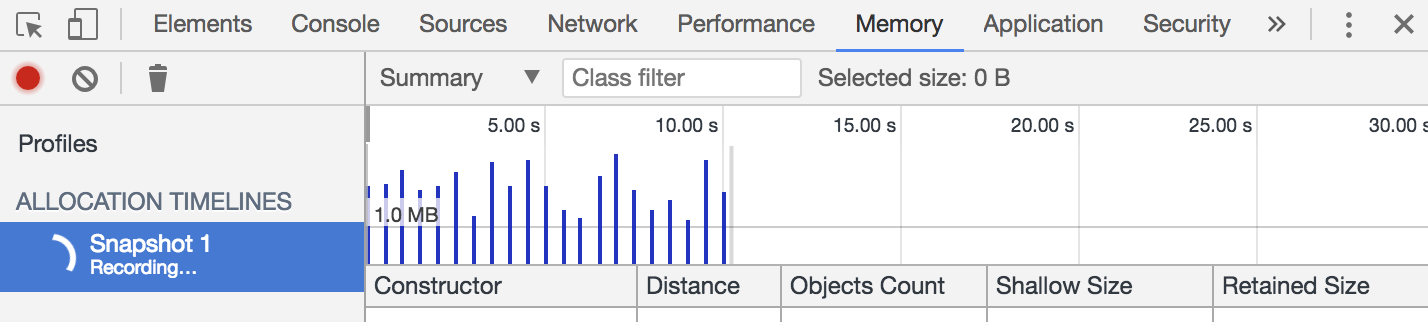
Blue bars represent allocated memory that hasn’t been freed. If you click the “Release” button, the blue bars become gray bars.

Gray bars represent previously allocated memory that has been freed. Stop the profiler using the circle in the upper left.
Blue bars that remain on the allocation timeline when you stop a recording indicate potential memory leaks. To explore this case, re-run the profiler, click the “Allocate” button, then stop the profiler before clicking the “Release” button. You should be left with a timeline full of blue bars. Narrow your focus to a single blue bar by zooming in.
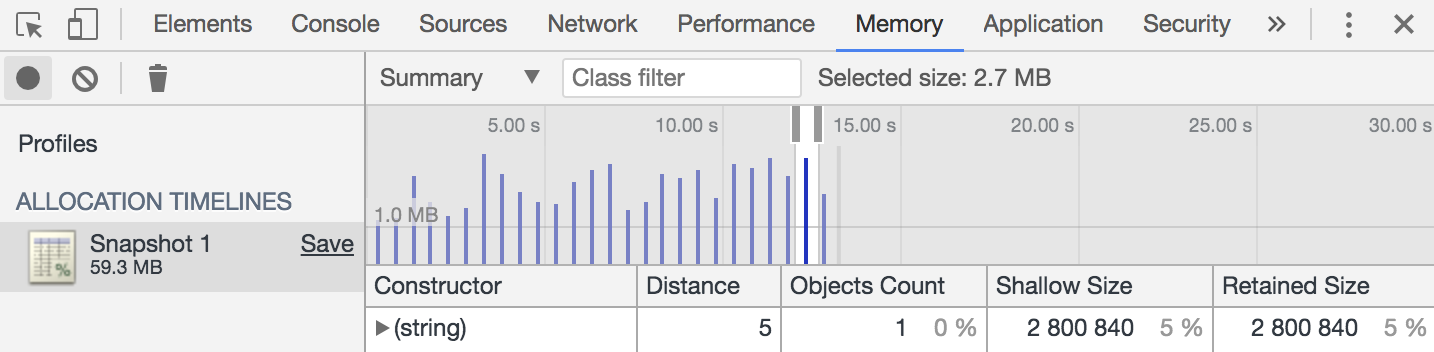
This limits the “Constructor” list to objects allocated in the highlighted span. In this case, we see that 2.8 MB worth of strings were allocated in this time span. (To learn more about the difference between shallow size and retained size, see the Memory Terminology section of the DevTools docs.)
Expanding the entry for the (string) constructor reveals that a single 2.8 MB string was allocated here. We can see the string itself, and by opening the “Allocation stack” tab, we can see a stack trace telling us exactly where this string was created.
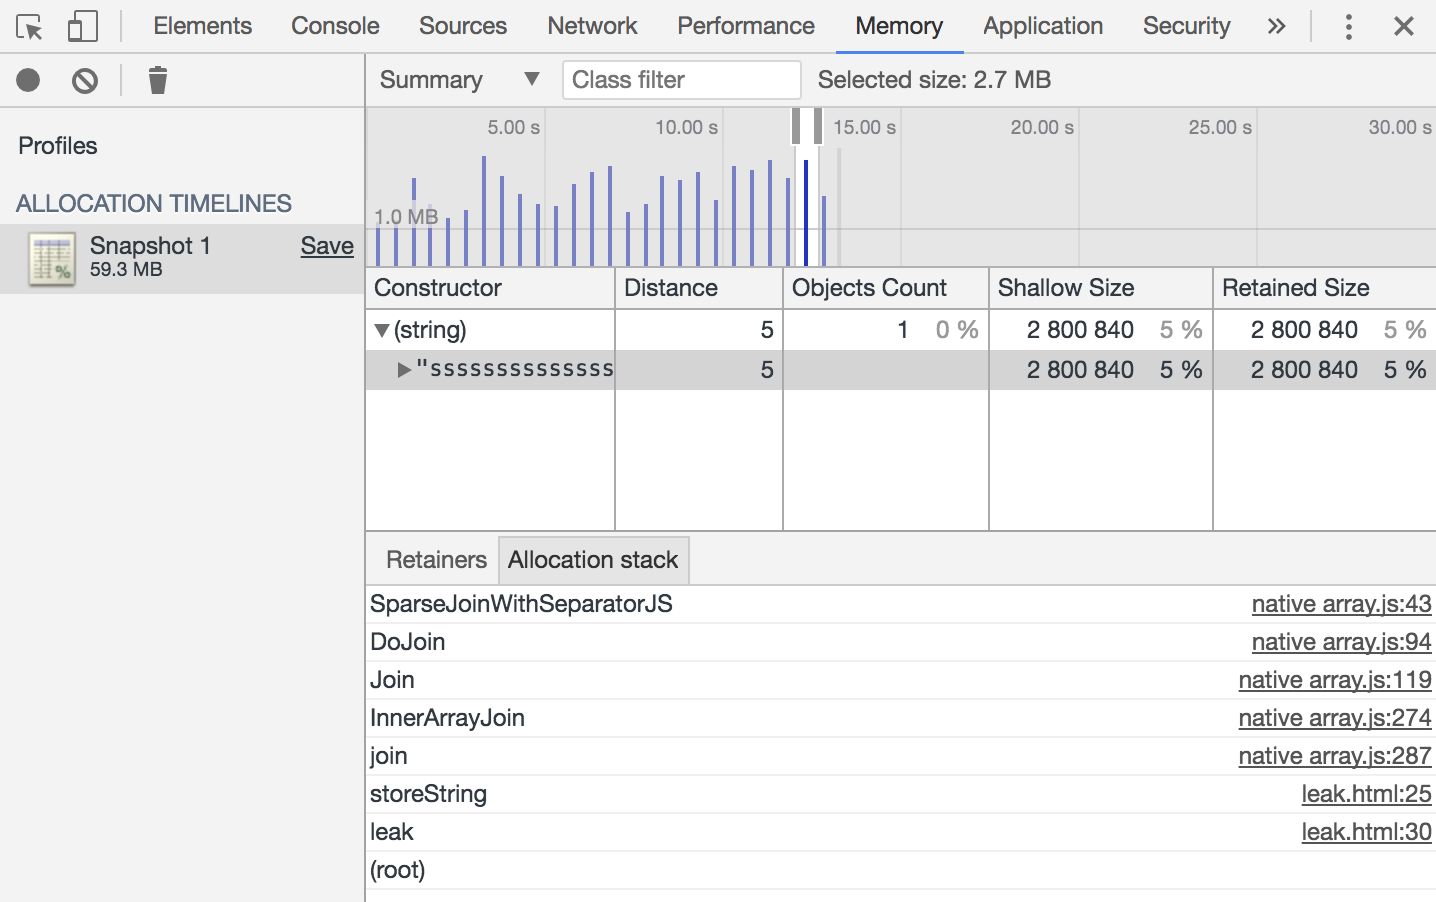
In many cases, this stack trace can point you to the place in your code that needs fixing more quickly than if you were to attempt finding that spot without it.
Keep in mind that you can export allocation timeline snapshots by clicking the “Save” link in the sidebar. This is helpful if you find yourself profiling an especially busy or leaky app, in particular one that’s prone to crashing. This can slow down the DevTools to the point that they’re unusable, or in the case of a crash, cause you to lose your timeline altogether.
Instead of letting the app continue to run while you frantically inspect the timeline, save a snapshot, close the tab in which the app is running, take a deep breath, open a new tab, open the DevTools, then load your saved snapshot.
Memory leaks happen from time to time. The next time you encounter one, remember that the Allocation Timeline is your friend.
Install LogRocket via npm or script tag. LogRocket.init() must be called client-side, not
server-side
$ npm i --save logrocket

// Code:

import LogRocket from 'logrocket';
LogRocket.init('app/id');
// Add to your HTML:

<script src="https://cdn.lr-ingest.com/LogRocket.min.js"></script>
<script>window.LogRocket && window.LogRocket.init('app/id');</script>

Learn how to set up Meilisearch, index documents, and build keyword, semantic, and hybrid search with AI-powered retrieval.
Compare pnpm and npm across security defaults, disk usage, dependency strictness, and workspace policy to decide which package manager fits your project.

I migrated 20 production-style components from Tailwind to StyleX. Here’s what the data showed about LOC, CSS bundle size, build time, and type safety.

A guide for using JWT authentication to prevent basic security issues while understanding the shortcomings of JWTs.
Would you be interested in joining LogRocket's developer community?
Join LogRocket’s Content Advisory Board. You’ll help inform the type of content we create and get access to exclusive meetups, social accreditation, and swag.
Sign up now