The Replay is a weekly newsletter for dev and engineering leaders.
Delivered once a week, it's your curated guide to the most important conversations around frontend dev, emerging AI tools, and the state of modern software.
In the data visualization world, many folks now take a hybrid approach to the code they write. They use a UI library/framework such as React to handle state and DOM manipulation in a reactive, declarative coding style.

Devs use D3 for the layout and design of the visualization, which follows an imperative coding style. This hybrid approach uses the strengths of both libraries to produce more maintainable and readable code.
In recent years, there has been a migration to Svelte for data visualization (data viz) — major publications now use Svelte for producing their data-driven visual stories.
The Pudding is a digital publication that writes visual essays on popular culture and topical issues, and their latest article is a great example of how data visualization and graphics are used today. Notice how the story uses scroll-based transitions to present graphics related to the text as you proceed through the story, making it more immersive and informative.
Russell Goldenberg of The Pudding recently spoke about their transition to Svelte on an episode of The Changelog podcast:
I think I’ve converted a few people on the team to be into Svelte. It just makes so much sense for the type of work we do. I’ve been finding it really great for dealing with data visualization specifically… And it’s really nice when we have a lot of different levels of engineering on our team. It’s the only framework that I’ve found that actually works across all levels, because it’s a really easy learning curve to just get started.
This migration makes sense, as Svelte was created by a former graphics editor for The New York Times, Rich Harris. One reason he built Svelte was to make his everyday work easier.
As a result, data viz concerns were initial considerations when creating the framework, and this has led to it being more amenable for making data visualizations.
This is not a beginner’s guide to Svelte or D3. It is assumed you know the basics of both. If you are starting out, you can try the following resources:
Imperative code is where we write code for each step to get the desired outcome, whereas, with declarative code, we express the outcome we want. For example, in our data viz code, we may want to create an SVG and set its dimensions. Using D3, this is what we do:
//d3-example.js
const width = 800;
const height = 600;

const svg = d3
  .select("#chart")
  .append("svg")
  .attr("width", width)
  .attr("height", height);
In Svelte, we write the following:
<!-- Example.svelte -->
<script>
    const width = 800;
    const height = 600;
</script>

<svg {width} {height}></svg>
We will use Svelte to declare the HTML and SVG and bind data to it. For the layout of the elements, we’ll use D3 within a Svelte component.
Before we go further, you may wonder why you would use Svelte over React for data viz. Here’s why.
While you can accomplish the same things with both frameworks, they are quite different in philosophy and style. Let’s cover the key differences.
First, when visualizing data in the browser, it is preferable to work with SVG elements, as they are more expressive than HTML. Specifically, we should use the circle SVG element for a circle rather than a div styled with border-radius: 50%. Because Svelte components are designed to work on top of markup, you write less boilerplate code when working with SVG.
Second, React uses a virtual DOM (VDOM), whereas Svelte uses the DOM. Svelte has less runtime overhead than React, as it does not hold snapshots of state in memory. Because Svelte is a compiler, it knows at build time how things change in your app rather than waiting to do the work at runtime. When manipulating datasets in the browser, this saving can make a significant difference in performance.
Next, Svelte performs tree-shaking at compile-time and only includes the code it needs to run in its bundles, resulting in smaller bundle sizes. React is a complete library that you include as a runtime dependency.
Also, transitions and animations are used often in data visualization to show state changes and highlight correlations between data. Svelte has built-in support for transitions and animations since version 3. With Svelte, if you don’t have a custom transition or animation in your app, it won’t make it into the bundled code. With React, it is your choice to include an add-on library, such as React Transition Group, to do this for you. While D3 has a module for transitions, it is preferable to let the UI framework handle it.
Finally, Svelte removes some constraints that you can encounter with frameworks that build components on top of JavaScript. You can write more idiomatic JavaScript in Svelte, which can make it easier to integrate with other libraries such as D3. As Rich Harris says:
Because we’re not bound to the peculiarities of JavaScript, we can design a component authoring experience, rather than having to fit it around the semantics of the language. Paradoxically, this results in more idiomatic code — for example, using variables naturally rather than via proxies or hooks — while delivering significantly more performant apps.
If you have experience with React, we can mitigate the cons through informed decision-making, but I think getting these benefits for “free” is compelling enough reason to consider Svelte instead. It is important to understand the differences and constraints to make the best decision for your project.
Now that we have a general overview of why you might use Svelte and D3 together, let’s show how to build data visualization.
I will use the Svelte REPL, the basic code playground for Svelte. Let’s start with a relatively simple example: a bar chart with minimal code. Keep in mind that if you just need to create a bar chart, there are simpler and more efficient ways to do it (Charts.css is a CSS-only solution). D3 shines when you want to have total control over a chart or you want to create a custom data visualization.
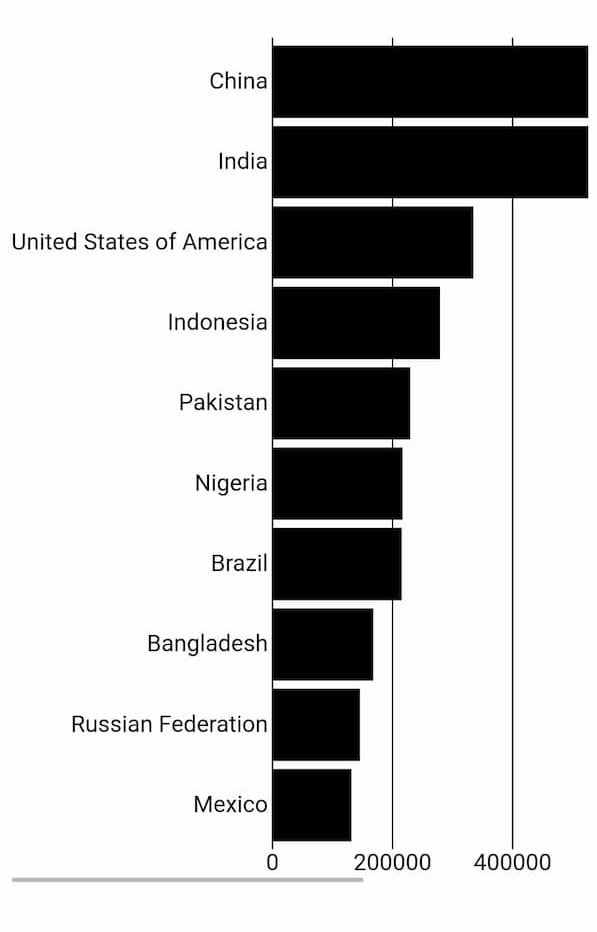
I will create a horizontal bar chart showing the top ten most populous countries in 2019, as shown below. Here is a link to the example in the Svelte REPL.
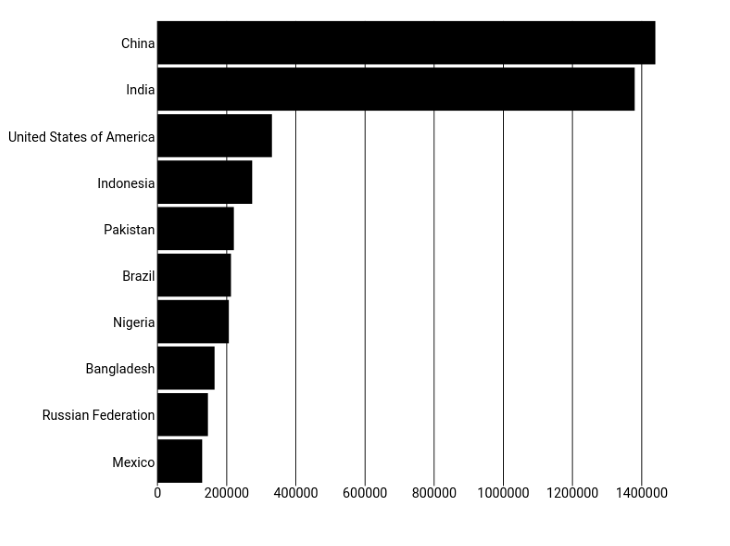
To keep it simple, I will not add CSS (hence the somewhat boring appearance), and I will make the size of the chart fixed.
We’ll use population data sourced from the United Nations World Population Prospects. I will put the 2019 population data in a separate file called 2019.js .
// 2019.js
export default [
    { country: "China", population: 1439324 },
    { country: "India", population: 1380004 },
    { country: "United States of America", population: 331003 },
    { country: "Indonesia", population: 273524 },
    { country: "Pakistan", population: 220892 },
    { country: "Brazil", population: 212559 },
    { country: "Nigeria", population: 206140 },
    { country: "Bangladesh", population: 164689 },
    { country: "Russian Federation", population: 145934 },
    { country: "Mexico", population: 128933 },
]
We will create a BarChart component that will display this data as a horizontal bar chart.
App.svelteIn App.svelte, we use our BarChart component and pass our data as a prop. We use the Svelte shorthand for the data prop. If a prop name and the name of the value are the same, you can write the prop as {data} instead of data={data}.
<script>
  import data from "./2019.js";
  import BarChart from "./BarChart.svelte";
</script>

<BarChart {data} />
BarChart.svelteWe want to create a BarChart component that has a data prop.
<script>
  import { scaleBand, scaleLinear } from "d3-scale";

  export let data;

  const width = 800;
  const height = 600;

  const margin = { top: 20, right: 20, bottom: 20, left: 180 };
  const innerHeight = height - margin.top - margin.bottom;
  const innerWidth = width - margin.left - margin.right;

  $: xDomain = data.map((d) => d.country);
  $: yDomain = data.map((d) => +d.population);

  $: yScale = scaleBand().domain(xDomain).range([0, innerHeight]).padding(0.1);
  $: xScale = scaleLinear()
    .domain([0, Math.max.apply(null, yDomain)])
    .range([0, innerWidth]);
</script>

<svg {width} {height}>
  <g transform={`translate(${margin.left},${margin.top})`}>
    {#each xScale.ticks() as tickValue}
      <g transform={`translate(${xScale(tickValue)},0)`}>
        <line y2={innerHeight} stroke="black" />
        <text text-anchor="middle" dy=".71em" y={innerHeight + 3}>
          {tickValue}
        </text>
      </g>
    {/each}
    {#each data as d}
      <text
        text-anchor="end"
        x="-3"
        dy=".32em"
        y={yScale(d.country) + yScale.bandwidth() / 2}
      >
        {d.country}
      </text>
      <rect
        x="0"
        y={yScale(d.country)}
        width={xScale(d.population)}
        height={yScale.bandwidth()}
      />
    {/each}
  </g>
</svg>
D3 has a modular design, so you only need to include the modules you require — spare your user the extra kilobytes of JavaScript! In our case, we need the d3-scale module (scales in the figure below) to map our data values to pixels for the scales and bars of our bar chart.
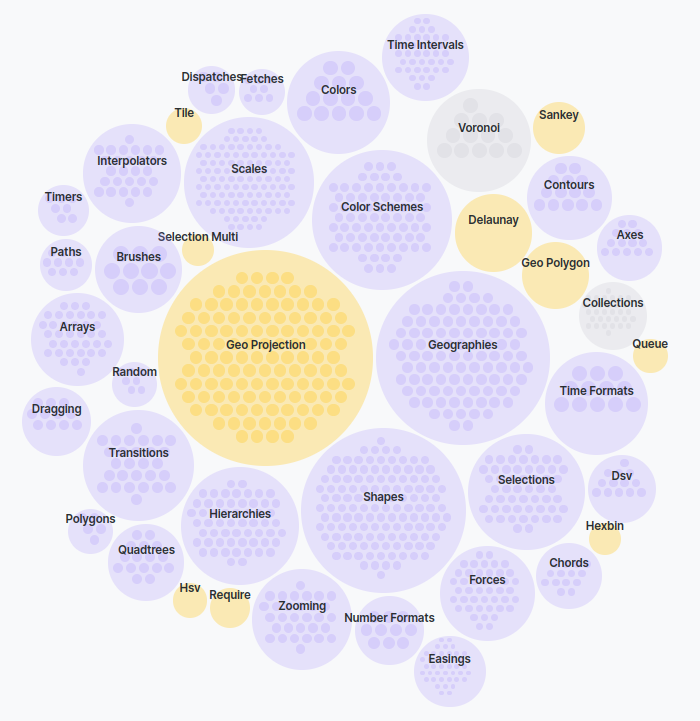
You can import and use the D3 module using the standard ESM syntax. Here, the Svelte REPL downloads the module for me. If you want to include it in your project, you can download it using your preferred package manager, such as npm.
Next, we declare our data prop. In Svelte, props are declared with the export keyword, followed by the variable declaration. By omitting a default value, we are forcing the provision of the prop. We want data! 😀
export let data;
Next, write some code to set the variables for dimensions and create our own scale functions to facilitate mapping our data values to positions. Notice that this code is the same as regular D3 code, but with one exception: for some of our variables, we precede them with a dollar sign to tell the Svelte compiler that these statements are reactive.
Any time there is a new value passed to the data prop, we want our bars and axes to be re-calculated, and, by marking these statements as reactive, they will be re-evaluated when any of the dependent variables change.
Now, we create our SVG by hand. We declare each SVG element we need and use our scale functions inside the properties of our SVG elements to set the position and dimensions where needed. We use an each block to iterate through our data array to create the ticks for the Y-axis and the rectangles for each bar.
In less than 50 lines of code, you get a readable, reusable bar chart component. Of course, it can be improved and styled, but I will leave that to you!
If you are curious and want to compare the code side-by-side, you can find live examples here:
You will want to adjust the size of your visualization to make the most of the screen real estate available. If your data visualization is based on SVG, you can usually avoid having to resize things explicitly, given that SVG is inherently scalable. With the Canvas API, you need to explicitly resize (redraw) the elements.
To revisit our previous example, there is a maximum and minimum width that we would like the bar chart to be. We may want it to scale up on larger screens, but we wouldn’t want it to shrink for mobile screens, as it will be way too squashed.
It would be preferable to give the bar chart a minimum width and make it horizontally scrollable if it does not fully fit on the screen, like the screenshot below.
This is the adjusted example that allows the bar chart to vary in width from 600px to 1200px:
<!-- App.svelte -->
<script>
  import data from "./2019.js";
  import BarChart from "./BarChart.svelte";
</script>

<div class="container">
  <BarChart {data} />
</div>

<style>
   :global(.chart) {
      width: 100%;
      min-width: 600px;
      max-width: 1200px;
    }

  .container {
    overflow-x: auto;
  }
</style>
We set the width, min-width, and max-width on the BarChart component with a global style on the chart class. We wrap BarChart in a containing div, which we set overflow-x:auto that will add a horizontal scrollbar only when necessary (when the screen width is less than 600px).
Just a note on the height of the SVG: in this case, the height is fixed at 600px, which works fine because we want the X-axis to always be visible. The height is fixed because we set the height attribute on the SVG and did not set any height-related properties in CSS.
If you want the SVG to scale according to an aspect ratio, you can use the viewBox and preserveAspectRatio attributes. When there is a viewBox, preserveAspectRatio describes how the SVG should scale if the aspect ratio of the viewBox doesn’t match the aspect ratio of the viewport.
Most of the time, the default behavior works pretty well: the image is scaled until it just fits both the height and width, and it is centered within any extra space. This is the default if you omit the attribute altogether.
<!-- BarChart.svelte -->
<script>
  import { scaleBand, scaleLinear } from "d3-scale";

 //same code as before
</script>

<svg viewBox={`0 0 ${width} ${height}`}>
  <!--code omitted for brevity-->
</svg>
If you use the viewBox on its own as above, it is scaled down so that you can see more of the bar chart:
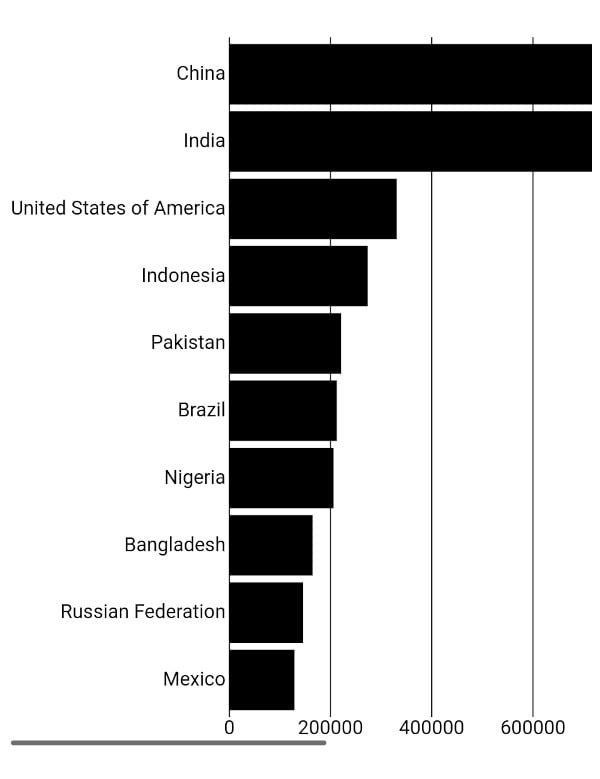
More often than not, viewBox delivers a preferable result by default. I recommend reading this article to learn more about this topic.
If you want to resize elements of a visualization based on the dimensions of a particular element, Svelte provides some convenient built-in dimension bindings. The following bindings are available for every block-level element: clientWidth, clientHeight, offsetWidth, and offsetHeight.
These bindings are read-only, so you would only use these as inputs inside other statements. These are expensive operations, so do not use them too often.
A transition is triggered by an element entering or leaving the DOM because of a state change.
Svelte provides seven transition functions: fade, blur, fly, slide, scale, draw, and crossfade. To use any of these functions, you need to import them from the svelte/transition module, and you can add them to an element through the transition directive. The syntax is transition:fn={params}, and the parameters are optional.
<p transition:fade>Fades in and out</p>
Pass the parameters in an object with the optional properties: duration, easing, and delay.
Let’s look at a quick example of a line graph. Say we want to use the draw transition to draw the line in two seconds.
We need to add transition:draw={{duration: 2000}} to the path element.
<script>
   import { draw } from 'svelte/transition';

   // props
   export let data;
   export let show;

  //other code
</script>

<svg viewBox="0 0 100 100">
   {#if (show)}
    <path transition:draw={{duration: 2000}} d={pathLine(data)} />
   {/if}
</svg>
Here is the complete example.
Transitions are reversible — if you toggle the checkbox while the transition is ongoing, it transitions from the current point rather than the beginning or end.
By default, the transition will not play on the first render. So, if you remove the if block in this example, you will not see a transition when the page loads. You can change this behavior by setting the initialization option intro to true when you create a component, as below.
//main.js
import App from "./App.svelte";

const app = new App({
  target: document.getElementById("app"),
  intro: true,
});

export default app;
With data visualization, you control when an element is added through the in directive and when an element is removed through the out directive. So, you can create more nuanced transitions.
Here is an example of using the transitions to shift the bars in the bar chart when the dataset changes. By adding the attribute out:slide="{{duration: 1000}}" to the rect element, we get the following effect:
Pretty cool, huh?
You can do plenty more and even make your own custom transitions, too.
I find I learn the most by exploring complete examples. You, too, may prefer to sink your teeth straight into meatier examples!
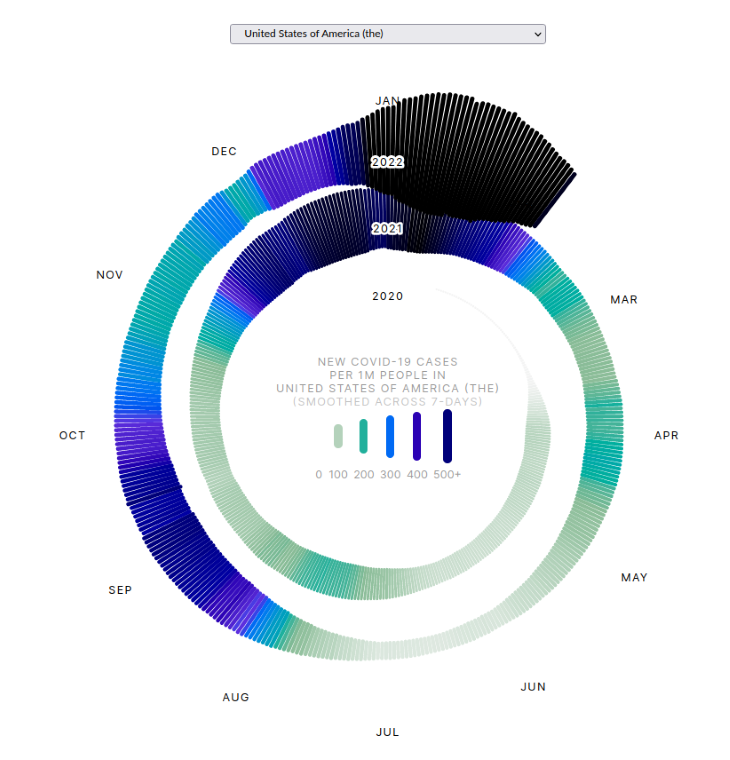
Amelia Wattenberger has shared some Svelte data viz recipes, which are mostly complete examples, and they are a nice size. This is an excellent example of a spiral graph showcasing the trend of covid cases over time for different countries.
Amelia also appeared on an episode of Frontend Horse recently, where she created a chart using superhero data for Alex Trost’s Supervillain PR Agency website.
Also, Matthias Stahl has an informative talk on Svelte and D3, where he showcases what makes Svelte and D3 such a good fit for data visualization. He has some advanced examples which he features in the talk, including:
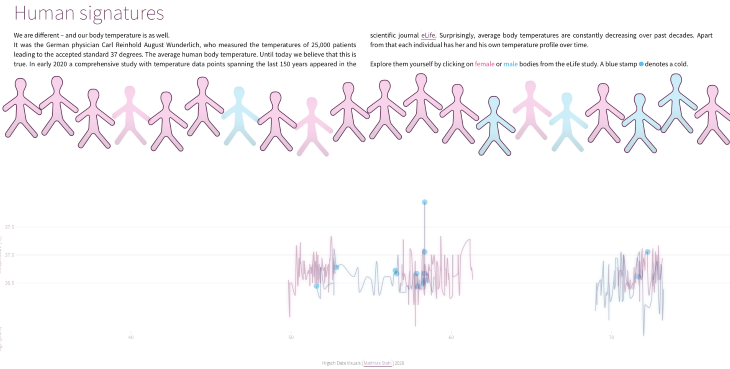
Human signatures (code): Based on a comprehensive study of human body temperature data spanning the last 150 years, this visualization shows the profile of average body temperatures for a selection of men and women. You can click on the bodies to view their temperatures as a line graph over their lifespan.
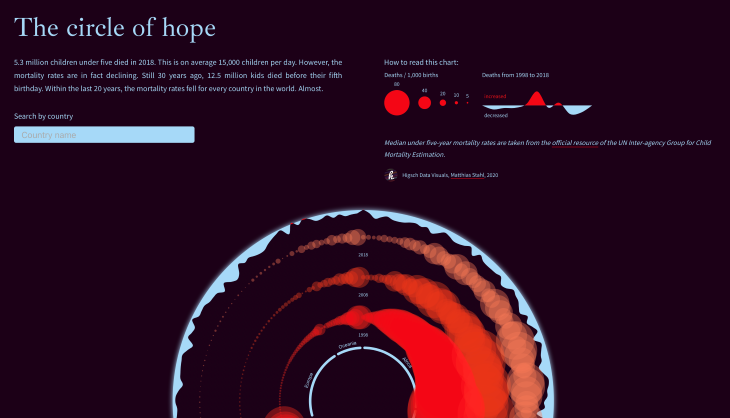
Childhood mortality (code): This visualization showcases how the death rates of children aged 5 or younger are declining. It shows the death rates for each country over the past 20 years in repeating concentric patterns of interleaved circles, showing the magnitude of the values for the different years. You can hover over segments to highlight a specific country’s data. Matthias uses canvas for the more data-intensive aspects of the visualization, and SVG for the smaller accompanying charts. It is a good example of how you optimize a more complex data visualization.
I hope that I have shown the advantages of using Svelte and D3 together for data visualization. It leads to more declarative code and componentized code that developers have become accustomed to but without sacrificing performance.
I have given a solid introduction here and provided more examples to help you on the path to creating more complex, custom data visualizations. Have fun and make some data beautiful! 🌈📊
Install LogRocket via npm or script tag. LogRocket.init() must be called client-side, not
server-side
$ npm i --save logrocket

// Code:

import LogRocket from 'logrocket';
LogRocket.init('app/id');
// Add to your HTML:

<script src="https://cdn.lr-ingest.com/LogRocket.min.js"></script>
<script>window.LogRocket && window.LogRocket.init('app/id');</script>

Learn how to build a full React Native auth system using Better Auth and Expo — with email/password login, Google OAuth, session persistence, and protected routes.

Compare the top AI development tools and models of June 2026. View updated rankings, feature breakdowns, and find the best fit for you.
Learn how Bloom filters reduce database lookups for username availability checks while preserving correctness at scale.

Learn how to test Nuxt apps with Vitest, @nuxt/test-utils, runtime mocks, server route mocks, and Playwright e2e tests.
Would you be interested in joining LogRocket's developer community?
Join LogRocket’s Content Advisory Board. You’ll help inform the type of content we create and get access to exclusive meetups, social accreditation, and swag.
Sign up now