The speed and responsiveness of network communications are crucial parts of modern-day web technology.

Whether browsing a website, accessing a cloud service, or interacting with an API, users expect a seamless experience. A key metric that directly impacts this experience is round-trip time (RTT).
RTT is a fundamental network performance metric for measuring latency between a client and a host. Essentially, it is the time it takes for a data packet to travel from a source to a destination and back again:
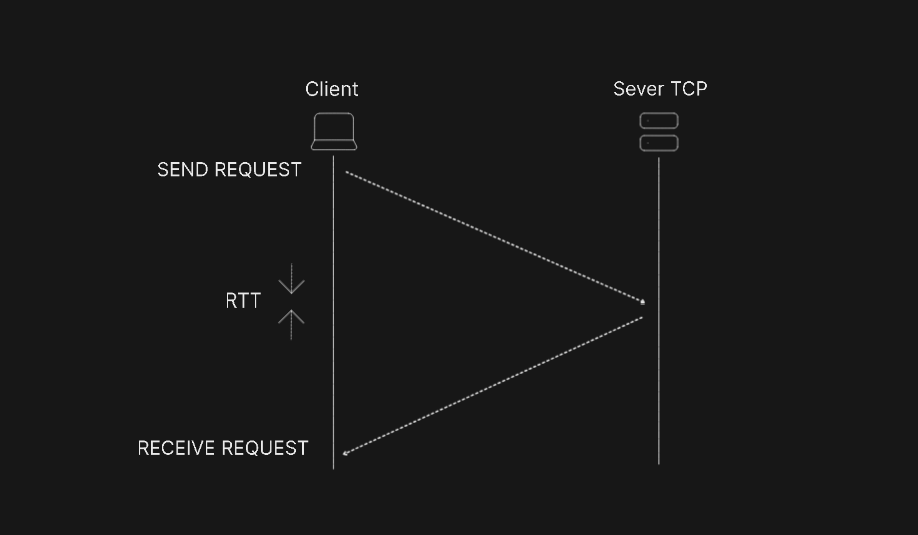
RTT measurements can reveal critical insights about network latency, response time, and potential bottlenecks. These measurements can benefit developers and network administrators, as they play a significant role in diagnosing performance issues and ensuring optimal application responsiveness, which is essential in delivering a positive user experience.
In this article, I’ll guide you through the steps to measure round-trip time using cURL, a transfer tool used to transfer data from or to a server. We’ll also look at different RTT techniques and advanced usage and compare cURL to other available tools.
Tools like Ping and Traceroute are commonly used to measure network latency. While these tools offer a simple and straightforward way of measuring RTT metrics, they provide very little and sometimes vague information and are limited to basic data transfers.
In contrast, cURL supports multiple data transfer protocols, which lets it measure real HTTP transactions and provide timing data that accurately reflects actual user experiences. This makes cURL particularly useful for developers, system administrators, and DevOps engineers who need to:
Now, let’s compare RTT metrics from cURL and Ping:
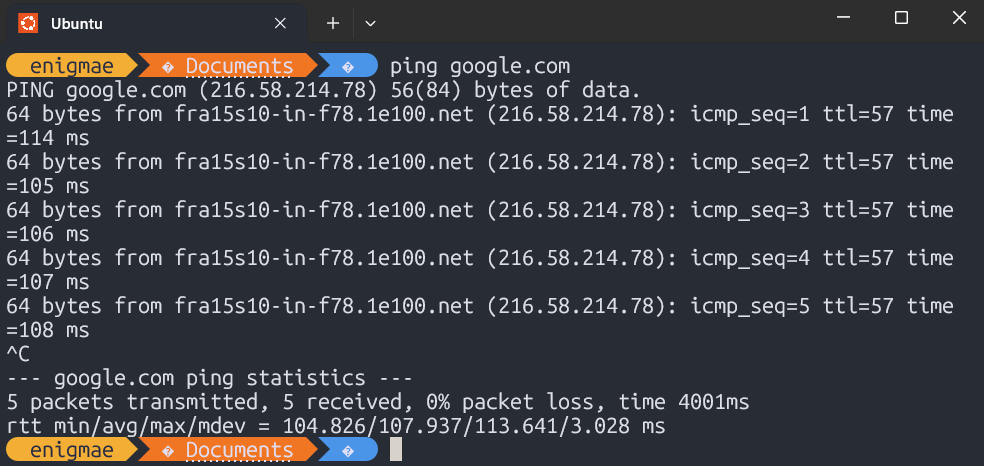
As you can see, cURL provides a more detailed and comprehensive output than Ping. While each tool has its use cases, cURL is your best bet if you need an in-depth measurement of your application’s RTT.
As explained in the previous section, round-trip time measurement in cURL consists of multiple distinct components that contribute to the total time of a request. Let’s break them down:
DNS resolution is often the first step in making an HTTP request. The process involves looking up the domain name in the local cache, querying DNS servers if not cached, and retrieving the target domain’s IP address.
After DNS resolution, the TCP three-way handshake occurs:
SYN packet sent to the serverSYN-ACKACKThese may look alien to you, but they essentially describe the process by which a client and host initiate a connection.
Simply put, when a connection is established, the client sends a SYN (Synchronize) packet to the host. The server receives the SYN and replies with a SYN-ACK (Synchronize-Acknowledgment). If everything goes well, the client receives the server’s SYN-ACK and sends an ACK (Acknowledge).
You can learn more about the TCP three-way handshake on the MDN docs.
TTFB measures the time between sending an HTTP request and receiving the first byte of the response. This metric measures the:
This is the total time taken for the entire data transfer, from request initiation to completion. It includes all phases of the request mentioned earlier. You can think of this as the variable that outputs the overall RTT measurement.
Understanding these components will help you identify bottlenecks and devise performance optimization strategies based on which component is causing delays.
For example, a high DNS resolution time might indicate issues with the DNS server, network configuration problems, or the need for DNS caching improvements. On the other hand, a long TTFB could point to application code inefficiency, network congestion, or the need for database query optimization.
Now that we understand what round-trip time is and how cURL uses multiple protocols to measure this metric, let’s look at some basic uses of cURL for RTT measurement.
Before diving into the nitty gritty of RTT measurement, you must ensure cURL is properly installed on your machine.
Most Unix-like systems, such as Linux and macOS, come with cURL pre-installed. For Windows users, you can download it from the official cURL website or install it via Chocolatey using the following command, assuming you have Chocolatey installed on your machine:
choco install curl
To verify your installation, open a terminal and run:
curl --version
The simplest way to measure response time with cURL is using the -w (write-out) flag with timing parameters such as time_total:
curl -w "\nTotal time: %{time_total} seconds\n" -o /dev/null -s http://www.example.com
This command contains -w.
This flag is the key to measuring RTT in cURL. It enables a write-out format string that cURL uses to output specific variables related to the request. These variables capture different stages of the connection and data transfer, which gives you a breakdown of the overall request time.
%{time_total}This is a timing variable that represents the total time taken for the entire request, from the initial request, until the complete response is received. There are several other variables, we’ll explore more on them later in this article.
-o /dev/null (optional)This is a command that tells cURL to discard the response body it fetches by default.
-s(optional)This suppresses the progress meter and lets the RTT operation run in silent mode.
If you run this command against an actual server URL, say Bing at https://www.bing.com, the response will look something like this:
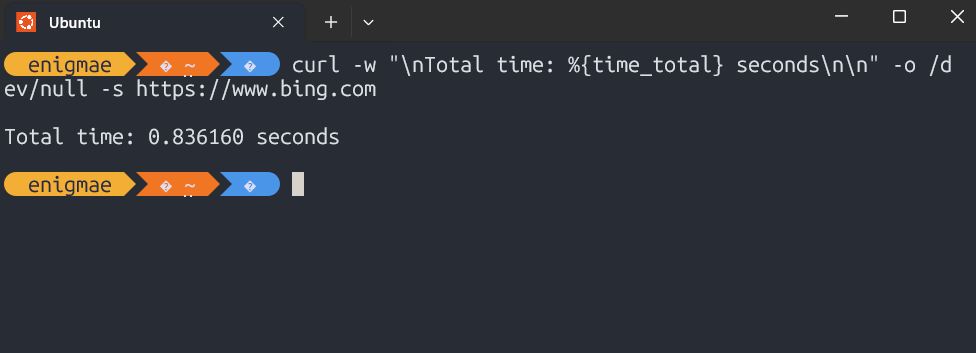
The request takes 0.836160 seconds (approximately 836ms) to resolve. Remember, the -s flag lets RTT operate in silent mode, which is why we get a result as simple as the one shown in this example. If you remove the -s flag, here’s what you’ll see:
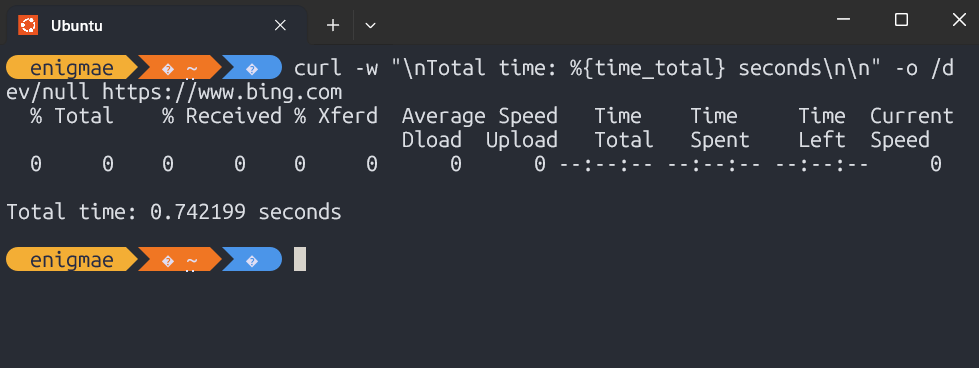
The result remains similar, with the only difference being that the progress is displayed.
For detailed timing information, we can customize the format string to include any combination of timing variables, along with descriptive labels:
curl -w "\nDNS: %{time_namelookup}s\nConnect: %{time_connect}s\nTTFB: %{time_starttransfer}s\nTotal: %{time_total}s\n" \
     -o /dev/null -s https://bing.com/
This command will connect cURL to https://www.bing.com and then output the values of the time_connect, time_starttransfer, and time_total timing variables with descriptive labels, followed by a newline character (\n):
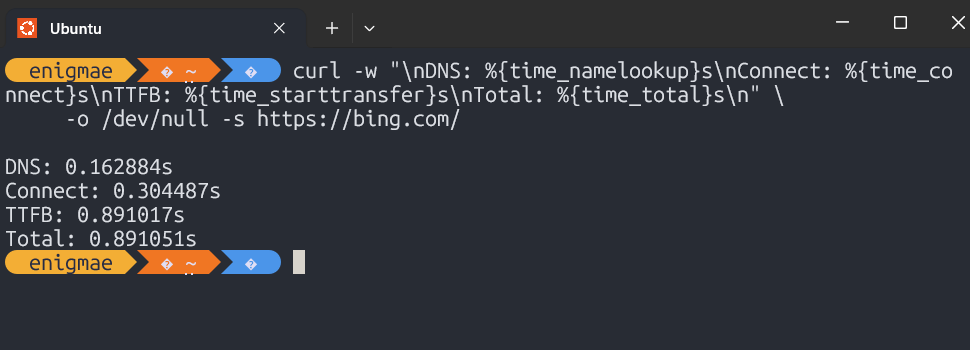
As you can see from the example above, these variables represent the RTT components we discussed earlier:
time_namelookup — DNS resolution timetime_connect — TCP connection timetime_starttransfer — TTFBtime_total — Total Transfer TimecURL RTT commands can get lengthy, and writing them out every time you need to run a test can be tedious. Thankfully, timing options can be defined in custom format files for automated monitoring.
Let’s suppose you want to measure an RTT metric using multiple timing variables:
    DNS Lookup:        %{time_namelookup}s
    TCP Connection:    %{time_connect}s
    TLS Handshake:    %{time_appconnect}s
    Server Processing: %{time_pretransfer}s
    Content Transfer:  %{time_starttransfer}s
    Total Time:       %{time_total}s
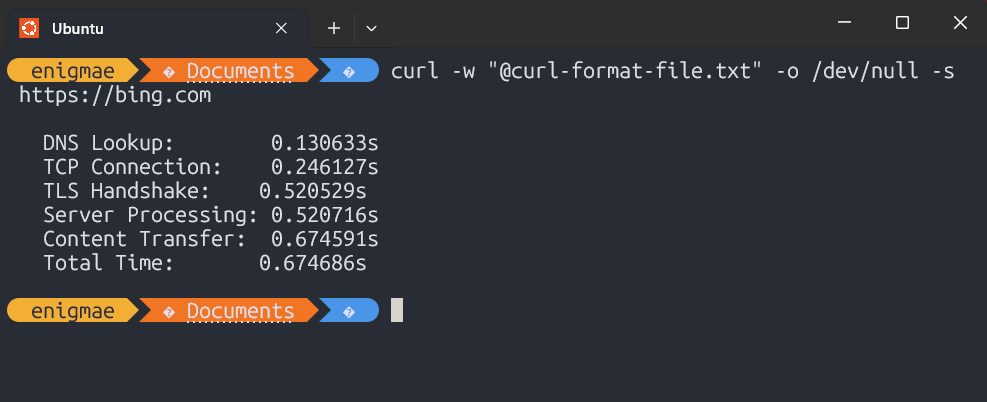
Typing them in the command-line tool one by one would not only become tedious but also time-consuming. Instead, you can create a custom .txt file, add the variables, and then use it with cURL like so:
curl -w "@curl-format.txt" -o /dev/null -s https://bing.com
This way, you don’t have to type out all the timing variables every time you need to measure RTT metrics. Note that you need to be in the same directory as the created file for this to work without any issues.
When benchmarking, it’s important to account for network variations and other factors that may impact measurement results in order to obtain an accurate average response time. This cannot be achieved with a single RTT request. But instead of repeatedly running the measurement request manually, you can create a loop to run the request a specified number of times:
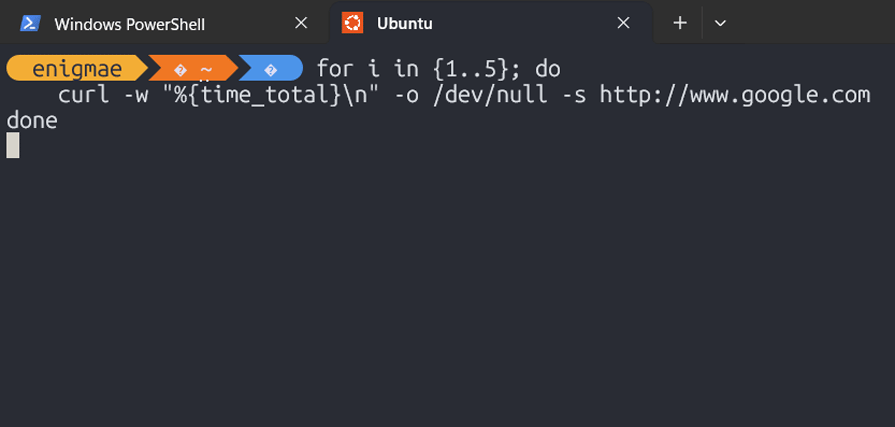
for i in {1..5}; do
    curl -w "%{time_total}\n" -o /dev/null -s http://www.google.com
done
This for loop block will run the curl command five times and output five different RTT results. You can then use these outputs to calculate the average response time of the measurement:
For many developers, the primary interest in running RTT measurement analysis is testing servers and APIs for comprehensive insight into their performance and status. For this purpose, measuring connection timing and transfer timing alone, as we’ve done in the previous section, is simply not sufficient.
By combining the timing options we’ve used previously with other advanced cURL timing options, you can gain deeper insights into the different phases of the network transaction and understand the performance of your server’s HTTP requests. This will allow you to break down the process into distinct segments, which can be vital for diagnosing latency issues.
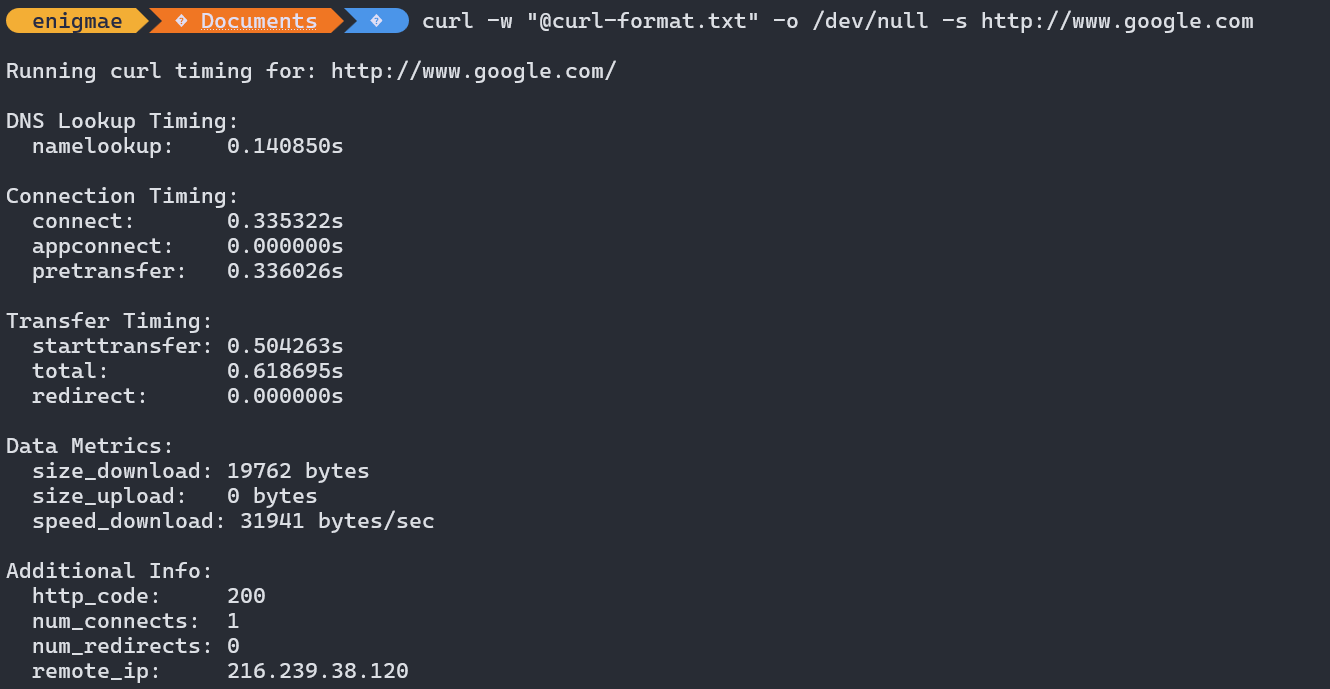
This is what an advanced custom file for cURL timing options should look like:
\n
Running curl timing for: %{url_effective}

DNS Lookup Timing:
  namelookup:    %{time_namelookup}s

Connection Timing:
  connect:       %{time_connect}s
  appconnect:    %{time_appconnect}s
  pretransfer:   %{time_pretransfer}s

Transfer Timing:
  starttransfer: %{time_starttransfer}s
  total:         %{time_total}s
  redirect:      %{time_redirect}s

Data Metrics:
  size_download: %{size_download} bytes
  size_upload:   %{size_upload} bytes
  speed_download: %{speed_download} bytes/sec

Additional Info:
  http_code:     %{http_code}
  num_connects:  %{num_connects}
  num_redirects: %{num_redirects}
  remote_ip:     %{remote_ip}
\n
We’ve added additional timing options that capture the request’s data metrics and extra information such as the HTTP status, remote IP, and more.
This outputs a very detailed and comprehensive RTT measurement:
Additionally, we can use several headers and options provided by cURL to enhance our timing analyses. For example, we can use the User-Agent header to mimic a web browser for testing servers that block requests without a valid User-Agent header due to security reasons.
Headers are specified using the -H flag followed by the header option string. Here’s how you can modify your command to add the User-Agent header:
curl -w "@curl-format.txt" -o /dev/null -s http://www.google.com -H 'User-Agent: Mozilla/5.0 (Macintosh; Intel Mac OS X 10_11_4) AppleWebKit/537.36 (KHTML, like Gecko) Chrome/50.0.2661.86 Safari/537.36'
Let’s break down what this User-Agent string represents:
Mozilla/5.0 — A common identifier for compatibilityMacintosh; Intel Mac OS X 10_11_4 — Indicates the operating system (macOS 10.11.4)AppleWebKit/537.36 — The rendering engine used by Safari and ChromeChrome/50.0.2661.86 — The browser version (Chrome 50)Safari/537.36 — Indicates Safari compatibilityHere’s a list of some headers you can use to enhance your RTT measurements:
-H 'Accept-Encoding: gzip, deflate, sdch' — This header allows the server to compress and reduce the amount of data transferred over the network using a compression algorithm the client can understand-H 'Upgrade-Insecure-Requests: 1' — Signals to the server that the client prefers to use HTTPS instead of HTTP for insecure resources-H 'Connection: keep-alive' — Requests that the connection remains open after the request is completedThe timing options we’ve used so far are enough to give you proper insight into how well your server is performing, but what if you want to test API endpoints?
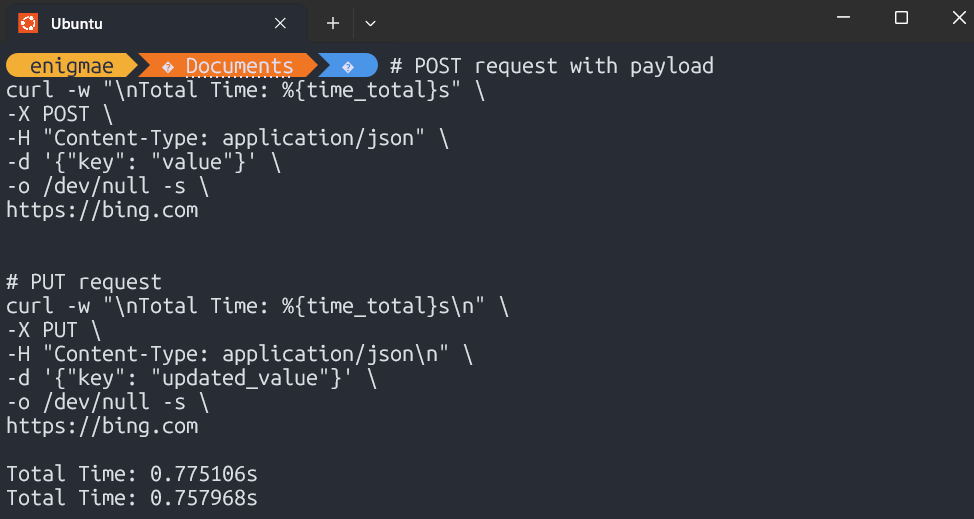
You can test individual endpoints with the detailed timing configurations we’ve demonstrated and obtain vital information such as HTTP status. However, you can take it a step further by testing the RTT for different HTTP methods, such as POST and PUT:
# POST request with payload
curl -w "\nTotal Time: %{time_total}s" \
-X POST \
-H "Content-Type: application/json" \
-d '{"key": "value"}' \
-o /dev/null -s \
"https://bing.com"

# PUT request
curl -w "\nTotal Time: %{time_total}s\n" \
-X PUT \
-H "Content-Type: application/json\n" \
-d '{"key": "updated_value"}' \
-o /dev/null -s \
"https://bing.com"
To test more HTTP methods, replace the -X flag’s value with any other HTTP method:
When doing an RTT test, a likely use case would be to test your server or web application against another to determine their performance. This comparison will help identify which application provides faster response times and better overall efficiency.
This can be achieved by creating a script such as the one below:
#!/bin/bash

function measure_rtt() {
    local url=$1
    local count=$2

    echo "Measuring RTT for $url ($count requests)"
    echo "----------------------------------------"

    for ((i=1; i<=$count; i++)); do
        curl -w "%{time_total}" -o /dev/null -s "$url"
        echo ""
    done
}

# Compare urls
urls=(
    "https://api.example.com/endpoint1"
    "https://api.example.com/endpoint2"
)

for url in "${urls[@]}"; do
    measure_rtt "$url" 5
    echo ""
done
The script iterates over an array of URLs and calls the measure_rtt function with each URL and a count of five requests. For each URL, the RTT measurement is performed five times.
Here’s an output of a comparison between Google and Bing:
This test shows that bing.com has a higher response time than google.com in my region.
Assessing how your application or server performs from various points around the globe is a crucial part of benchmarking. This is because it allows you to identify regional performance issues and make data-driven decisions to enhance the efficiency and responsiveness of your application.
cURL provides a --resolve option that lets you simulate accessing a domain from a specific DNS resolver by forcing cURL to resolve the domain to a specific IP address:
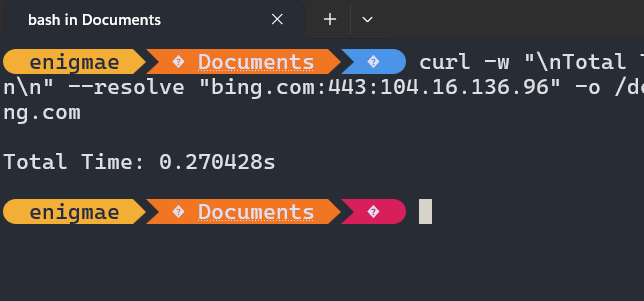
curl -w "\nTotal Time: %{time_total}s\n\n" \
--resolve "bing.com:443:1.2.3.4" \
-o /dev/null -s \
"https://www.bing..com"
This command will force cURL to resolve bing.com to the IP address 1.2.3.4, which is a placeholder for the specified port 443, which must match the protocol being used (i.e. 443 for HTTPS, 80 for HTTP).
To use this command, replace:
bing.com with the domain you want to test1.2.3.4 with the IP address you want to force the domain to resolve to443 with the appropriate protocolFor example, if we resolve bing.com to a Cloudflare CDN in Kenya, the result will look something like this:
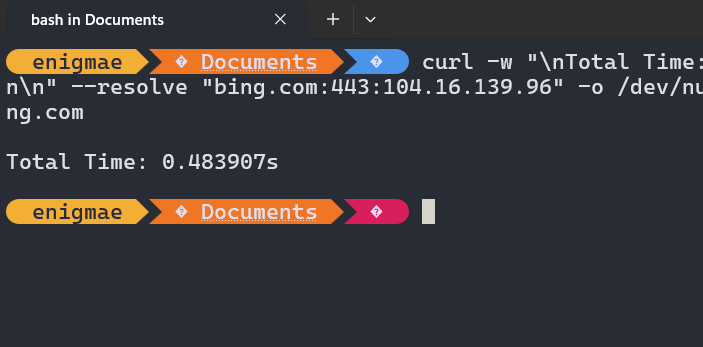
Meanwhile, if we resolve it to a CDN in Brazil, we’ll get a very different result:
Although cURL does come off as a one-size-fits-all solution for RTT and network diagnostics, you shouldn’t be quick to dismiss other network diagnostic tools. This is because they provide different perspectives on network performance and can help you verify and cross-check cURL’s results.
As mentioned earlier, these tools have distinct functionalities, so let’s compare them to curl:
Ping sends ICMP echo request packets to a target host and measures the time it takes for the response to be received. Think of ICMP echo requests as a type of network message used primarily for diagnostic purposes.
However, unlike cURL, Ping primarily measures the time it takes for basic network-level communication. It doesn’t provide information about higher-level protocols like HTTP or HTTPS. It also doesn’t capture the time taken for server-side processing.
Ping and cURL serve different purposes and operate at different layers of the network stack, so they cannot be directly integrated into a single command or tool. However, you can use them together in a script or workflow to achieve combined functionality.
You can do this by creating a comparison script that outputs results for both Ping and cURL simultaneously:
#!/bin/bash
compare_network_tools() {
local host=$1
echo "Network Diagnostic Comparison for $host"
echo "----------------------------------------"
# Ping Statistics
echo "Ping Results:"
ping_result=$(ping -c 5 "$host" | grep -E "time=|packet loss")
echo "$ping_result"
# Curl Timing
echo -e "\nCurl Timing:"
curl_result=$(curl -w "DNS: %{time_namelookup}s\nConnect: %{time_connect}s\nTotal Time: %{time_total}s" \
-o /dev/null -s "$host")
echo "$curl_result"
}
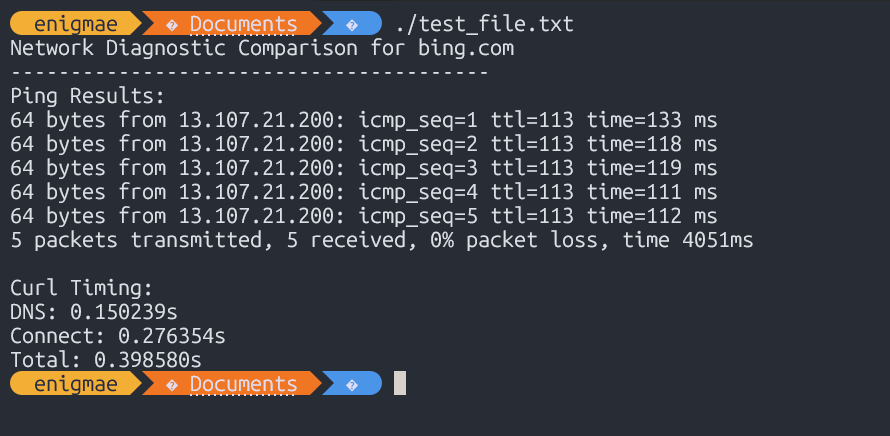
compare_network_tools bing.com
The resulting output:
Traceroute traces the path that packets take from the source to the destination. It identifies each step along the way and provides information about the routers involved in the connection and the time taken for packets to reach each point.
Similarly, Traceroute can be used alongside cURL in a script or workflow to diagnose network issues. If cURL measurements indicate high RTT, Traceroute can help pinpoint the specific network segments or routers contributing to the delay:
#!/bin/bash

advanced_network_diagnostics() {
    local target=$1

    # Traceroute with AS (Autonomous System) mapping
    echo "Network Path Trace:"
    traceroute -A "$target"


    # Curl timing for correlation
    echo -e "\nCurl Performance:"
    curl -w "Total Time: %{time_total}s\nDNS: %{time_namelookup}s\n" \
         -o /dev/null -s "$target"
}

advanced_network_diagnostics bing.com
These tools may not be on par with cURL in terms of functionalities, but their distinct nature makes them excellent complementary tools for understanding network behavior.
In this article, we explored how to effectively use cURL to measure round-trip time. We covered the fundamental concepts of RTT, its impact on network performance, and its role in ensuring a responsive user experience.
We also examined how you can use cURL’s write-out (-w) flag to run RTT requests and extract detailed information on various stages of the request-response cycle, including time_connect,time_starttransfer, and time_total, to gain comprehensive insights into the performance of a host and the time it takes to respond to a client’s request.
Finally, we explored advanced timing techniques to enhance RTT requests for more comprehensive results, and compared cURL to similar tools for running RTT requests. Hope you found it useful!

Learn how to use Fallow to analyze AI-generated code, detect dead code, duplicate logic, and complexity issues, and integrate automated code quality checks into your AI-assisted development workflow.

Learn how to protect full-stack projects from NPM supply chain attacks with a practical security checklist.

Explore 15 essential MCP servers for web developers to enhance AI workflows with tools, data, and automation.

Learn how contrast-color() automatically picks accessible text colors using native CSS, without JavaScript.
Hey there, want to help make our blog better?
Join LogRocket’s Content Advisory Board. You’ll help inform the type of content we create and get access to exclusive meetups, social accreditation, and swag.
Sign up now