If you’ve worked with charting libraries before, you might be familiar with a few popular ones like D3.js, Chart.js, or ApexCharts. These libraries allow us to programmatically draw basic charts like bar charts, line charts, and histograms, as well as advanced charts like scatter plots. However, a common function that these libraries lack or provide minimal support for is creating flowcharts.

In this tutorial, we’ll explore GoJS, a JavaScript library for building interactive charts, by creating simple and complex flowcharts. Let’s get started!
Our example uses a CodePen with GoJS; you can create your own to follow along.
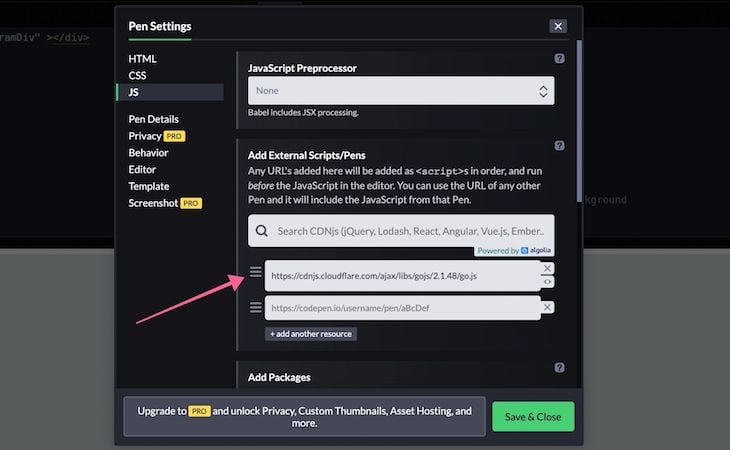
First, let’s import the GoJS library into our CodePen. Click on the Settings button, then go to the JS section. Under Add External Scripts/Pens, search for GoJS and add the CDNjs library for GoJS, which pops up as a suggestion:
Now, we’ll get a placeholder, or a playground, for plotting our charts. In the HTML section, create a div:
<div id="diagramDiv"></div>
Let’s provide the div with an equal height and width to the viewport:
#diagramDiv {
  width: 100vw;
  height: 100vh;
  background-color: #dae4e4;
}
Now, we should see a grey area where we can begin plotting our chart, which we’ll write in the JavaScript panel of the CodePen.
With the library imported, let’s create a basic chart in our CodePen. First, we’ll get a reference to the library function and store it in the $ variable, similar to accessing the jQuery library using the $ symbol:
var $ = go.GraphObject.make;
Next, we’ll initialize a Diagram in the same area that we set as a playground in the previous section.
var myDiagram = $(go.Diagram, "diagramDiv");
The code above initializes a new GoJS Diagram in the div. Its ID is diagramDiv. Now, we’ll initialize a basic GoJS model with three elements and set it as the Diagram model:
myDiagram.model = new go.Model(
  [
    { key: "Bob" },
    { key: "Alice" },
    { key: "Emma" }
  ]);
A minimal Diagram will appear in the div that looks like the image below:

Now that we’ve created a basic Diagram, let’s take a closer look at the fundamentals of GoJS so we can implement more complex charts.
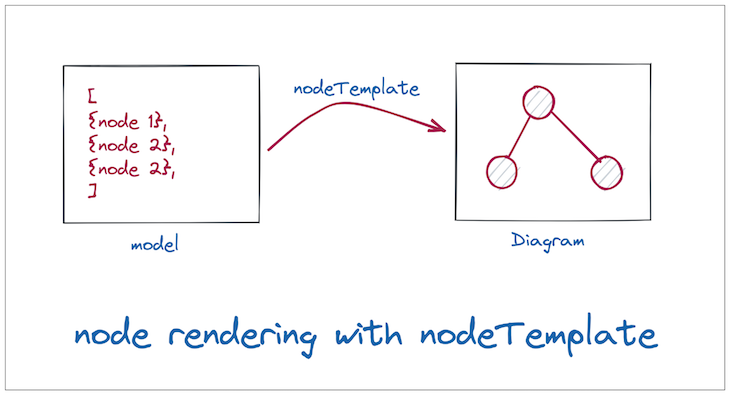
A Diagram refers to the complete chart that is plotted using GoJS. A Diagram has models and Nodes. It might also use node templates, which define how the model should be rendered on the Diagram.
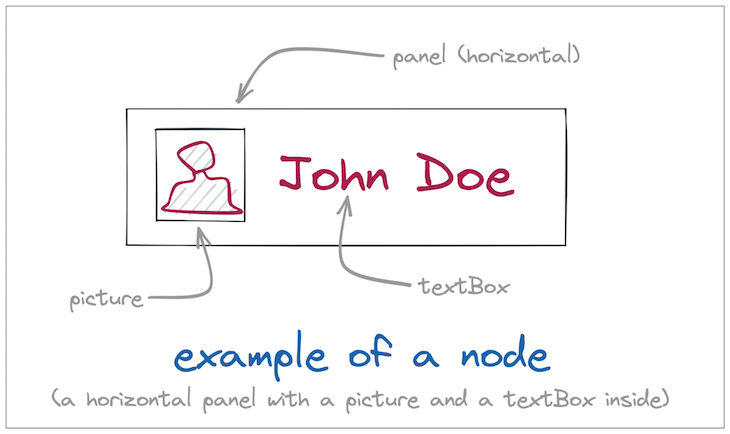
A Node is an entity that represents a single element rendered in the Diagram. Each item in the model translates roughly to one Node on the Diagram. As independent units inside of a Diagram, Nodes are what we see and interact with.
In GoJS, we have the following four types of Nodes:
Shape: displays custom or predefined geometric shapes and adds styling like color and textureTextBlock: shows text on the DiagramPicture: displays an image in a DiagramPanel: organizes other Nodes into specific arrangementsA Node could also have a child node within it, for example, a TextBlock within a Shape.
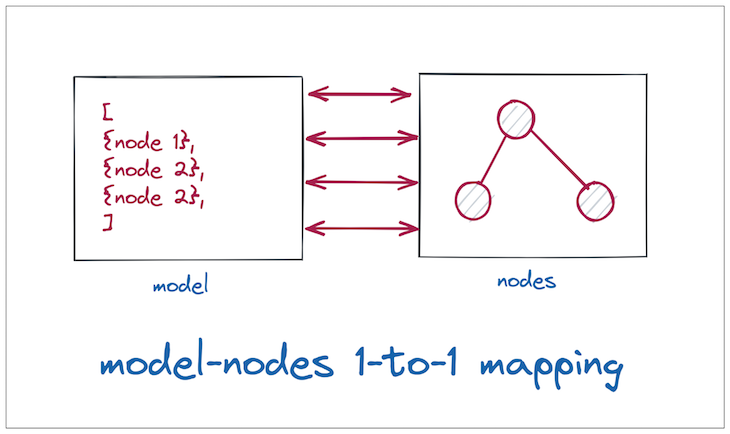
A model is the data representation of the chart that is plotted in the Diagram. In our previous example, the model consisted of just three elements. However, in real-world scenarios, most graphs would be far more complex with more Nodes, each having several keys and forming complex relationships among themselves:
Whenever we create a chart, we are actually creating a Diagram and displaying Nodes in that Diagram. We have a few different ways to create Nodes in GoJS.
For instance, we can use the go.Node, go.Shape, and go.TextBlock functions separately, which will return objects of the same type. Then, we can add the properties that we expect these Nodes to have:
var shape = new go.Shape(); // create a shape
shape.figure = "RoundedRectangle"; // set the geometry
shape.fill = "red"; // set the color
var node = new go.Node(go.Panel.Auto); // creates a node
node.add(shape); // add the shape to the node
However, linking between Nodes in this manner is verbose, causing the Diagram to become too large.
go.GraphObject.makeGoJS defines the GraphObject.make method, a special constructor function that we can use to create any type of Node, supply the Node properties in the constructor, and supply the inner Nodes as nested arguments to create a Node hierarchy.
Let’s make a call to the GraphObject.make method:
go.GraphObject.make(
        Type_of_node,
        Node_properties,
        Node_children)
Now, we’ll add a reference to the GraphObject.make method in the $ symbol to improve code readability. We can simplify the code above into the following:
var $ = go.GraphObject.make; // get reference to make method
diagram.add(
  $(go.Node, go.Panel.Auto, // create a go.Node
    $(go.Shape, // create a go.Shape inside of it
      { figure: "RoundedRectangle", // geometry of the
        fill: "red" }),
  ));
nodeTemplateWe can further simplify our code with the nodeTemplate method, which we’ll use to define the appearance of all the Nodes in our graph.
Let’s create a nodeTemplate with the Nodes that we defined in the previous section:
diagram.nodeTemplate(
        // the definition of how every nodes should look like
);
Next, we simply define the model, and GoJS will apply the same template to all the Nodes in the Diagram. GoJS searches for the keys mentioned in go.Binding and replaces them with the corresponding values from the defined model. Let’s see this in action!
Now that we understand how GoJS works, let’s build a complex chart. We’ll create a tree chart that classifies all of the positions in a company.
To follow along, here is our final CodePen.
See the Pen
by kapeel kokane (@kokanek)
on CodePen.
First, we’ll get the reference to the GraphObject.make method, then create a Diagram and attach it to the class that we set aside:
var $ = go.GraphObject.make;
var myDiagram = $(go.Diagram, "diagramDiv");
Next, we’ll use the nodeTemplate method to define the appearance of each node in the Diagram. We’ll display job title along with the employee’s name.
Let’s create a nodeTemplate with two TextBlock elements:
myDiagram.nodeTemplate = $(
  go.Node,
  "Horizontal",
  { background: "tomato" },
  $(
    go.TextBlock,
    {
      text: "a Text Block",
      background: "yellow",
      margin: 12,
      font: "bold 16px sans-serif"
    },
    new go.Binding("text", "title")
  ),
  $(
    go.TextBlock,
    "Default Text",
    { margin: 12, stroke: "white", font: "bold 16px sans-serif" },
    new go.Binding("text", "name")
  )
);
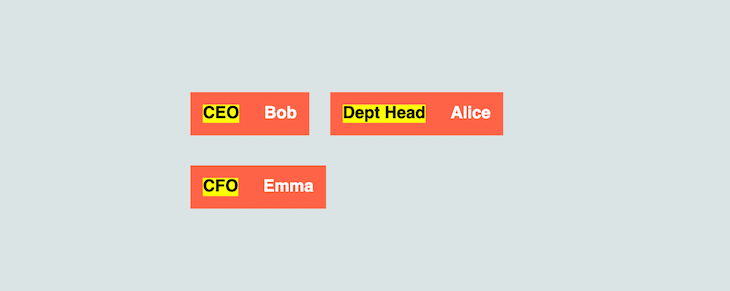
Our two TextBlock elements are in a binding with the name and the title keys from the model:
myDiagram.model = new go.Model([
  { name: "Bob", title: "CEO" },
  { name: "Alice", title: "Dept Head" },
  { name: "Emma", title: "CFO" }
]);
When we render our Diagram, it will look like the image below:
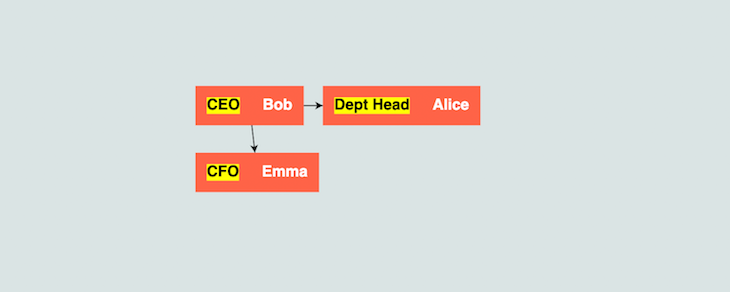
With our Nodes created, the next step is to define links between them by adding a key and a parent attribute in the model. Once the link is specified, GoJS will draw the links from the parent key to the child key for us:
myDiagram.model = new go.TreeModel([
  { name: "Bob", title: "CEO", key: "1" },
  { name: "Alice", title: "Dept Head", key: "2", parent: "1" },
  { name: "Emma", title: "CFO", key: "3", parent: "1" }
]);
Notice that we are now creating a go.TreeModel instead of go.Model. Now, when we render our Diagram, it will look like the image below:
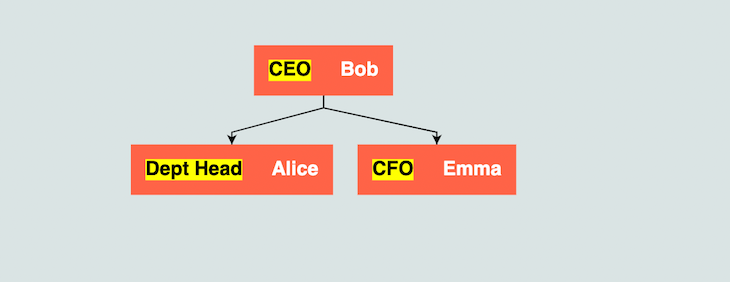
To arrange our Diagram in a proper hierarchy, we can provide a layout property, which will lay the Nodes out in a level-by-level manner:
var myDiagram = $(go.Diagram, "diagramDiv", {
  layout: $(
    go.TreeLayout,
    { angle: 90, layerSpacing: 40 }
  )
});
Now, our Diagram looks like the image below:
Let’s add some more employees to our model, adding the proper keys and parents:
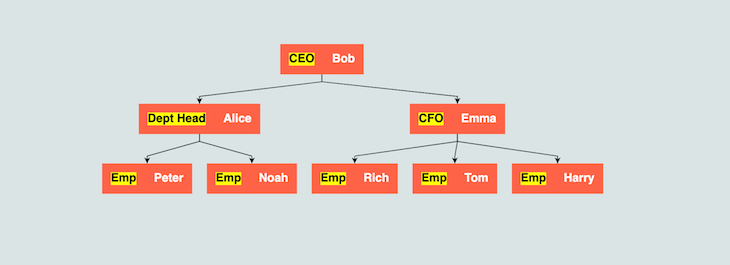
Keep in mind that this is not a rendered image. It is a fully interactive chart, meaning we can click the Nodes, drag and drop them, and more!
Now, you know how to create a complex flowchart in JavaScript using GoJS. In this tutorial, we covered installing the GoJS library, setting up Nodes, and finally, defining the links between Nodes.
With so many possible configuration options and customizations, GoJS is definitely one of the most exhaustive libraries out there. In this tutorial, we’ve only scratched the surface.
Other layouts besides the tree layout include directed, circular, and layered diagrams. GoJS also includes other features like brushes and animation that will enhance the look of your graphs.
There’s no doubt that frontends are getting more complex. As you add new JavaScript libraries and other dependencies to your app, you’ll need more visibility to ensure your users don’t run into unknown issues.
LogRocket is a frontend application monitoring solution that lets you replay JavaScript errors as if they happened in your own browser so you can react to bugs more effectively.
LogRocket works perfectly with any app, regardless of framework, and has plugins to log additional context from Redux, Vuex, and @ngrx/store. Instead of guessing why problems happen, you can aggregate and report on what state your application was in when an issue occurred. LogRocket also monitors your app’s performance, reporting metrics like client CPU load, client memory usage, and more.
Build confidently — start monitoring for free.
Learn how to protect full-stack projects from NPM supply chain attacks with a practical security checklist.

Explore 15 essential MCP servers for web developers to enhance AI workflows with tools, data, and automation.
Learn how contrast-color() automatically picks accessible text colors using native CSS, without JavaScript.

Learn how to build a harness-style AI workflow using Claude Code with specialized Dev, QE, and Ops subagents, gated handoffs, MCP telemetry, and LEARNING.md.
Would you be interested in joining LogRocket's developer community?
Join LogRocket’s Content Advisory Board. You’ll help inform the type of content we create and get access to exclusive meetups, social accreditation, and swag.
Sign up now