
The Replay is a weekly newsletter for dev and engineering leaders.
Delivered once a week, it's your curated guide to the most important conversations around frontend dev, emerging AI tools, and the state of modern software.
DigitalOcean is a platform that gives developers a place to host their applications. They offer both the humble Virtual Private Server (VPS), which they refer to as “droplets,” as well as more advanced products, like load balancers and managed databases. We will discuss all of the above in the subsequent sections.
To follow along with this guide you’ll need to create a DigitalOcean account. You’ll also need to create a GitHub account if you don’t already have one. Since I’m a Node.js developer, this guide will make use of a basic Node.js service (Docker), although it can be easily adapted to work with whatever platform you’re more familiar with.
By the end of this demo, you will create two $5/mo. droplets, one $10/mo. load balancer, and a free container registry. DigitalOcean charges by the hour for these products, so once you build everything and get it working, you can choose to immediately tear down the infrastructure and only have to pay a few dollars.
Take a look at the infrastructure we are going to build:

Once everything is done, you will have a GitHub action that automatically deploys the main branch of your repository to both the api-1 and api-2 droplets.
In a normal build, this would incur some amount of downtime, as one service will be down as the new code is deployed, and there is a non-zero amount of time it takes for the health checks to determine if a service is down. With this guide, however, you will learn to deploy in a way that results in no downtime. And, while this example uses services running on two droplets, you could easily scale it to three or more.
In this section, we’ll review a high-level explanation of the approach covered in this document, which can be adapted to many platforms, not just DigitalOcean. For example, if you wanted to use HAProxy as a load balancer to route requests to two Golang processes all on a single beefy server, you could absolutely do so.
Below is a timeline of the operations that will take place. We will go into much more detail about the api-1 instance than the api-2 instance to save space, though the two will go through the same process:
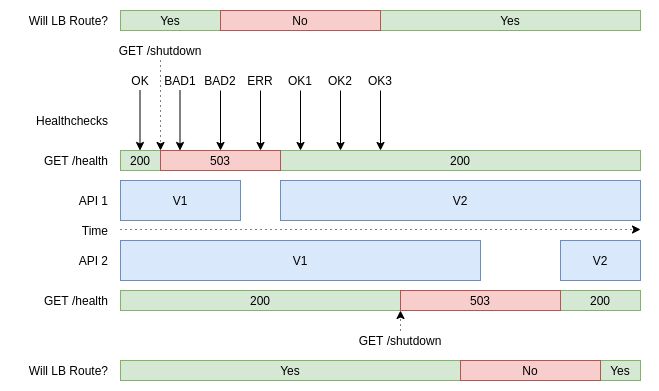
In the above graphic, the x-axis represents time and moves from the left to the right. When the deployment process first starts there are two service instances running, API 1 and API 2, which both run V1 of the codebase. While this is happening, the load balancer is sending health checks to both of them to make sure they’re able to receive requests.
Eventually, a deployment will happen which results in the shutdown endpoint getting called. From then on, the health checks will fail. Note that even though the health check is failing, the service is still able to handle requests and is still being routed traffic. Once two checks fail, that server instance is removed from the load balancer, replaced with V2 of the codebase, and brought back up. After three health checks pass, the load balancer starts routing requests to the instance again. Once that is done, the deployment process will continue to the next service instance.
On a high level, there are two important pieces of information to take away from the above:
Equipped with that knowledge, you are now ready to move on to our specific DigitalOcean guide.
Tokens allow applications to interact with the DigitalOcean API on your behalf. For this example they’ll be used so that a GitHub build server can push Docker images to the container registry, and so that your droplets can pull from the container registry.
Visit the DigitalOcean API Settings page and generate two new tokens. Name the first “GitHub Actions” and the second “Droplet Registry Pull.” Both can be set to read and write access for this example. Take note of these API tokens as you’ll need them for later.
These tokens should remain a secret from third parties. We’re using two tokens so that if one gets compromised then it can be deleted without affecting the other.
When communicating with servers over SSH, it is much more secure to use an SSH key than it is to use a password. For that reason, you’ll now generate an SSH key (which is longer and more random than a password) for accessing the droplets.
Using an SSH key will allow you to manually connect and perform some initial setup, and will also let GitHub transfer files to the droplets as well.
To generate an SSH key, run the following command:
$ ssh-keygen -t rsa -f ~/.ssh/api-droplets
# leave password blank
This command will create two key files. The first is located at ~/.ssh/api-droplets and is your private key which you should not share with third parties. The second file is located at ~/.ssh/api-droplets.pub and is the public key. This one you can be less stingy with.
Using the DigitalOcean interface, create two droplets.
When doing so you’ll be prompted to provide some details. For the distribution choose Debian 10. For the plan choose Basic $5/mo. For the datacenter option, choose the datacenter that’s closest to you, and make sure the load balancer you create later is in the same datacenter. I chose SFO2 for myself.
In the authentication section, click the New SSH Key button. Give the SSH key a name like Droplet SSH Key, and paste in the contents of the ~/.ssh/api-droplets.pub file into the SSH key input, then click Add SSH Key. Set the number of droplets to create to 2.
For the host names, call them api-1 and api-2. Finally, tag both of the droplets with a new tag named http-api. This tag will later be used by the load balancer to match requests to the droplets.
Once you’ve created the droplets you should see them listed in the interface like so:

The IP address listed here is the public IP address of your droplet. These addresses uniquely identify your droplets on the internet. Using these IP addresses, you’ll now SSH into the two droplets from your development machine.
Run the following command for your first droplet:
$ ssh root@<DROPLET_IP_ADDRESS> -i ~/.ssh/api-droplets
# for first connection, type 'yes' and press enter
Once you’re connected, you’ll need to do a couple things.
First, install Docker on the VPS. This will be used to encapsulate and run your application. You’ll also need to install the doctl binary and authenticate with it, which allows the VPS to interact with DigitalOcean. To perform this setup, run the following command:
$ sudo apt install curl xz-utils
# type 'y' and press enter
$ curl -fsSL https://get.docker.com -o get-docker.sh && sh get-docker.sh
$ wget https://github.com/digitalocean/doctl/releases/download/v1.54.0/doctl-1.54.0-linux-amd64.tar.gz
$ tar xf ~/doctl-1.54.0-linux-amd64.tar.gz
$ mv doctl /usr/local/bin/
$ doctl auth init
# Paste the <DROPLET_REGISTRY_PULL_TOKEN> and press enter
$ exit
As a reminder, you will need to run these sets of commands on both of your droplets, so once you exit, run the ssh command again for the second droplet’s IP address. This is just a one-time bootstrapping process that you will not have to return to later.
Now that you have created your droplets, the next step you’ll want to take it to create a load balancer using the DigitalOcean UI. For this demo, the Small $10/mo option is fine. As noted earlier, make sure it is located in the same region where you created your two droplets.
In the “Add Droplets” field, type in the tag http-api and click the result to dynamically match your droplets. The option to forward HTTP from port 80 to port 80 is sufficient for this project.
Edit the advanced settings to configure the health check endpoints. Normally the load balancer makes a request to the / endpoint, but this project needs a dedicated endpoint just for the health checks.
To set up this dedicated endpoint, change the “Path” to /health, set the “Unhealthy Threshold” to 2, and set the “Healthy Threshold” to 3. Your configuration should now look like this:

Name your load balancer something catchy and easy to remember. In my case, I’ve chosen sfo2-api.
Once you save your load balancer you should see it listed in the UI. My load balancer looks something like this (notice that 0 of the 2 matched droplets are healthy because the server is not running on them):

As was the case with the droplets, the IP Address is the unique IP address that identifies your load balancer. At this point in time you can make a request to your load balancer from your development machine to ensure that it works. Run the following command in your terminal:
$ curl -v http://<LOAD_BALANCER_IP_ADDRESS>/
When you do this you should get back an HTTP 503 Service Unavailable error, with a response body saying “No server is available to handle this request.” This is expected; at this point in our process, there are no healthy servers.
Next, you will create a container registry using the DigitalOcean UI. This is where the Docker images get stored.
By default, you’re limited to 500MB of free storage, which is plenty for this experiment. For larger projects you’ll outgrow this number pretty quickly. Indeed, the first deploy of this project consumes about 300MB of storage, although additional deployments only add a couple of megabytes.
When you create the registry you’ll need to give it a unique name. In this example, I’ve chosen the name foo, but you’ll need to choose something that’s globally unique across all DigitalOcean customers.
To continue setting up our zero-downtime deployment with DigitalOcean, we will use the GitHub UI to create a new repository.
Configure a local directory to point to the repository. Be sure to use the new main branch convention instead of master. The GitHub new repository screen provides all the commands you need to do this.
Once that’s done, add the following files to the repository:
.github/workflows/main-deploy.ymlGitHub actions make use of the .github/workflows/ directory to find descriptions of the various actions to be used by the project. For example, you might have a file in there that describes the actions to perform when a Pull Request is made, like running a linter and some tests.
In this case, you only need a single file to describe the deployment process when code is merged to the main branch. Use the following file as a template, noting that you will want to replace <REGISTRY_NAME> with the name of your DigitalOcean registry, like the foo value that I went with.
name: Deploy to Production
on:
  push:
    branches:
      - main
  # Allows you to run this workflow manually from the Actions tab
  workflow_dispatch:
jobs:
  build:
    runs-on: ubuntu-latest
    steps:
      - name: Check Out Repo
        uses: actions/checkout@v2
      - name: Install DigitalOcean Controller
        uses: digitalocean/action-doctl@v2
        with:
          token: ${{ secrets.DIGITALOCEAN_ACCESS_TOKEN }}
      - name: Set up Docker Builder
        uses: docker/setup-buildx-action@v1
      - name: Authenticate with DigitalOcean Container Registry
        run: doctl registry login --expiry-seconds 180
      - name: Build and Push to DigitalOcean Container Registry
        uses: docker/build-push-action@v2
        with:
          context: .
          push: true
          tags: |
            registry.digitalocean.com/<REGISTRY_NAME>/api:latest
            registry.digitalocean.com/<REGISTRY_NAME>/api:sha-${{ github.sha }}

  deploy-api-1:
    needs: build
    runs-on: ubuntu-latest
    steps:
      # Droplets already have docker, doctl + auth, and curl installed
      - name: Deploy api to DigitalOcean Droplet
        uses: appleboy/[email protected]
        with:
          host: ${{ secrets.DO_API1_HOST }}
          username: root
          key: ${{ secrets.DO_API_KEY }}
          port: 22
          script: |
            doctl registry login --expiry-seconds 180
            docker pull registry.digitalocean.com/<REGISTRY_NAME>/api:latest

            echo "calling shutdown endpoint..."
            curl --silent http://localhost/shutdown || true

            echo "giving healthcheck time to fail..."
            sleep 30 # ((unhealthy + 1) * interval)

            docker stop api || true
            docker rm api || true

            echo "starting server instance..."
            docker run -d \
              --restart always \
              -p 0.0.0.0:80:80 \
              --name api \
              registry.digitalocean.com/<REGISTRY_NAME>/api:latest

            echo "giving healthcheck time to recover..."
            sleep 40 # ((healthy + 1) * interval)

            curl --silent --fail http://localhost/health

  deploy-api-2:
    needs: deploy-api-1 # rolling deploy
    runs-on: ubuntu-latest
    steps:
      # Droplets already have docker, doctl + auth, and curl installed
      - name: Deploy api to DigitalOcean Droplet
        uses: appleboy/[email protected]
        with:
          host: ${{ secrets.DO_API2_HOST }}
          username: root
          key: ${{ secrets.DO_API_KEY }}
          port: 22
          script: |
            doctl registry login --expiry-seconds 180
            docker pull registry.digitalocean.com/<REGISTRY_NAME>/api:latest

            echo "calling shutdown endpoint..."
            curl --silent http://localhost/shutdown || true

            echo "giving healthcheck time to fail..."
            sleep 30 # ((unhealthy + 1) * interval)

            docker stop api || true
            docker rm api || true

            echo "starting server instance..."
            docker run -d \
              --restart always \
              -p 0.0.0.0:80:80 \
              --name api \
              registry.digitalocean.com/<REGISTRY_NAME>/api:latest

            echo "giving healthcheck time to recover..."
            sleep 40 # ((healthy + 1) * interval)

            curl --silent --fail http://localhost/health
This file contains three jobs. The first is build, which will build the docker container inside of an Ubuntu virtual machine. It also tags the container and pushes it to your container registry.
The deploy-api-1 and deploy-api-2 jobs also run in an Ubuntu virtual machine, but they do all of their work over SSH. Specifically, they connect to your droplets, pull the new docker image, tell the service to shut down, and wait for the health checks to fail. After that, the old container is removed, and a new container based on the new image is started.
With the new container started, a new health check will be and run. Just to be safe, the health check endpoint will also be called. That way, if the call fails, the job will fail and any subsequent deploys won’t happen.
Admittedly, a glaring problem with this file is that the entire contents for each deployment are copied and pasted, and while it is possible to convert these into composable/reusable GitHub actions, that’s a guide for another day.
DockerfileThis file describes how to build the Docker image. It’s about as simple as it gets and isn’t necessarily production ready, but is good enough for this example:
FROM node:14

EXPOSE 80

WORKDIR /srv/api
ADD . /srv/api

RUN npm install --production

CMD ["node", "api.mjs"]
This image is based on the Node.js 14 LTS line. It hints that the internal service listens on port 80. Application code is copied to the /srv/api/ directory inside the image. It then does a production install before finally running the api.mjs file.
.dockerginoreThis file lists the files and directories that shouldn’t be copied into the image:
.git
.gitignore
node_modules
npm-debug.log
test
The most important line here is the one for the node_modules/ directory. It’s important because those files should be generated during the image build process, and not copied from your OS.
.gitignoreThis file is mostly to keep node_modules/ from getting committed:
node_modules
npm-debug.log
api.mjsThis file represents a very simple API that will be available behind a load balancer, and is the entry point to the service:
#!/usr/bin/env node

import fastify from 'fastify';
const server = fastify();
let die = false;
const id = Math.floor(Math.random()*1000);

server.get('/', async () => ({ api: 'happy response', id }));

server.get('/health', async (_req, reply) => {
  if (die) {
    reply.code(503).send({ status: 'shutdown' });
  } else {
    reply.code(200).send({ status: 'ok' });
  }
});

server.get('/shutdown', async () => {
  die = true;
  return { shutdown: true };
});

const address = await server.listen(80, '0.0.0.0');
console.log(`listening on ${address}`);
The GET / route mostly shows that the service is able to run by generating a random number to act as an identifier. This number will remain consistent throughout the lifetime of the instance.
The GET /health is what the load balancer uses to know if the application is healthy and able to receive requests. The GET /shutdown sets the die variable to true. Once that happens, any subsequent requests to GET /health will now return an unhappy 503 status code. This is the mechanism that allows us to gracefully declare that a service should be dropped from the load balancer.
package.json and package-lock.jsonThese two files can be generated by running the following commands:
$ npm init -y
$ npm install fastify@3
This creates the node_modules/ directory and creates the two package files. Those package files will later be used during the Docker build process to download the necessary package files from the npmjs.com package repository.
To run your deployment, you will also need to create some GitHub project secrets. These are variables that can be used by the GitHub Action YAML files.
To create your project secrets, go to the settings tab for the GitHub project and add four entries.
Your first entry will be DIGITALOCEAN_ACCESS_TOKEN. This is the value of the GitHub Actions access token that you generated in a previous step.
Your second entry will be DO_API_KEY. This will be the contents of the ~/.ssh/api-droplets private key file that you previously generated. Be careful when pasting the content as you’ll want to make sure the newlines are preserved.
Finally, you will add two entries, DO_API1_HOST, and DO_API2_HOST. These will both contain the IP address of the two API droplets that you created. Your secrets screen should now looks like this:
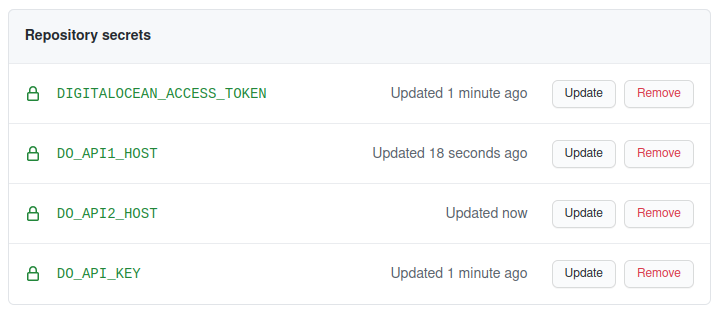
All four of these secret names are referenced in the GitHub Action YAML file that you previously created.
To run your first deploy, follow these steps:
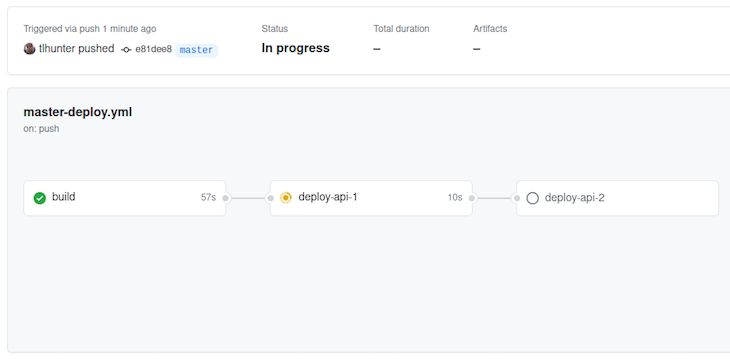
If you get a failure at this stage in the process, you may need to modify a previous step.
If there’s a problem with the code you transcribed, then modify it and commit it again to the main branch. This will automatically kick off another build.
If you need to change a GitHub secret, then go and change it using the GitHub UI – just know that this won’t start another deployment. Instead, visit the Actions tab again, click the “Deploy to Production” button on the left, and use the “Run workflow” dropdown on the right to start the build again from the main branch.
In our example, you can see that after build is successfully completed, at step two, api-1 is deployed. The next step, which is to deploy api-2, hasn’t happened yet because it is waiting for api-1 to complete. If the deployment were to fail then api-2 would not get deployed. This gives you time to fix any problems and to deploy a fix. Moreover, if any of these steps were to fail you could click on them to get more information.
The DigitalOcean graphs for the load balancer display the health of the application over time, and in my experience, polls the health of the application every minute.
Depending on the timing, you might see that one service goes down and then up, and the other goes down and then up. If you wait several minutes after deploying the first change, then trigger another deployment, you should be able to see the effects in the DigitalOcean graphs.
Here’s what happened in my case:

The Downtime graph clearly shows app-1 (green) having downtime. The other app-2 (brown) wasn’t polled at the right moment to cause the graph to spike. The Health checks graph shows that app-2 was affected slightly.
The build step pushes Docker images to your container repository. Each time this happens the image is tagged twice; once containing the latest tag, and another containing the git commit hash of the main branch when the build happened.
This is what my container registry looks like after performing two builds:
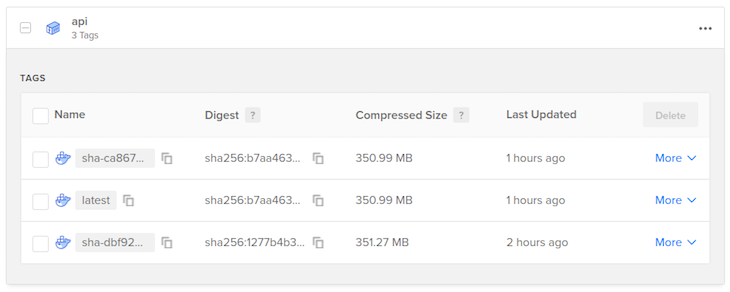
The latest tag is replaced with each build. This is the tag that is used to deploy the docker images to production. The tag using the commit hash is just a convenience to show you that it’s working. A more robust system could use that to rollback deploys to previous commits.
At this point in our project, you have now got a service that automatically deploys to production when code is merged to the main branch. Best of all, it does so in such a way that future deployments should result in zero downtime!
Now, you’re ready to prove that the application is running in a redundant manner. You can do so by running the following command a few times:
$ curl http://<LOAD_BALANCER_IP_ADDRESS>/
# {"api":"happy response","id":930}
$ curl http://<LOAD_BALANCER_IP_ADDRESS>/
# {"api":"happy response","id":254}
In the response, you should see that two different id values are returned. With each request you make, the returned id should alternate. This is because the load balancer is configured to route requests using the “round-robin” algorithm by default.
If one of your servers were to crash, then it would be removed from the rotation. With the configuration of the health checks it might take between 11 and 20 seconds for the load balancer to realize that one of the instances is down. During that time, 50 percent of the requests being sent to the load balancer would fail. More aggressive health checks can reduce this time, but it’s difficult to build a system that is 100 percent resilient to failure.
Of course, passing around IP Addresses isn’t all that convenient, but you can configure DNS settings for a domain to point to the IP address. Again, another guide for another day.
All things considered, this is a fairly brief guide, intended only to show you how to achieve zero-downtime deployments. It glosses over many important details, especially with regards to security. Without being comprehensive, here are some additional steps that you should take to make your infrastructure more secure:
:80. Instead listen on a different port on 127.0.0.1 (local interface) only. Note that currently, anyone can call http://<LOAD_BALANCER_IP>/shutdown to disable a droplet.healthcheck endpoint to something that is more difficult to guessFinally, keep in mind that the API services listen on 0.0.0.0 (all interfaces), so a client could bypass the load balancer by requesting the Droplet IP directly. Remember that each droplet exposes two network interfaces, one public and one private, and that the Node.js services should listen on the private interface, where the load balancer can reach.
In a normal build, deployment usually incurs some amount of downtime. In this guide, we have reviewed how to use DigitalOcean, GitHub, and Docker to deploy in such a way that results in zero downtime and is scalable for services running on two droplets or more.
Install LogRocket via npm or script tag. LogRocket.init() must be called client-side, not
server-side
$ npm i --save logrocket

// Code:

import LogRocket from 'logrocket';
LogRocket.init('app/id');
// Add to your HTML:

<script src="https://cdn.lr-ingest.com/LogRocket.min.js"></script>
<script>window.LogRocket && window.LogRocket.init('app/id');</script>

Learn about TypeScript v6’s breaking changes, new ES2025 features, and deprecated options. A complete migration guide from v5 to prepare for v7.

Learn how Vite+ unifies Vite, Vitest, Oxlint, Oxfmt, Rolldown, and Node.js management in one CLI.

AI companies are buying developer tools as coding agents turn runtimes, package managers, and linters into strategic infrastructure.
Learn how AI-assisted development governance uses rules, agents, hooks, and protocols to help AI coding tools produce safer, more consistent code.
Would you be interested in joining LogRocket's developer community?
Join LogRocket’s Content Advisory Board. You’ll help inform the type of content we create and get access to exclusive meetups, social accreditation, and swag.
Sign up now