Chrome’s network panel has a number of helpful visualizations for understanding network request/response performance. In this post, I’ll break down the request lifecycle waterfall, and show you how to pipe backend tracing information into the network panel.
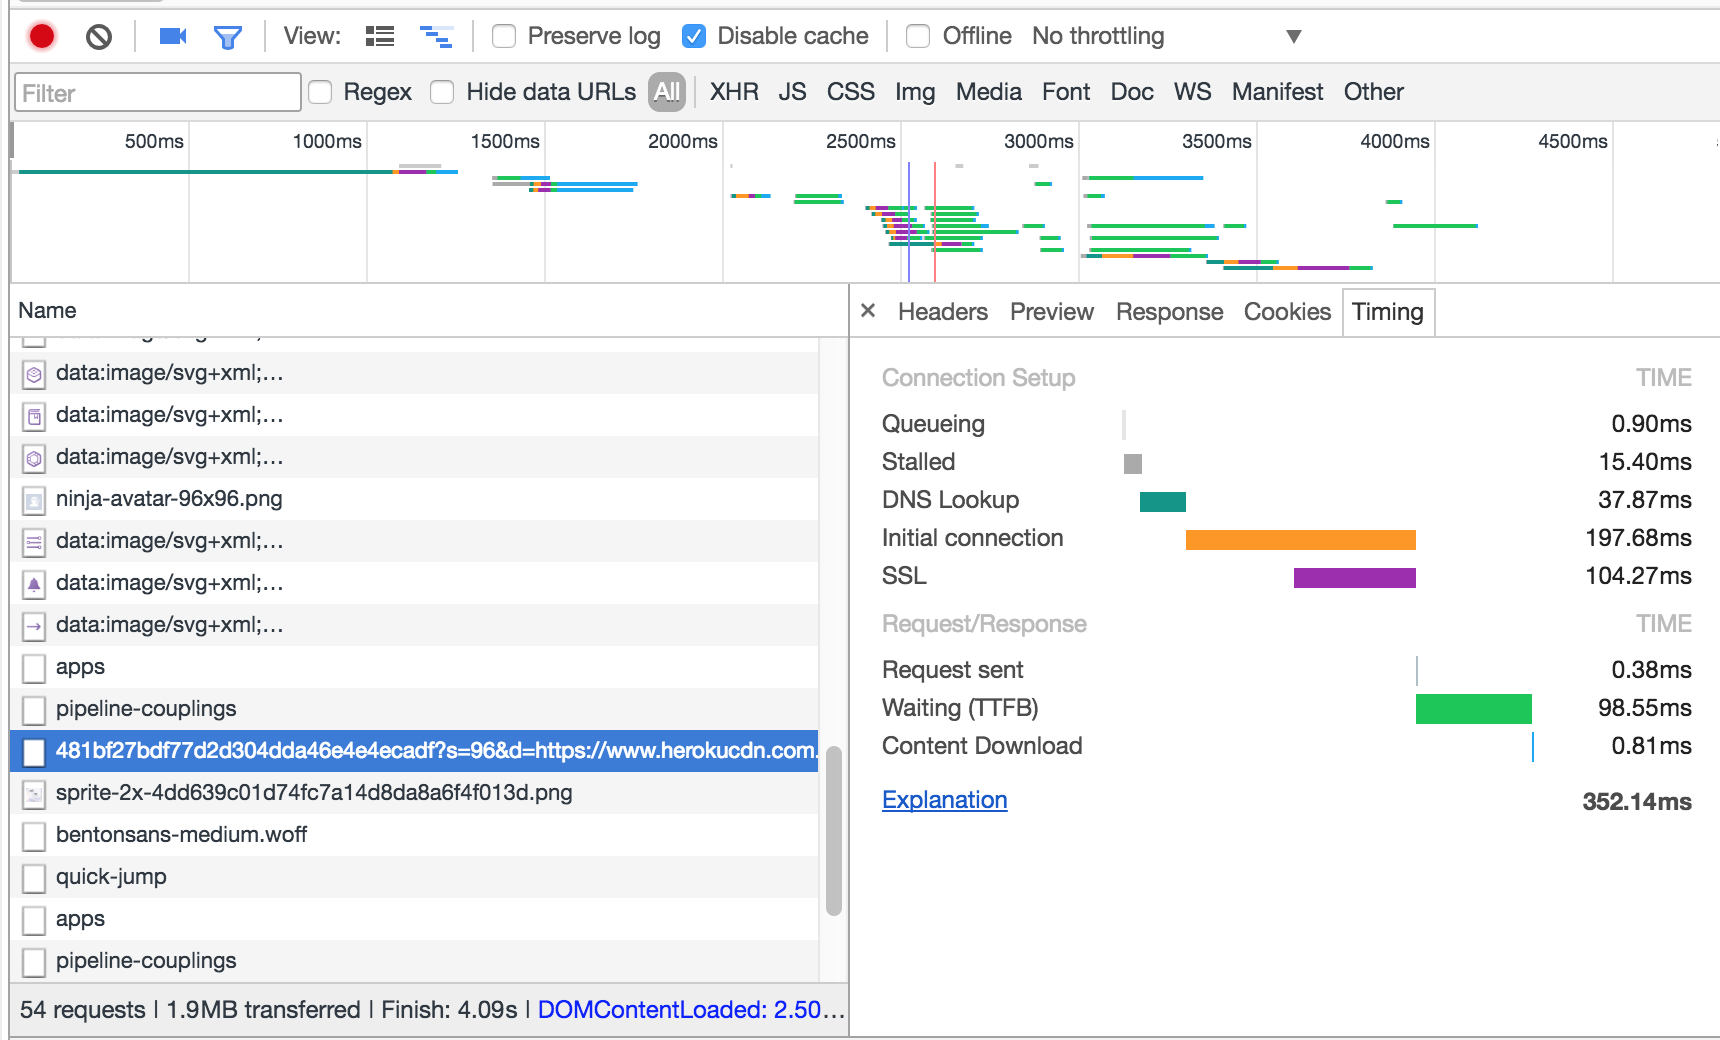
By default, Chrome breaks down the life of a request into 8 parts:
Queueing and Stalled show the time a requests needs to wait before being acted on by the browser. There are a few reasons that a request could be delayed at this stage. Browsers will sometimes prioritize loading resources like scripts, and CSS, before loading other resources. Also, there is a maximum of 6 concurrent TCP connections allowed for HTTP 1 requests.
DNS Lookup, Initial Connection and SSL are fairly self-explanatory- showing the time spent in these respective parts of the request lifecycle.
Request sent is the amount of time it takes the browser to transmit the request to the server. This step is generally very quick, since it represents only the amount of time it takes the browser to dispatch the request.
Waiting (Time to first bite) shows the amount of time the browser needs to wait to start receiving data from the server after making an initial request. During this time, the server does whatever work is required to return the requested resource. In a typical API request, this is where the majority of latency occurs, and is usually the step that developers have the most control over optimizing. With this in mind, it can be helpful to display more granular data on what’s going on “inside” the server, which I’ll explain shortly.
Finally,Content Download is the amount of time it takes to receive the entire stream of bites from the server, after receiving the “first bite”. Latency here is mostly dependent on network connection speed, but obviously optimizing for smaller resources will reduce time in this step.
What goes on in the Waiting (TTFB) step can be a bit of a mystery, since a server could do any number of things when responding to a request. Chrome has an API for sending custom timings from the server using the Server-Timing header:
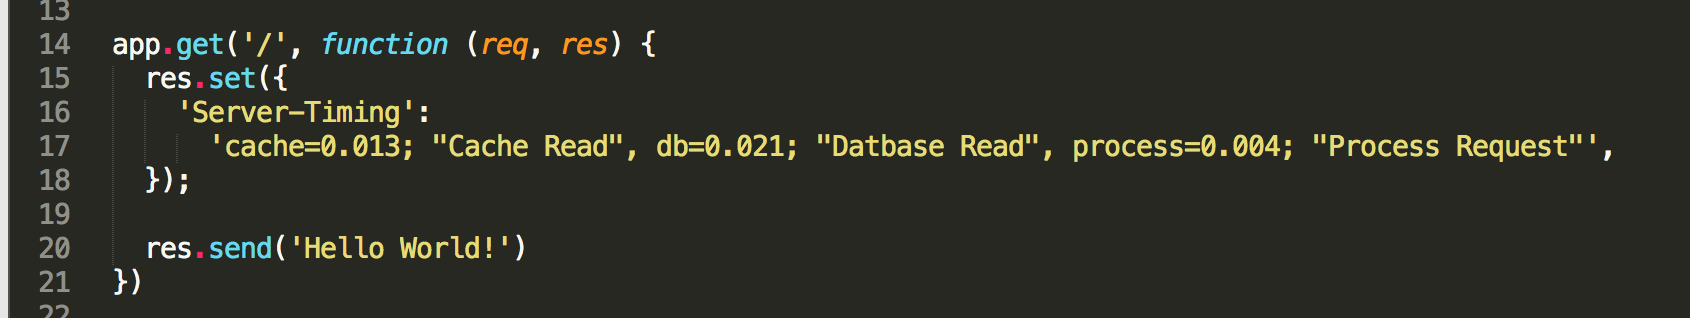
In this basic node/express server, you can see the format of the timing header, which I set for the / request. Here, I hardcoded some example values, but these would normally be filled in programatically.
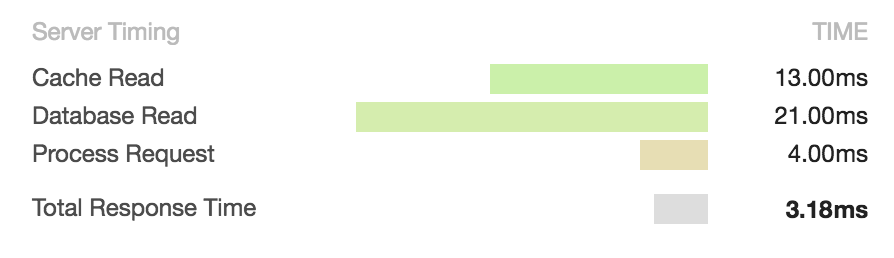
Then, when I hit the / route, the timings show up in the Chrome network panel.
It is easy enough to build up the Server-Timing header manually, but there are also some nice helper libraries like server-timing (on NPM) that have a cleaner API for doing this.
Sending Server-Timing headers is useful when you visit your app and notice latency in QA, since you can understand if a particular action on the server was slow. However, this API is particularly useful if you’re using a frontend logging service like LogRocket, that records all network requests and their headers. Then, if you’re investigating a network request that hung or was extremely slow, you can see the backend timings and figure out what went wrong.
Keep in mind, however, that any timing information you expose is publicly visible so if you exposed the duration of a step likevalidate-password, it could theoretically help a hacker use a timing attack.
The Replay is a weekly newsletter for dev and engineering leaders.
Delivered once a week, it's your curated guide to the most important conversations around frontend dev, emerging AI tools, and the state of modern software.
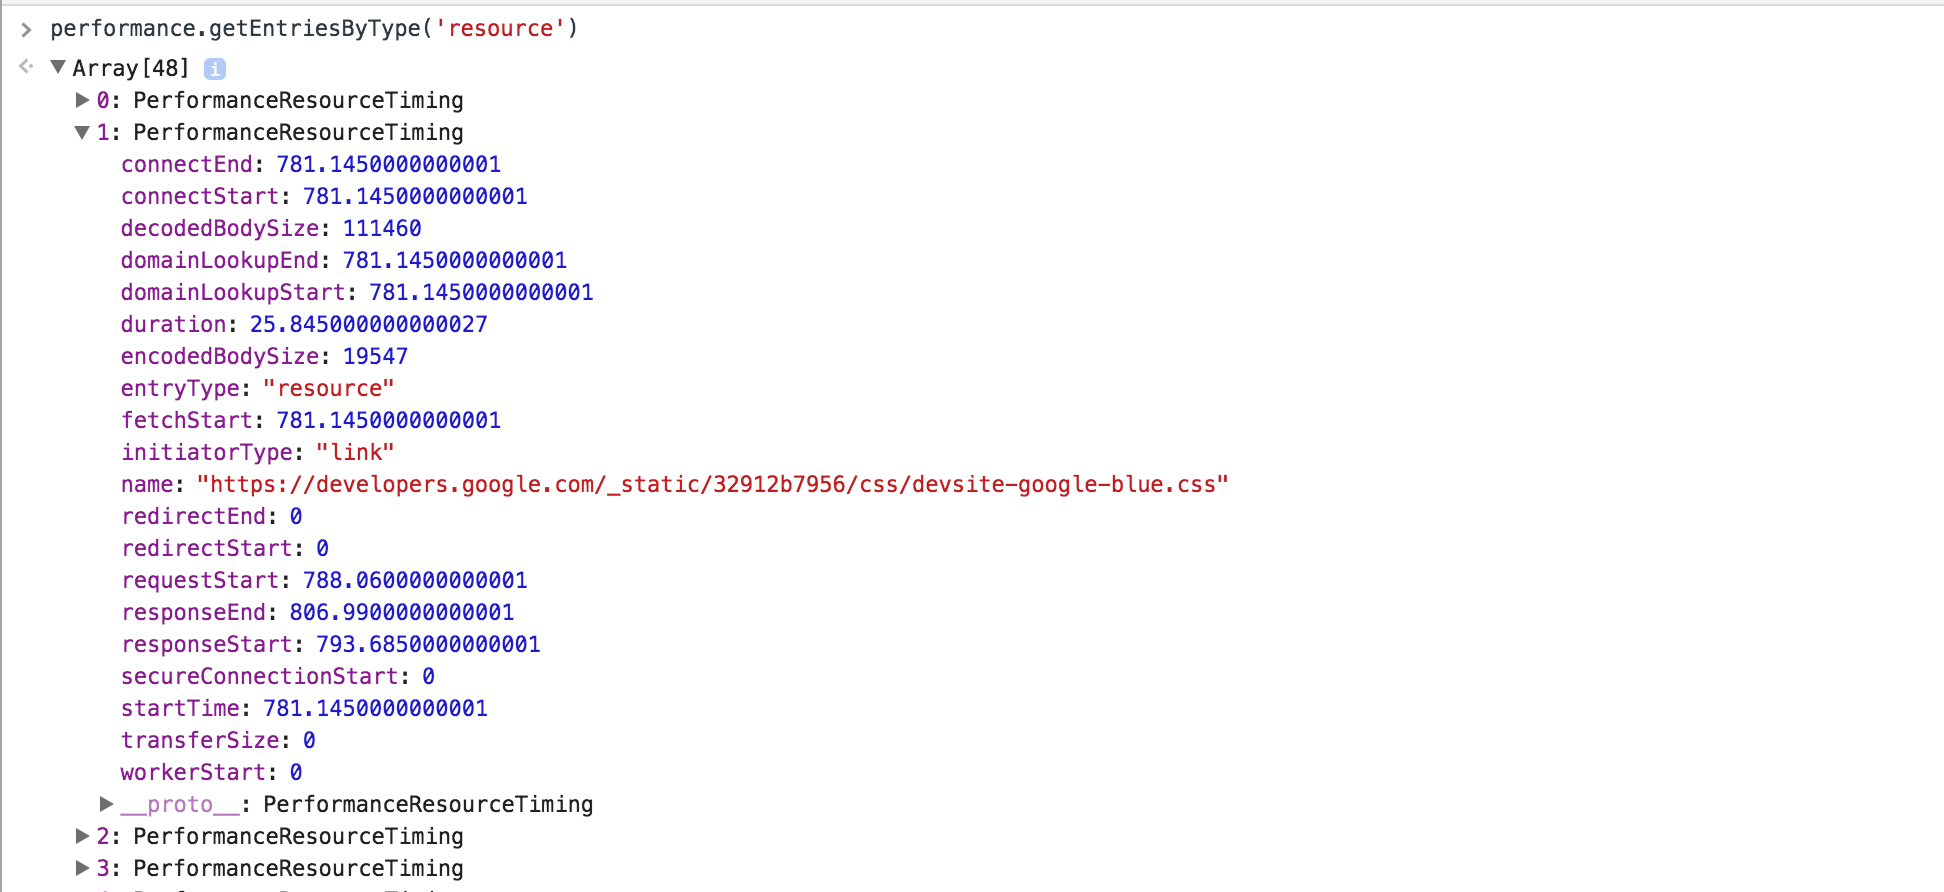
Calling performance.getEntriesByType('resource') returns a list of resources and their respective timings. This is useful for analyzing timings in the JavaScript console, or to grab programmatically in your app and send to an analytics store.
server-timing npm module: https://www.npmjs.com/package/server-timing
Install LogRocket via npm or script tag. LogRocket.init() must be called client-side, not
server-side
$ npm i --save logrocket

// Code:

import LogRocket from 'logrocket';
LogRocket.init('app/id');
// Add to your HTML:

<script src="https://cdn.lr-ingest.com/LogRocket.min.js"></script>
<script>window.LogRocket && window.LogRocket.init('app/id');</script>

I had four weeks to build a complete app from scratch using AI tools like OpenCode and Claude Opus: here’s how it went.

Learn how to build a reusable Vue 3 table engine that powers tables, cards, and lists with shared sorting and pagination logic.

Compare the best React chart libraries for 2026, including Recharts, Nivo, visx, Apache ECharts, MUI X Charts, and more.

Claude Code vs. OpenCode in a real Next.js refactor: benchmark results, mistakes, prompts, and when to use each CLI agent.
Hey there, want to help make our blog better?
Join LogRocket’s Content Advisory Board. You’ll help inform the type of content we create and get access to exclusive meetups, social accreditation, and swag.
Sign up now
