Code coverage has finally made it out of experiments and into Chrome Canary, meaning that it will soon reach general availability. This is an exciting feature that is useful both when working with JavaScript and CSS, so I thought I’d do a quick demo and explore how it can be helpful.
Update: The Code Coverage feature is now shipping with standard Chrome. If you’ve updated to the latest version, there’s no need to use Canary!
Code coverage lets you run your web app, and for each JS/CSS file, see which lines of code ran and which didn’t.
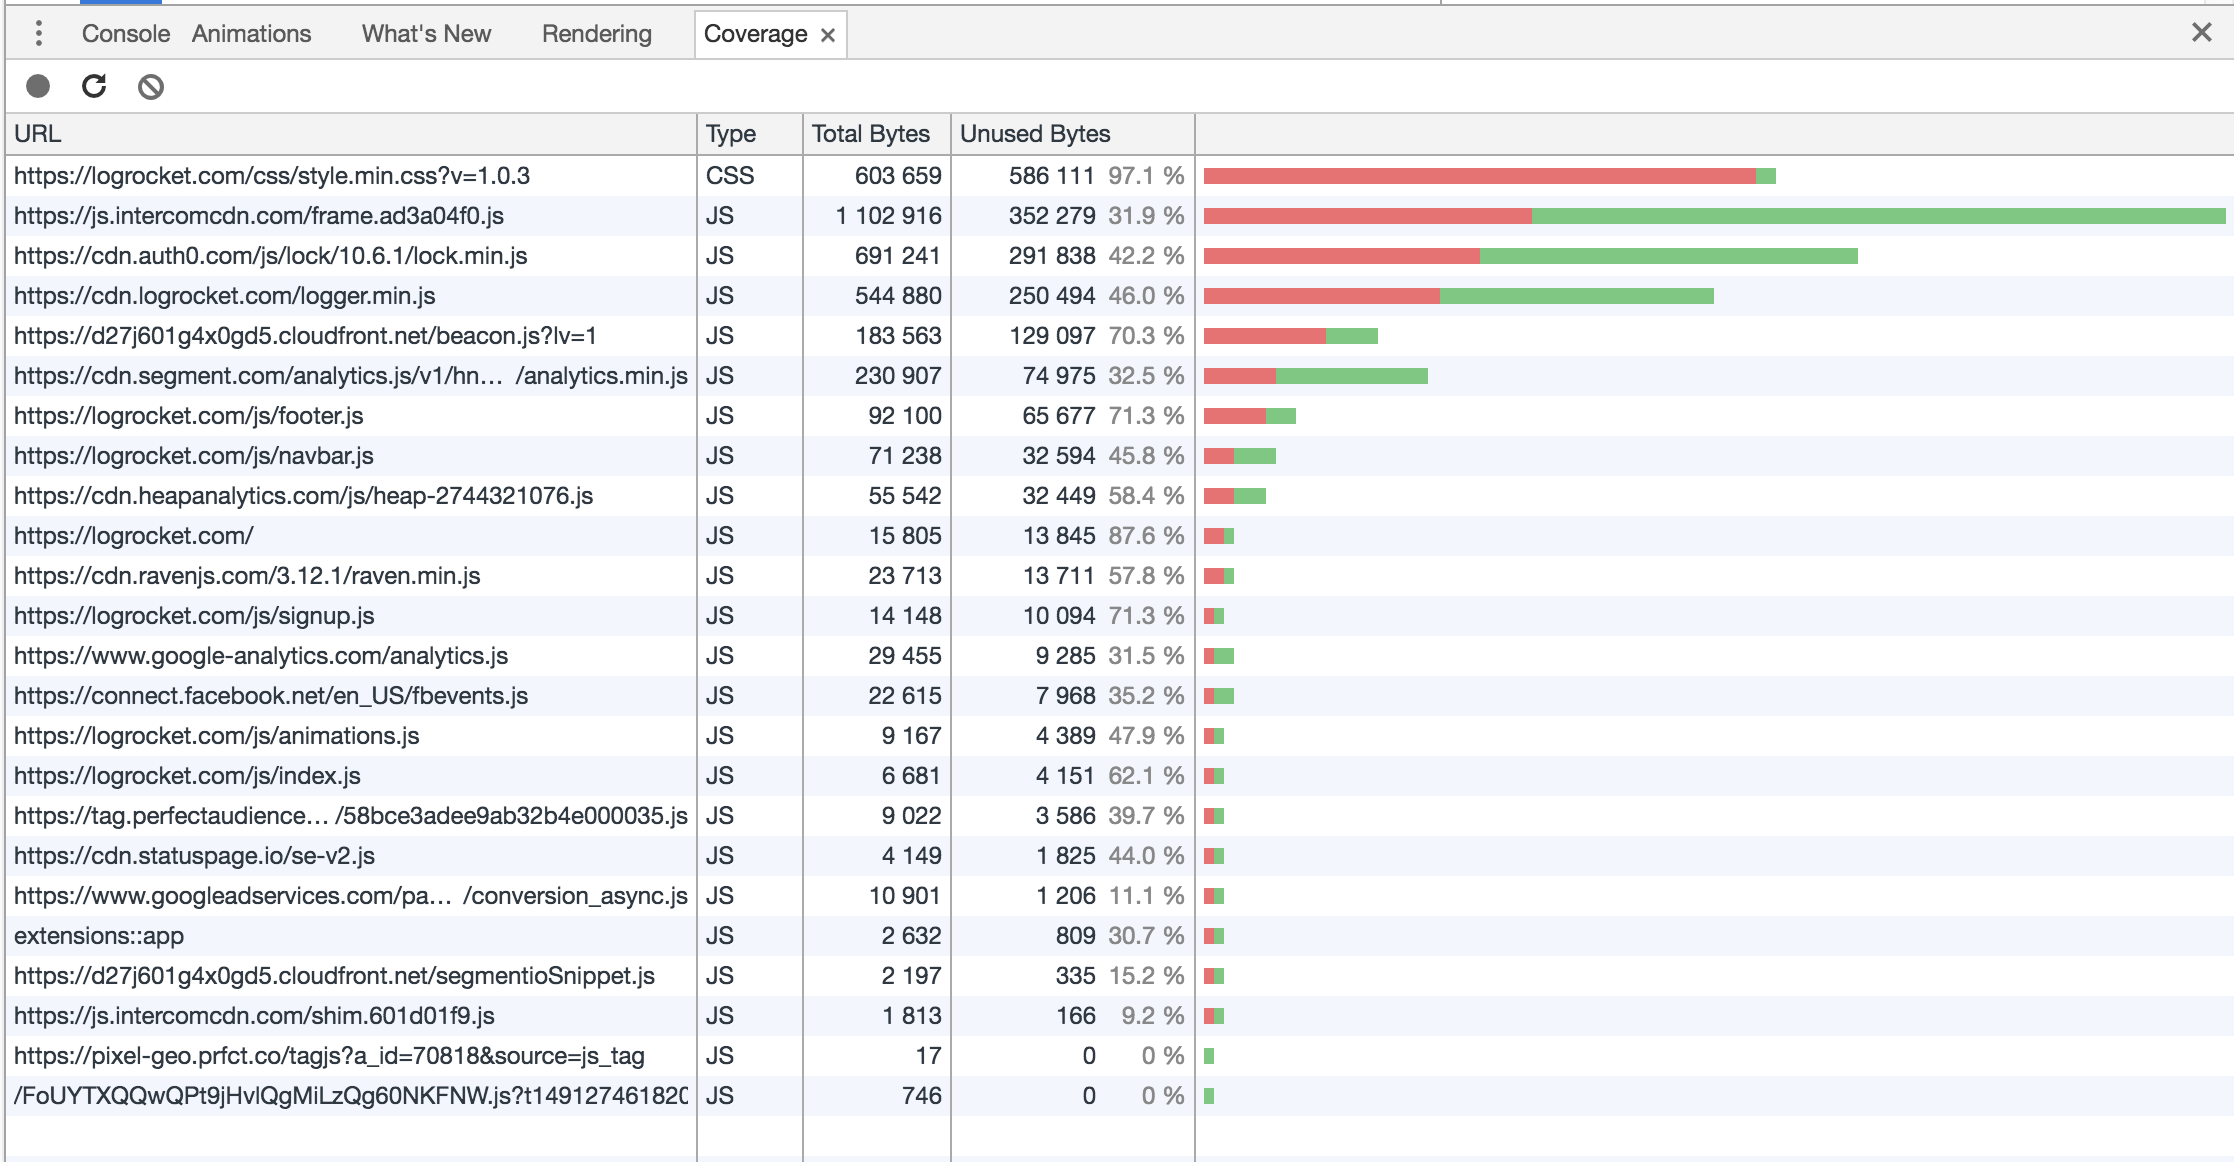
Here, I ran a simple static web page- and Chrome generated this breakdown of the CSS and JS files that were present on the page. The bars on the right show the relative size of each file, red representing unused code, and green showing code that ran.
Recording code coverage works similarly to the devtools timeline- you hit record and then interact with your site normally. When you’re done, Chrome does some calculations and generates the readout. Here, I was curious about how much unused CSS was on the site, so I navigated to the various sub-pages to make sure that I hit every css “code path”. Sure enough- there’s a lot of room for improvement here, as 97% of the css on my site was unused!
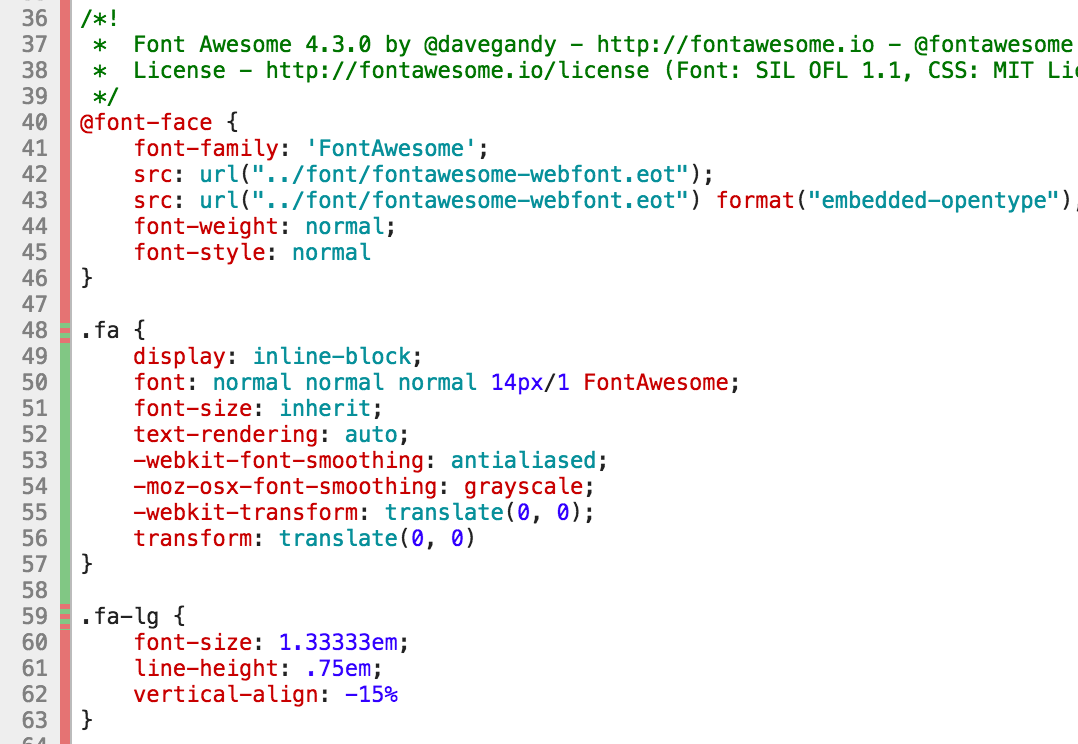
Chrome also lets you drill down into an individual file’s code coverage. Here, the red/green bar on the left shows which specific lines ran and which didn’t. Note that when inspecting minified files, you can press the button in the lower-left corner of file to “prettify” the code.
When working on a complex or long-term project, it is easy to accumulate dead code. If you’re using webpack or another JS build system, there are tools for preventing most dead JS code from making it to production. But for CSS, it can be a bit trickier to do this. Having this coverage tool in Chrome is a great way to get a quick overview of how much extra code you’re shipping, and which files to optimize.
Download Chrome Canary or wait a few weeks for it to reach regular Chrome.
Install LogRocket via npm or script tag. LogRocket.init() must be called client-side, not
server-side
$ npm i --save logrocket

// Code:

import LogRocket from 'logrocket';
LogRocket.init('app/id');
// Add to your HTML:

<script src="https://cdn.lr-ingest.com/LogRocket.min.js"></script>
<script>window.LogRocket && window.LogRocket.init('app/id');</script>
Would you be interested in joining LogRocket's developer community?
Join LogRocket’s Content Advisory Board. You’ll help inform the type of content we create and get access to exclusive meetups, social accreditation, and swag.
Sign up now
Discover how to use Gemini CLI, Google’s new open-source AI agent that brings Gemini directly to your terminal.

This article explores several proven patterns for writing safer, cleaner, and more readable code in React and TypeScript.

A breakdown of the wrapper and container CSS classes, how they’re used in real-world code, and when it makes sense to use one over the other.

This guide walks you through creating a web UI for an AI agent that browses, clicks, and extracts info from websites powered by Stagehand and Gemini.


One Reply to "Using the Chrome devtools new code coverage feature"
Hi Ben, i hope you doing great! A question: do you know any easy ways to see (filter) only the used or only the unused code parts in the Coverage pane? Best, Wiktor