If you walk into your kitchen to find your favorite vase smashed on the floor, it might be safe to assume that the grinning cat nearby was the root cause of this problem. If only it was this simple in business and we could just say “the cat did it.” Product problems are often much more complex and connected to a variety of root causes.

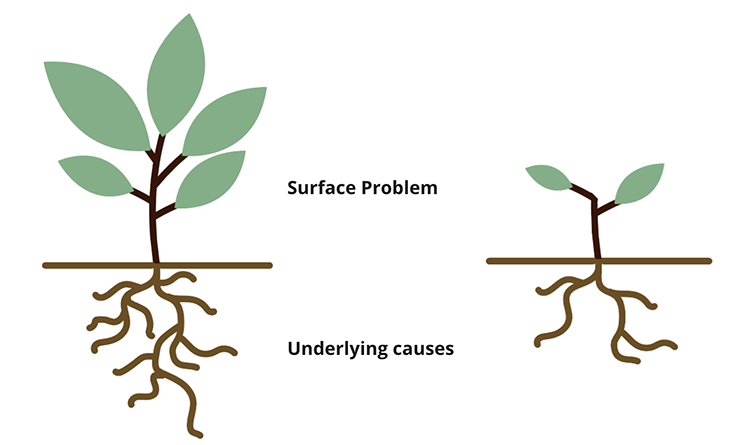
If you think of a weed, the surface is only the problem you can immediately see. However, if you cut the weed from the ground level, it’s likely to grow back from the root. This is just like fixing product problems with a band-aid with little to no investigation of a root cause — it’s likely to return.
These types of problems need a more thorough root cause analysis (RCA) to determine how, and why the problem happened, and how to prevent it in the future.
Root cause analysis is a tool you can utilize when determining the true cause of a problem. You might have assumptions about what the cause of a problem might be or experience biases towards one as the main cause.
Performing a root cause analysis can help you determine what the underlying causes of a problem are to help address a more impactful and valuable solution:
When you’re trying to uncover the roots of a problem, it can be daunting to figure out where to start. The process to conduct a root cause analysis can be broken down into a few easy steps:
A clear definition of the problem is the first step. Sometimes problems are easy to identify, like a broken link. More often, problems can be abstract and need clarification, like a decrease in overall purchases through a site or an increase in bugs reported.
Here are some more examples of problems:
It’s also critical to understand how to define a problem:
| How to define a problem: | Description |
| Evaluate the urgency | Is this a currently existing issue? Could it become a larger problem? Has this problem occurred before and could it happen again? |
| Describe the impact | How does this impact the business? How do the numbers compare to the baseline? What are some of the unintended consequences of this problem?
A business with seasonal needs, such as tax preparation products, will see an increase in their average number of customer service calls during tax season. If not prepared for an increase in call volume, they could experience an increase of customer dropped calls, lower NPS scores, and a big impact to their overall business success. |
| Collect evidence | Review KPIs, usage data, and anything that might highlight the problem. Talk with stakeholders, and, if possible, users who are directly impacted by the problem. Sometimes, you might hear of a “huge” problem from a user only to find out that the impact is quite small overall from data evidence.
Collecting evidence to evaluate the impact is a crucial step to ensure you’re not over or under reacting to a problem. See more about data collection below to learn about common key metrics in a RCA. |
Using tools like a fishbone analysis and the Five Whys framework can help you put together causes and start to categorize themes of the problem. When going through a Five Whys diagram, try to come up with a few alternate pathways and you might notice overlapping areas.
Each example of a Five Whys diagram is accurate, but only looking at one cause can prevent you from understanding the fuller picture. For example, there was more than one reason why the Fyre Festival failed and it’s important to identify overlapping themes to avoid leaning on only one cause:
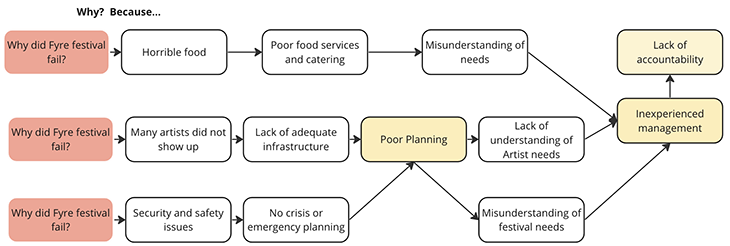
In a product example, there might be numerous reasons why session times have decreased, or user reported bugs are up.
After evaluating the size, impact, general cause themes, and urgency of the problem, you’ll have a better understanding of how much effort will be needed for the analysis. The larger the problem on the surface, the more underlying causes you might find. Even simple problems can sometimes have numerous causes to consider and you need to determine how in-depth you need to dig to “unroot” the causes.
It’s also critical to check all your bases. Once you have evaluated and categorized the different potential causes to a problem, use the following as a checklist to ensure you’re covering all areas of where and how this problem happened. Be sure to identify any changes or recent events that might have occurred that could have impacted the problem.
Collecting evidence is a key part of a root cause analysis. Without evidence, your problem causes are based on assumptions and potentially harmful biases.
Start evaluating any data you might have available. Using session replay tools like LogRocket can help you collect evidence of the problem. Here are a couple of examples of the type of data that can be used to collect evidence:
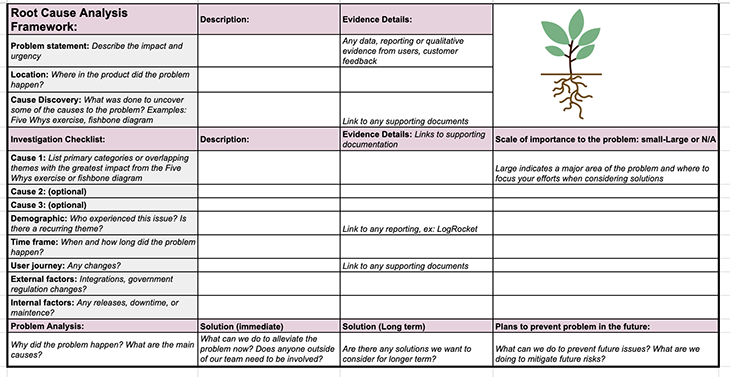
Collect your evidence and root cause evaluation into an RCA template. Once you have your causes identified and your discovery efforts into one root cause analysis report, you can start creating a plan to address the problem and prevent it from happening in the future.
Collaborate with a team to brainstorm solutions and discuss which options might address multiple causes. Evaluate if you need both a short-term and long-term solution, depending on the level of effort and urgency required. As part of your analysis report, discuss how you can avoid this problem again in the future and any other risk mitigation plans.
You can use this root cause analysis template on Google Sheets to organization your investigation, collect your evidence, and share with your team to determine next step solutions:
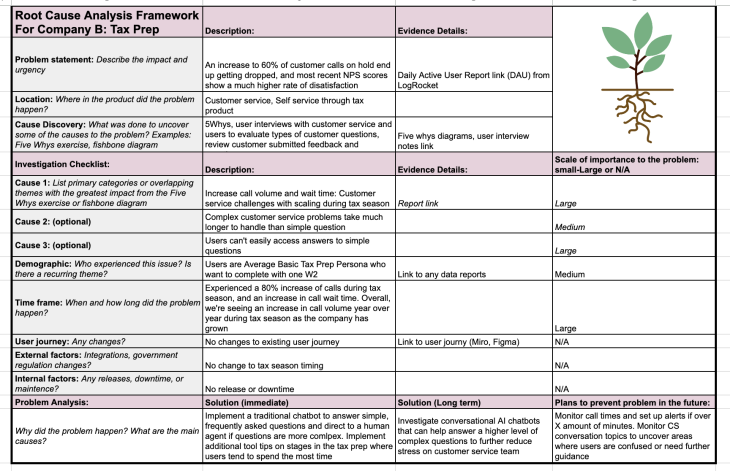
Below is an RCA for Company B, a tax preparation product that experienced an increase in dropped customer calls.
Company B experienced an increase of 60 percent of customers on hold that ended up dropping their call. They also experienced an increase in NPS dissatisfaction and have concerns about losing customers.
After going through a root cause analysis, they discovered an 80 percent increase in user calls during tax season. This increase of call volume indicated much longer wait times to speak to a live agent.
After investigating some of the customer call reasons, they discovered that numerous customers had simple questions that could be answered quickly without too much support.
Company B gathered call logs that confirmed their suspicions. They brought the logs together that demonstrated the simplicity of repeated questions and gathered records of customers that dropped off after a certain amount of time on the phone.
Company B implemented a conversational AI chatbot that could answer generic questions and direct more complex questions to a live agent. Further, they implemented tooltips throughout the tax process flow to help users that appeared to be stuck.
Through the RCA process, you might discover that some parts of the user’s experience are confusing and create a plan to address minor UI challenges.
These solutions helped Company B improve their accessibility and scalability needs during an increase in call volume, without having to add more employee support. Going forward, Company B can plan to monitor call times and continuously evaluate customer service topics to determine where users might need further support and guidance in the future:
There are a number of easy-to-fall-into traps when performing root cause analysis, including:
A root cause analysis can be a great tool to help you uncover the true causes of a problem and reduce any reliance on assumptions or biases. With the right investigation and evidence collection, you can learn more about how and why a problem happened and identify causes below the surface.
RCA can ensure your solutions address the root problem and help you better plan for the future.
Featured image source: IconScout
LogRocket identifies friction points in the user experience so you can make informed decisions about product and design changes that must happen to hit your goals.
With LogRocket, you can understand the scope of the issues affecting your product and prioritize the changes that need to be made. LogRocket simplifies workflows by allowing Engineering, Product, UX, and Design teams to work from the same data as you, eliminating any confusion about what needs to be done.
Get your teams on the same page — try LogRocket today.

Act fast or play it safe? Product managers face this daily. Here’s a smarter way to balance risk, speed, and responsibility.

Emmett Ryan shares how introducing agile processes at C.H. Robinson improved accuracy of project estimations and overall qualitative feedback.

Suvrat Joshi shares the importance of viewing trade-off decisions in product management more like a balance than a compromise.

Great product managers spot change early. Discover how to pivot your product strategy before it’s too late.